| Param | Original file | Final file |
|---|---|---|
| Filename | modeM0/AS1G05_235T01_9000000590_04703cztM0_level2.evt | modeM0/AS1G05_235T01_9000000590_04703cztM0_level2_quad_clean.evt |
| Size (bytes) | 556,289,280 | 85,440,960 |
| Size | 530.5 MB | 81.5 MB |
| Events in quadrant A | 2,929,443 | 559,259 |
| Events in quadrant B | 3,163,191 | 568,201 |
| Events in quadrant C | 3,151,966 | 548,853 |
| Events in quadrant D | 7,186,001 | 481,488 |
| Mode SS | |||
|---|---|---|---|
| Quadrant | BADHDUFLAG | Total packets | Discarded packets |
| A | 0 | 126 | 0 |
| B | 0 | 126 | 0 |
| C | 0 | 126 | 0 |
| D | 0 | 126 | 0 |
| Mode M9 | |||
|---|---|---|---|
| Quadrant | BADHDUFLAG | Total packets | Discarded packets |
| A | 0 | 14 | 0 |
| B | 0 | 14 | 0 |
| C | 0 | 14 | 0 |
| D | 0 | 15 | 0 |
| Mode M0 | |||
|---|---|---|---|
| Quadrant | BADHDUFLAG | Total packets | Discarded packets |
| A | 0 | 12946 | 3 |
| B | 0 | 13534 | 2 |
| C | 0 | 13530 | 2 |
| D | 0 | 25609 | 2 |
| Quadrant | Total seconds | Saturated seconds | Saturation percentage |
|---|---|---|---|
| A | 6143 | 69 | 1.123230% |
| B | 6143 | 59 | 0.960443% |
| C | 6143 | 147 | 2.392968% |
| D | 6143 | 1049 | 17.076347% |
Noise dominated data is calculated using 1-second bins in cleaned event files. If a bin has >2000 counts, and if more than 50% of those come from <1% of pixels, then it is considered to be noise-dominated and hence unusable.
| Quadrant | # 1 sec bins | Bins with >0 counts | Bins with >2000 counts | High rate bins dominated by noise | Noise dominated (total time) | Noise dominated (detector-on time) | Marked lightcurve |
|---|---|---|---|---|---|---|---|
| A | 7453 | 6144 | 16 | 16 | 0.21% | 0.26% | 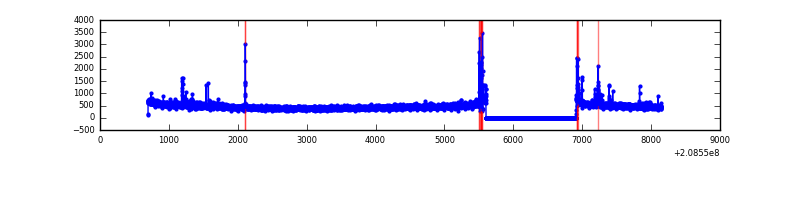 |
| B | 7453 | 6144 | 18 | 18 | 0.24% | 0.29% | 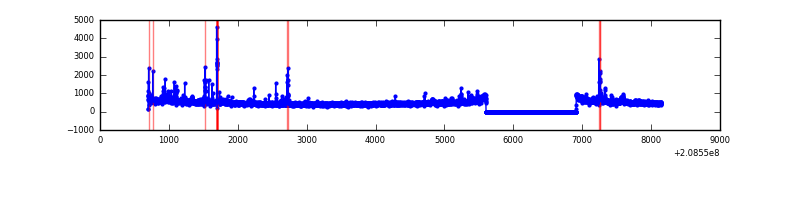 |
| C | 7453 | 6144 | 104 | 104 | 1.40% | 1.69% | 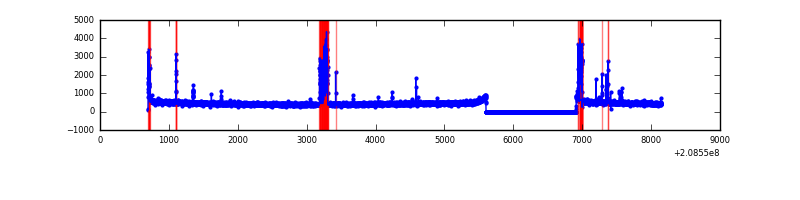 |
| D | 7453 | 6144 | 1001 | 1001 | 13.43% | 16.29% | 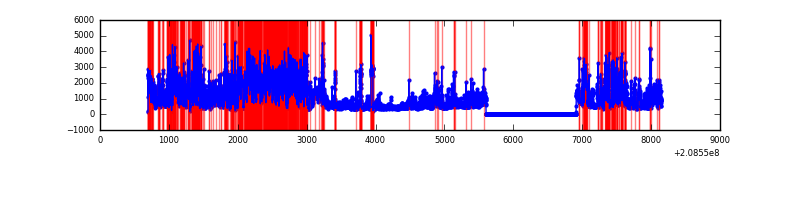 |
Top three noisy pixels from each quadrant. If the there are fewer than three noisy pixels in the level2.evt file, extra rows are filled as -1
| Pixel properties | Quadrant properties | ||||||
|---|---|---|---|---|---|---|---|
| Quadrant | DetID | PixID | Counts | Sigma | Mean | Median | Sigma |
| A | 0 | 118 | 76059 | 506.93 | 733 | 720 | 148.6 |
| A | 0 | 226 | 14031 | 89.57 | 733 | 720 | 148.6 |
| A | 0 | 50 | 12136 | 76.81 | 733 | 720 | 148.6 |
| B | 15 | 204 | 75028 | 523.97 | 748 | 731 | 141.8 |
| B | 14 | 167 | 62472 | 435.42 | 748 | 731 | 141.8 |
| B | 15 | 54 | 41132 | 284.92 | 748 | 731 | 141.8 |
| C | 9 | 68 | 229595 | 1388.54 | 713 | 717 | 164.8 |
| C | 9 | 247 | 123280 | 743.56 | 713 | 717 | 164.8 |
| C | 7 | 158 | 10856 | 61.51 | 713 | 717 | 164.8 |
| D | 2 | 63 | 4140358 | 25794.86 | 667 | 649 | 160.5 |
| D | 13 | 235 | 122358 | 758.38 | 667 | 649 | 160.5 |
| D | 2 | 14 | 109731 | 679.7 | 667 | 649 | 160.5 |
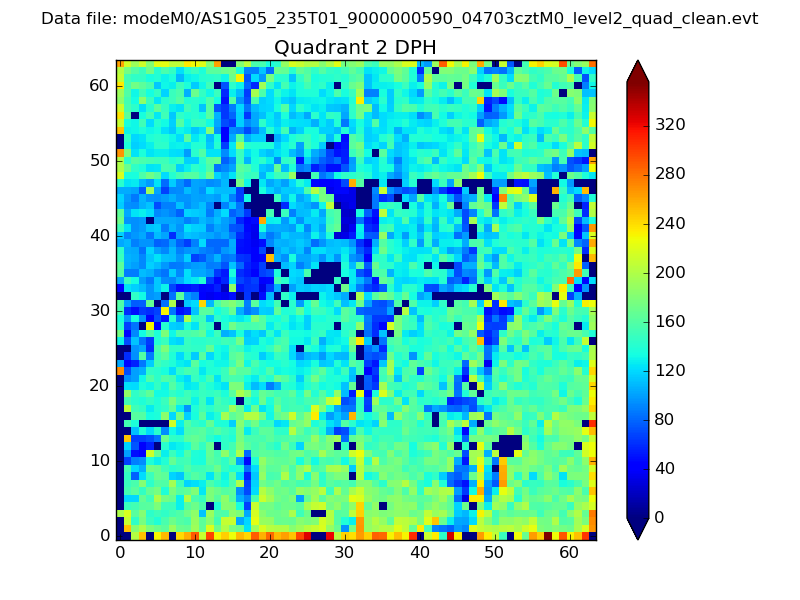
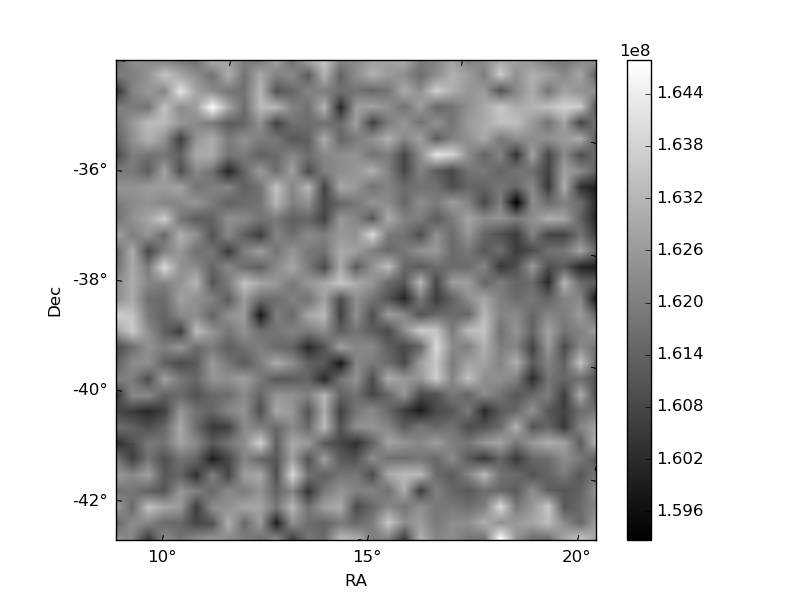
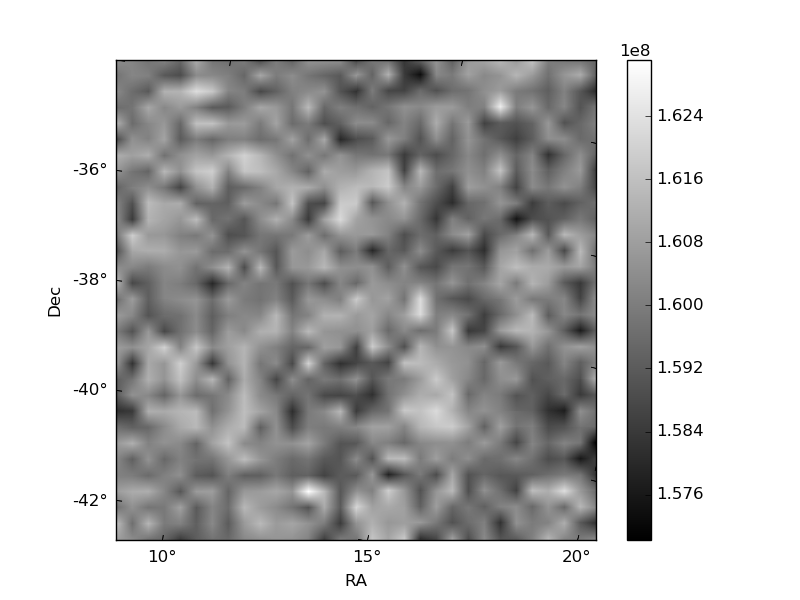
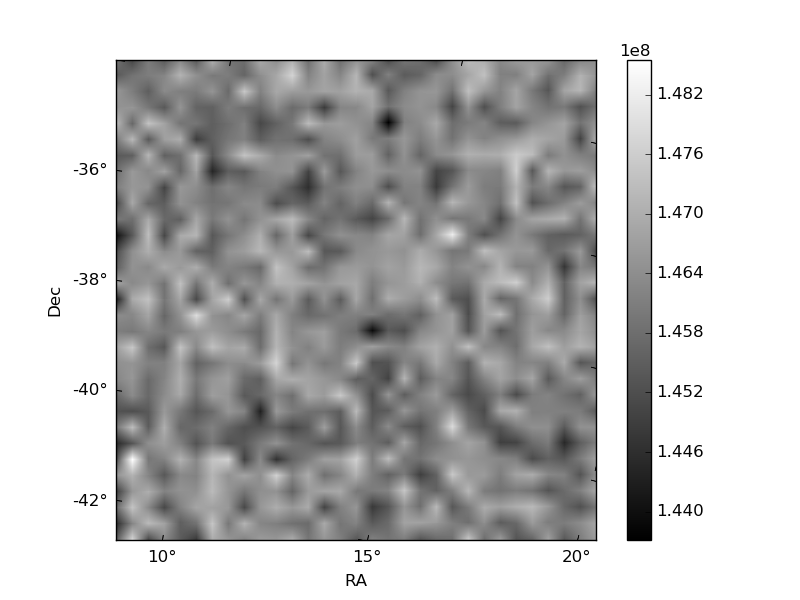
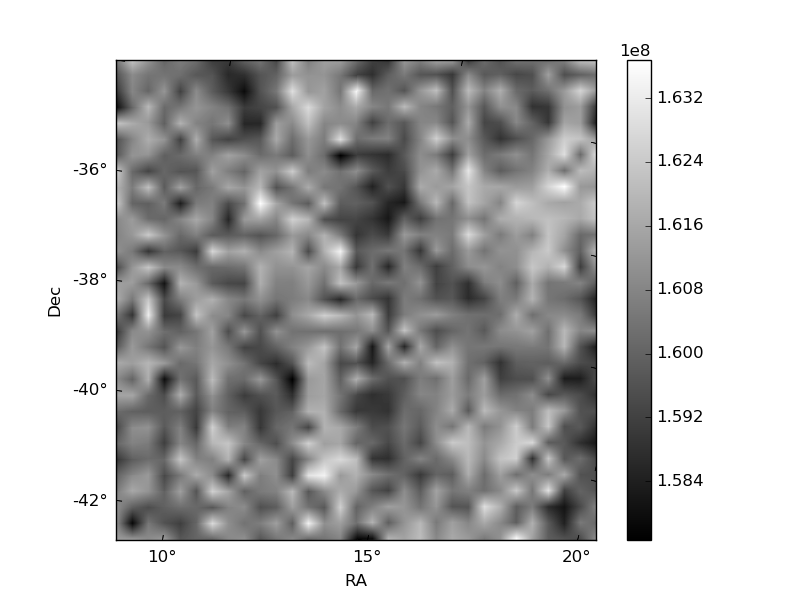
Histogram calculated using DETX and DETY for each event in the final _common_clean file
| Quadrant A | 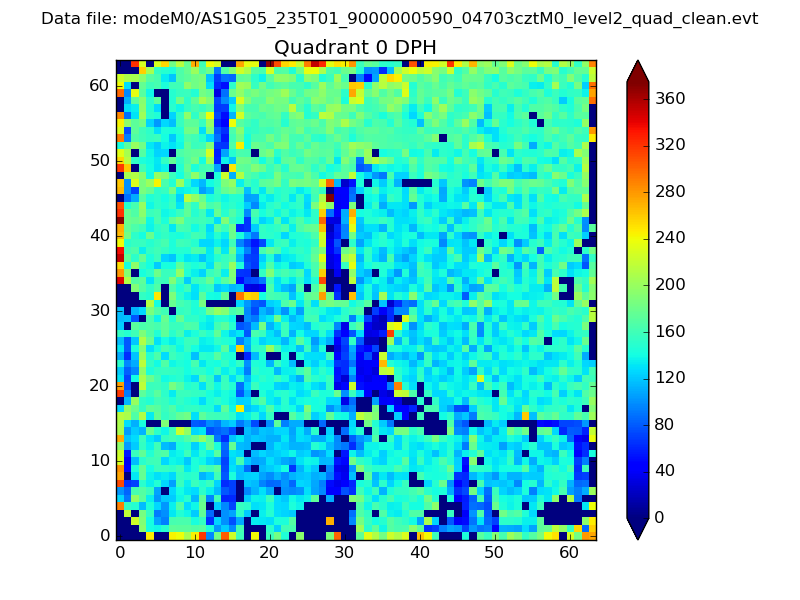 |
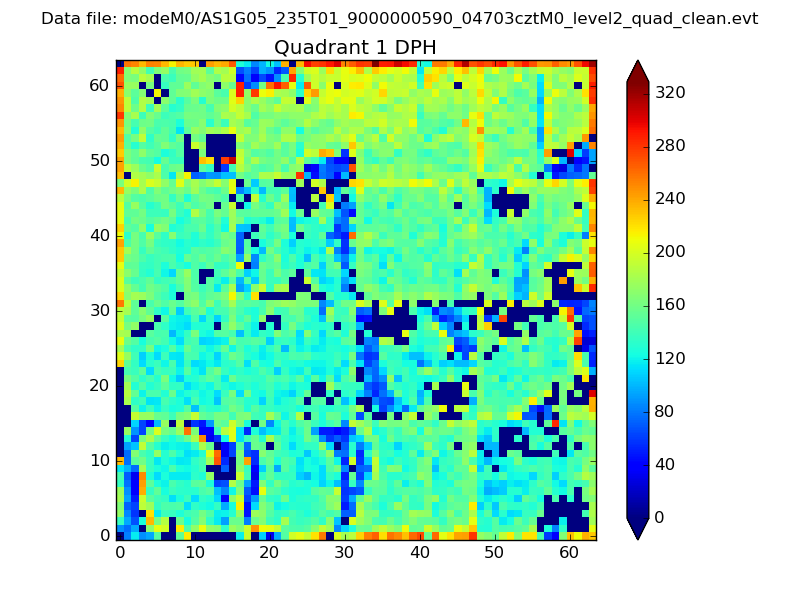 |
Quadrant B |
|---|---|---|---|
| Quadrant D | 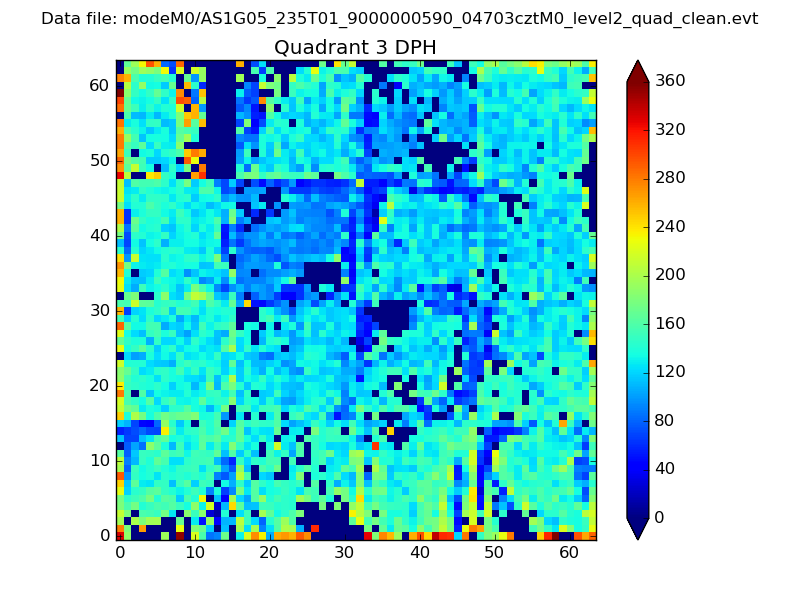 |
 |
Quadrant C |
| Plot type | Count rate plots | Images |
|---|---|---|
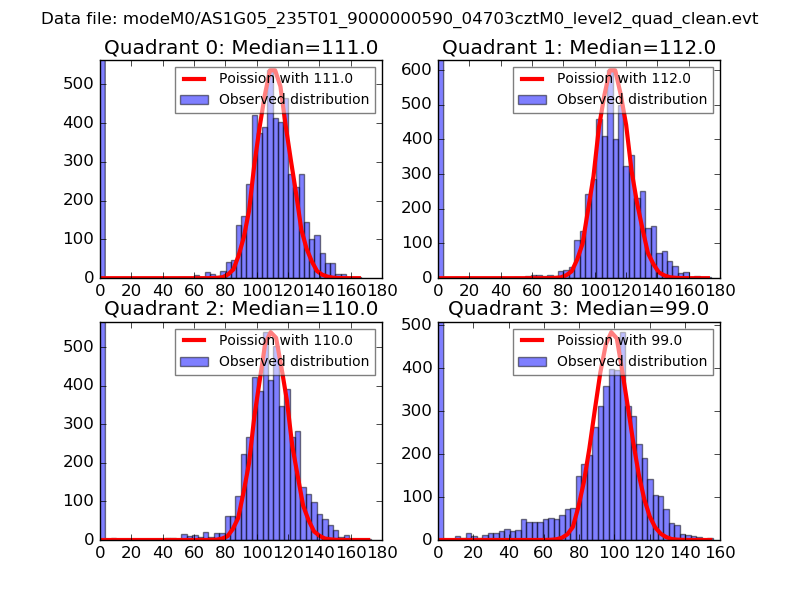
| Comparison with Poisson distribution Blue bars denote a histogram of data divided into 1 sec bins. Red curve is a Poisson curve with rate = median count rate of data. |
 |
 |
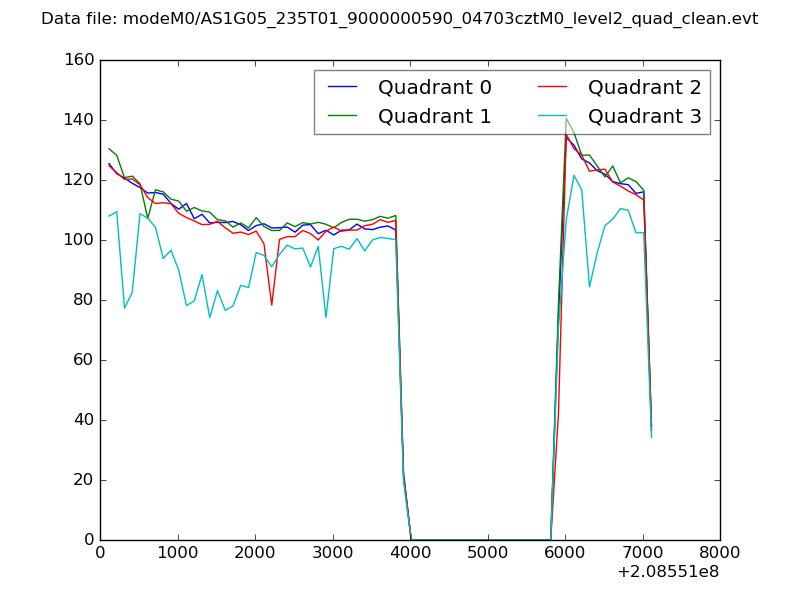
| Quadrant-wise count rates Data is divided into 100 sec bins |
 |
|
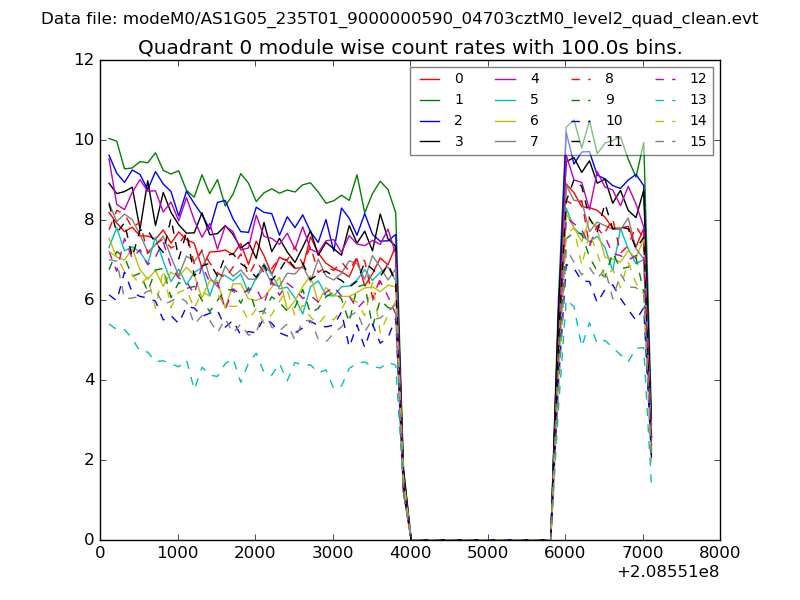
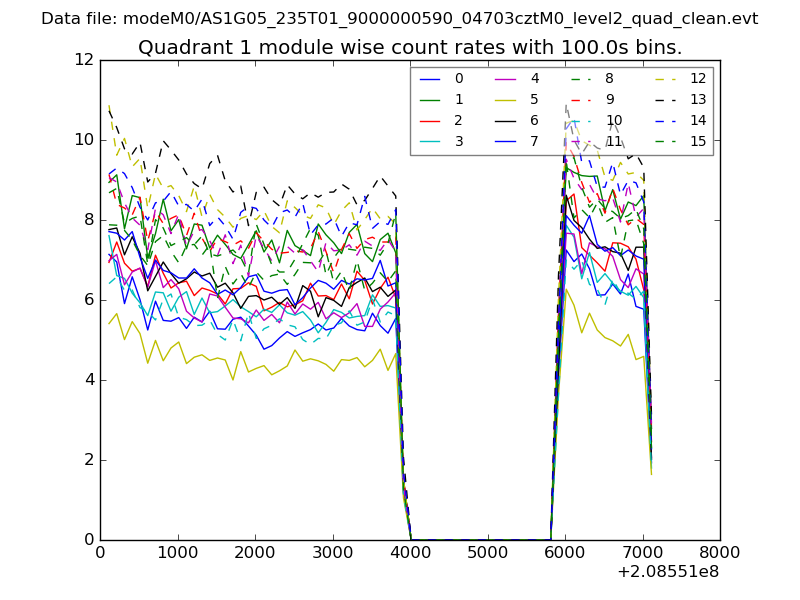
| Module-wise count rates for Quadrant A Data is divided into 100 sec bins |
 |
 |
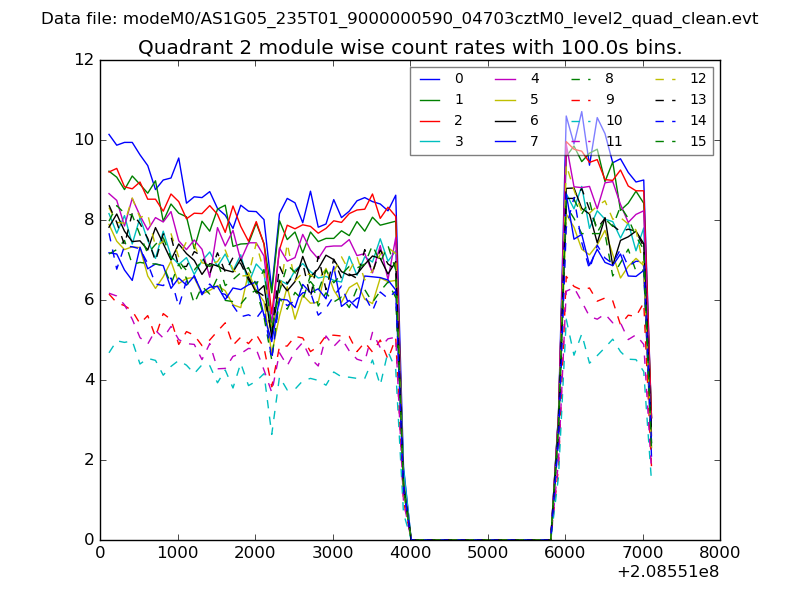
| Module-wise count rates for Quadrant B Data is divided into 100 sec bins |
 |
 |
| Module-wise count rates for Quadrant C Data is divided into 100 sec bins |
 |
 |
| Module-wise count rates for Quadrant D Data is divided into 100 sec bins |
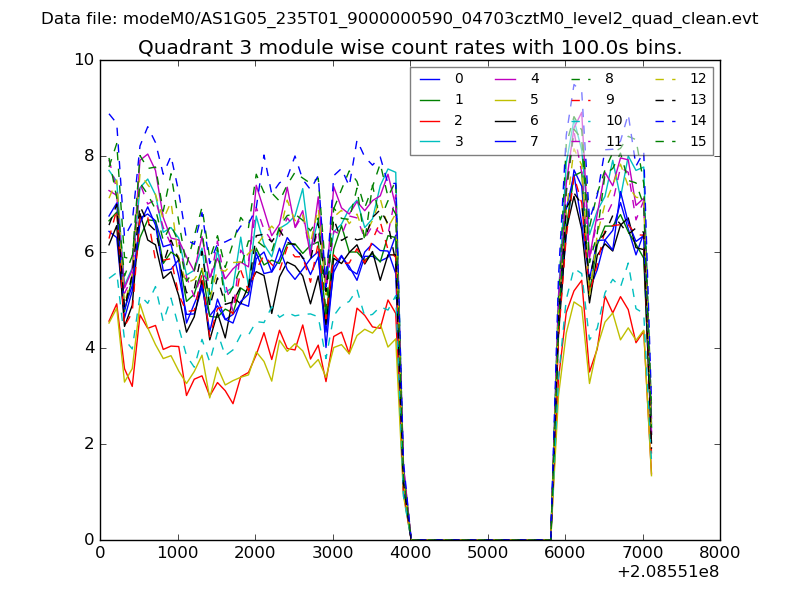 |
 |
| Parameter | Plot |
|---|---|
| CZT HV Monitor | 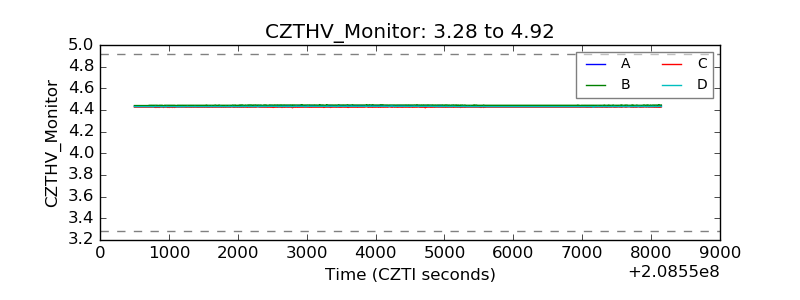 |
| D_VDD | 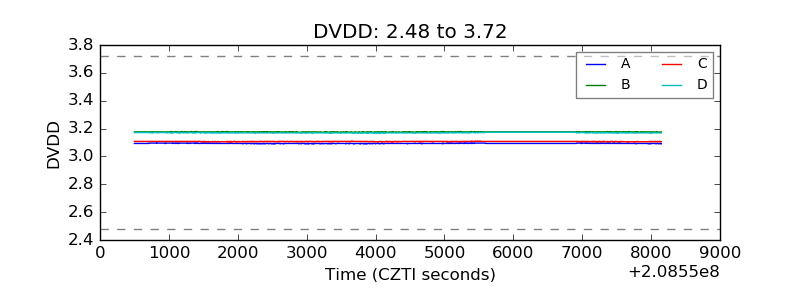 |
| Temperature 1 | 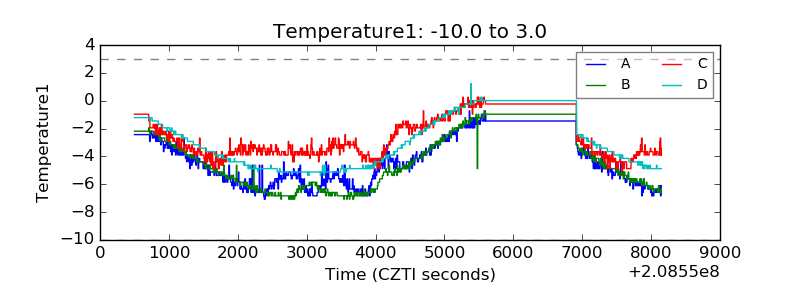 |
| Veto HV Monitor | 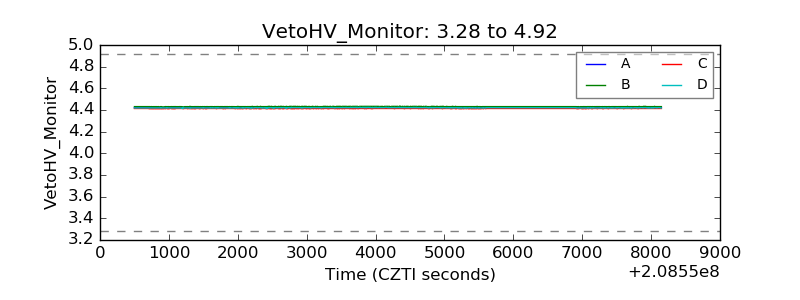 |
| Veto LLD | 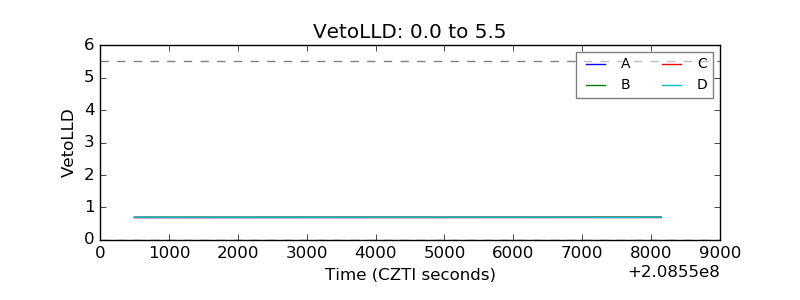 |
| Alpha Counter | 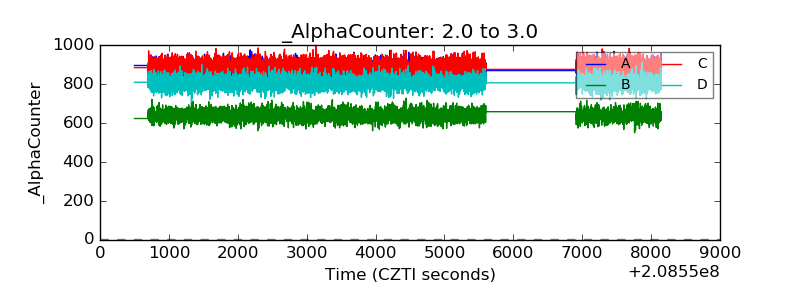 |
| _CPM_Rate | 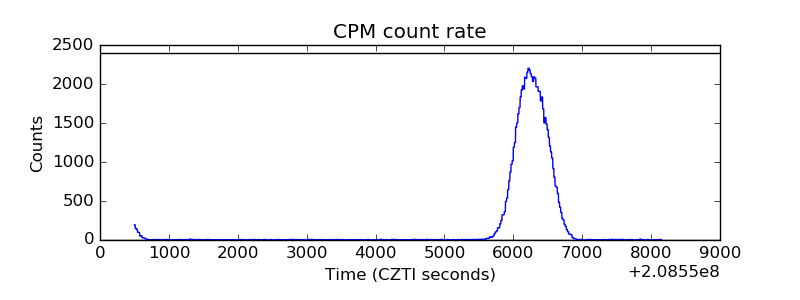 |
| CZT Counter | 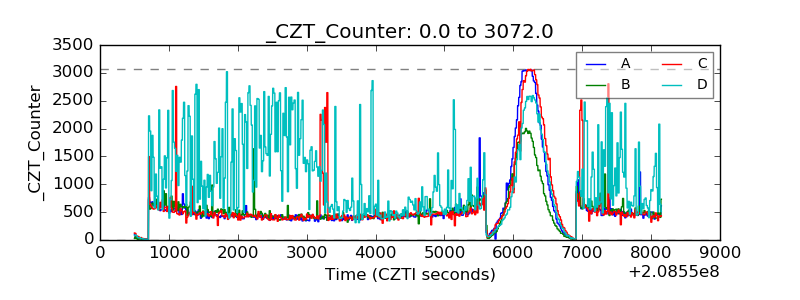 |
| +2.5 Volts monitor | 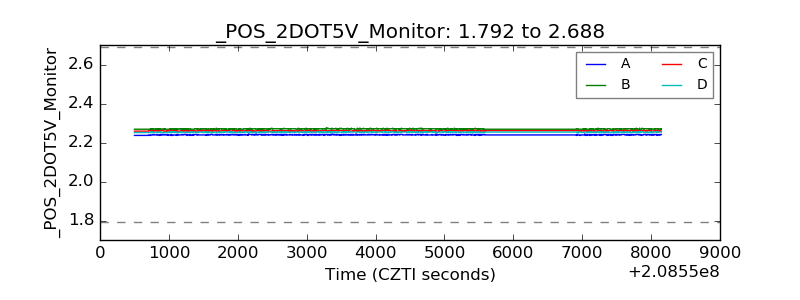 |
| +5 Volts monitor | 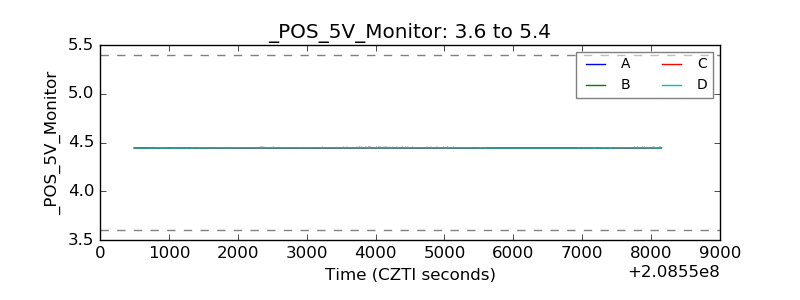 |
| _ROLL_ROT | 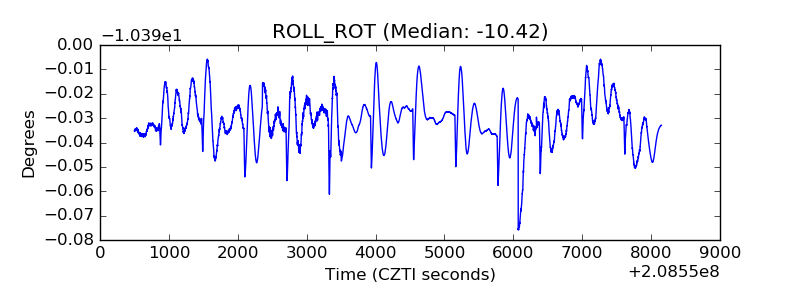 |
| _Roll_DEC | 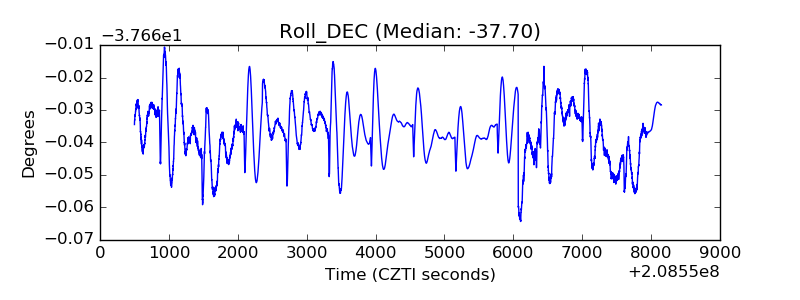 |
| _Roll_RA | 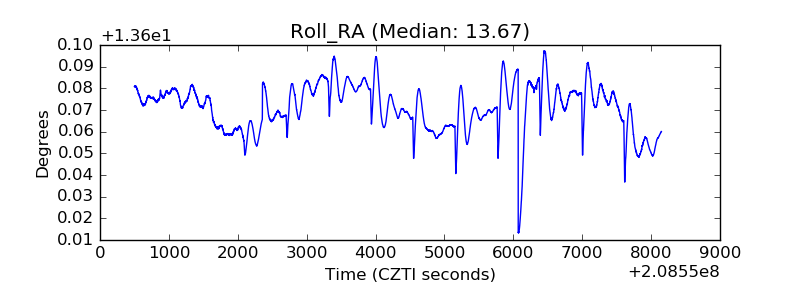 |
| Veto Counter | 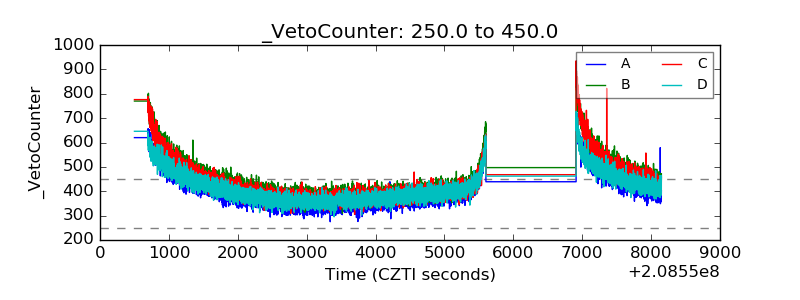 |