| Param | Original file | Final file |
|---|---|---|
| Filename | modeM0/AS1G05_235T01_9000000590_04705cztM0_level2.evt | modeM0/AS1G05_235T01_9000000590_04705cztM0_level2_quad_clean.evt |
| Size (bytes) | 304,447,680 | 28,912,320 |
| Size | 290.3 MB | 27.6 MB |
| Events in quadrant A | 1,541,905 | 173,035 |
| Events in quadrant B | 1,555,343 | 175,685 |
| Events in quadrant C | 1,451,730 | 174,453 |
| Events in quadrant D | 4,460,238 | 131,603 |
| Mode SS | |||
|---|---|---|---|
| Quadrant | BADHDUFLAG | Total packets | Discarded packets |
| A | 0 | 67 | 3 |
| B | 0 | 67 | 1 |
| C | 0 | 69 | 3 |
| D | 0 | 66 | 2 |
| Mode M9 | |||
|---|---|---|---|
| Quadrant | BADHDUFLAG | Total packets | Discarded packets |
| A | 0 | 12 | 0 |
| B | 0 | 12 | 0 |
| C | 0 | 13 | 1 |
| D | 0 | 12 | 0 |
| Mode M0 | |||
|---|---|---|---|
| Quadrant | BADHDUFLAG | Total packets | Discarded packets |
| A | 0 | 6833 | 149 |
| B | 0 | 6725 | 149 |
| C | 0 | 6567 | 166 |
| D | 0 | 15750 | 355 |
| Quadrant | Total seconds | Saturated seconds | Saturation percentage |
|---|---|---|---|
| A | 3087 | 50 | 1.619695% |
| B | 3090 | 24 | 0.776699% |
| C | 3085 | 9 | 0.291734% |
| D | 3078 | 820 | 26.640676% |
Noise dominated data is calculated using 1-second bins in cleaned event files. If a bin has >2000 counts, and if more than 50% of those come from <1% of pixels, then it is considered to be noise-dominated and hence unusable.
| Quadrant | # 1 sec bins | Bins with >0 counts | Bins with >2000 counts | High rate bins dominated by noise | Noise dominated (total time) | Noise dominated (detector-on time) | Marked lightcurve |
|---|---|---|---|---|---|---|---|
| A | 4375 | 3105 | 17 | 17 | 0.39% | 0.55% | 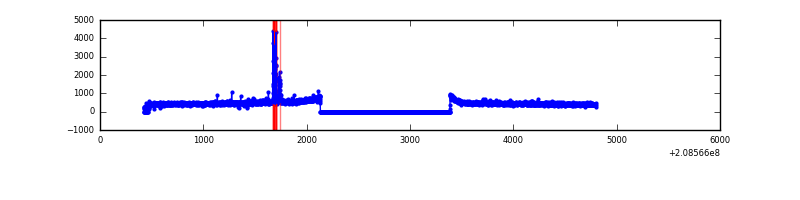 |
| B | 4381 | 3106 | 1 | 1 | 0.02% | 0.03% | 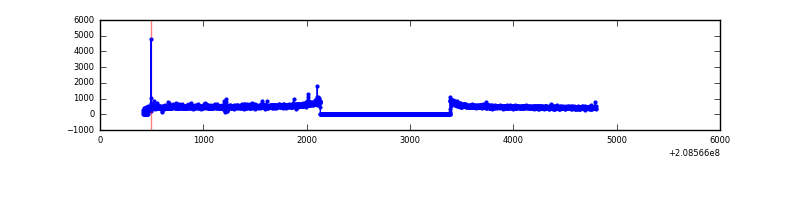 |
| C | 4374 | 3098 | 0 | 0 | 0.00% | 0.00% | 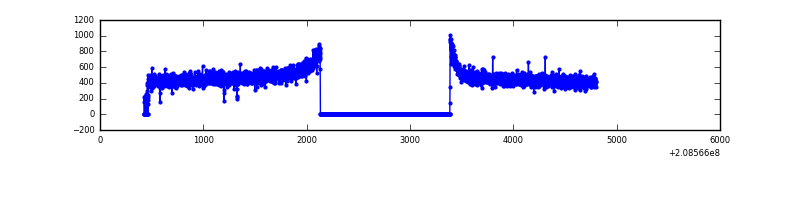 |
| D | 4379 | 3095 | 763 | 763 | 17.42% | 24.65% | 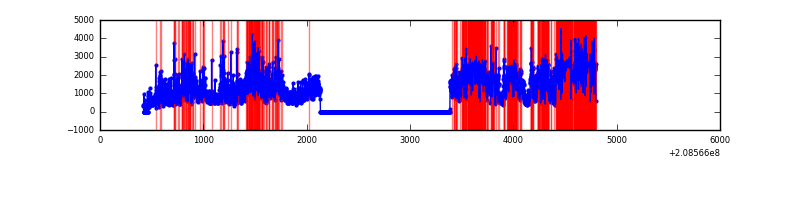 |
Top three noisy pixels from each quadrant. If the there are fewer than three noisy pixels in the level2.evt file, extra rows are filled as -1
| Pixel properties | Quadrant properties | ||||||
|---|---|---|---|---|---|---|---|
| Quadrant | DetID | PixID | Counts | Sigma | Mean | Median | Sigma |
| A | 0 | 118 | 72878 | 933.66 | 373 | 365 | 77.7 |
| A | 8 | 15 | 21995 | 278.5 | 373 | 365 | 77.7 |
| A | 0 | 226 | 10380 | 128.95 | 373 | 365 | 77.7 |
| B | 14 | 167 | 24015 | 315.0 | 383 | 372 | 75.1 |
| B | 15 | 54 | 12281 | 158.66 | 383 | 372 | 75.1 |
| B | 4 | 80 | 9253 | 118.32 | 383 | 372 | 75.1 |
| C | 13 | 61 | 3012 | 30.09 | 371 | 372 | 87.8 |
| C | 14 | 67 | 1149 | 8.85 | 371 | 372 | 87.8 |
| C | 3 | 202 | 906 | 6.09 | 371 | 372 | 87.8 |
| D | 2 | 63 | 2355006 | 28726.94 | 332 | 322 | 82.0 |
| D | 1 | 31 | 619620 | 7555.38 | 332 | 322 | 82.0 |
| D | 2 | 234 | 60141 | 729.79 | 332 | 322 | 82.0 |
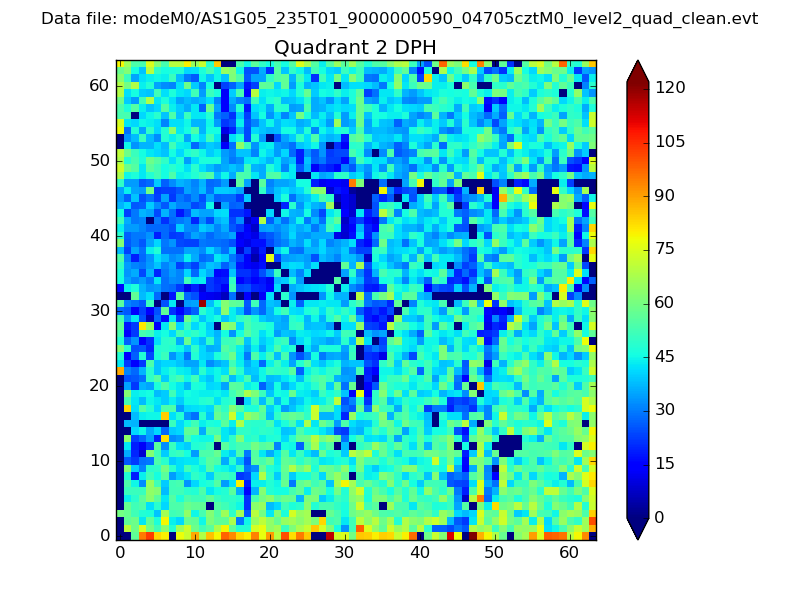
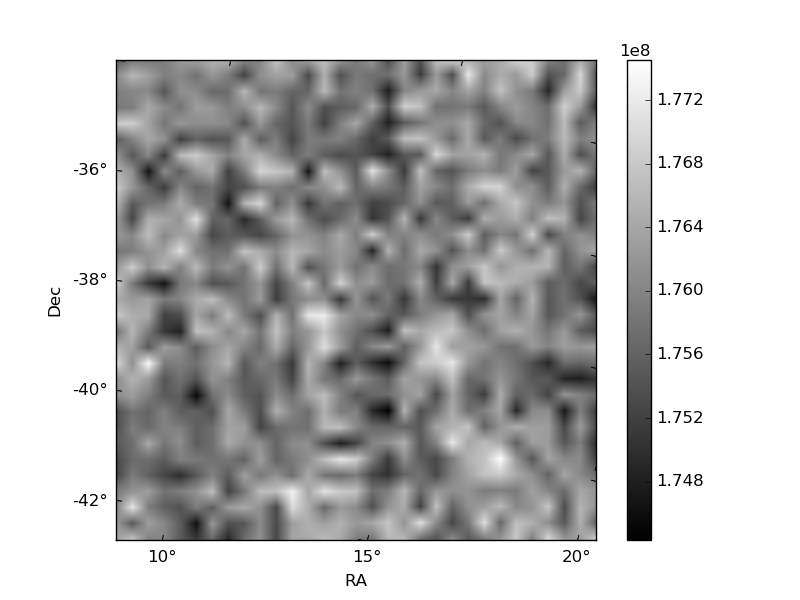
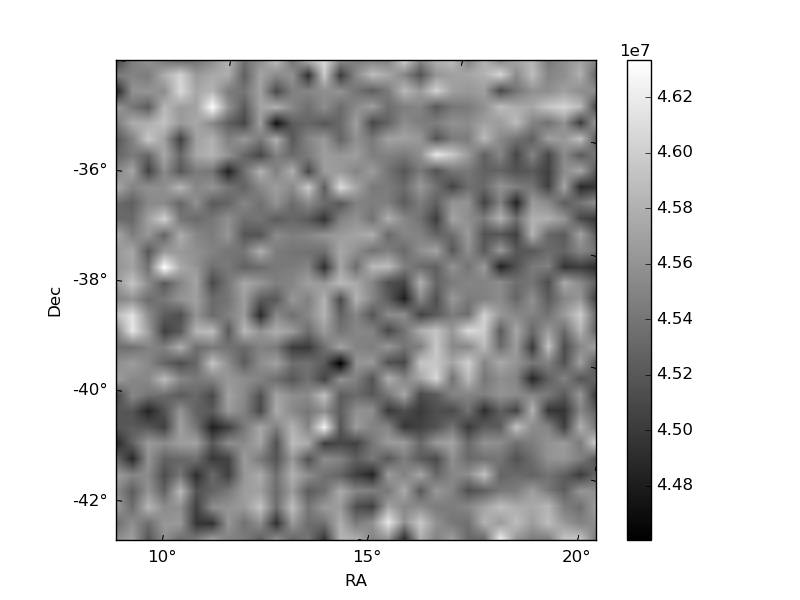
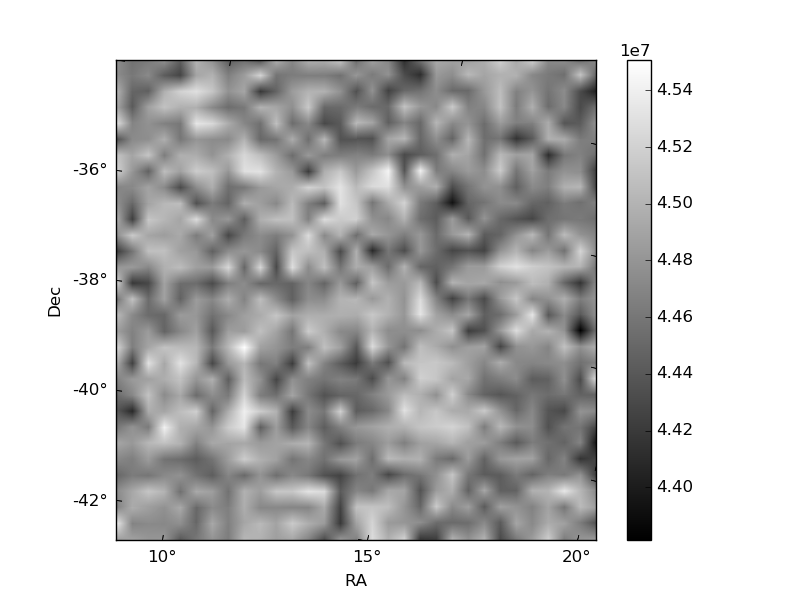
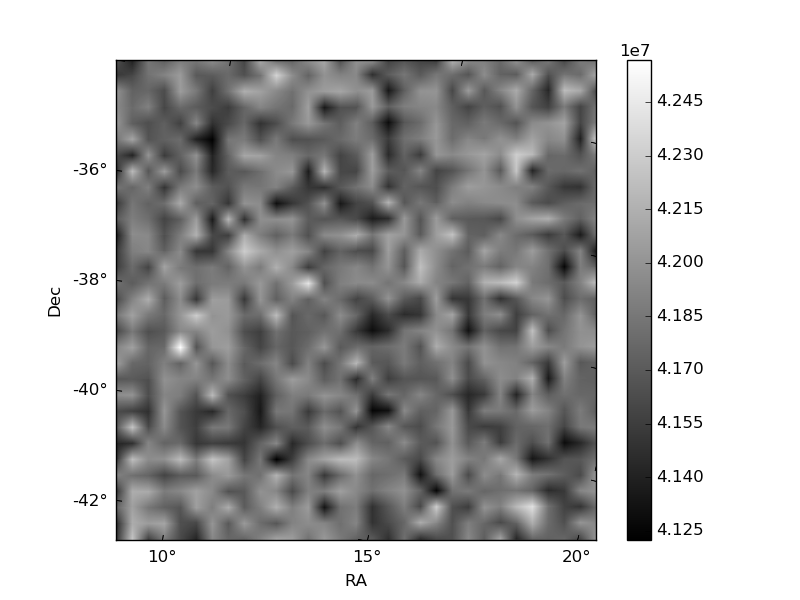
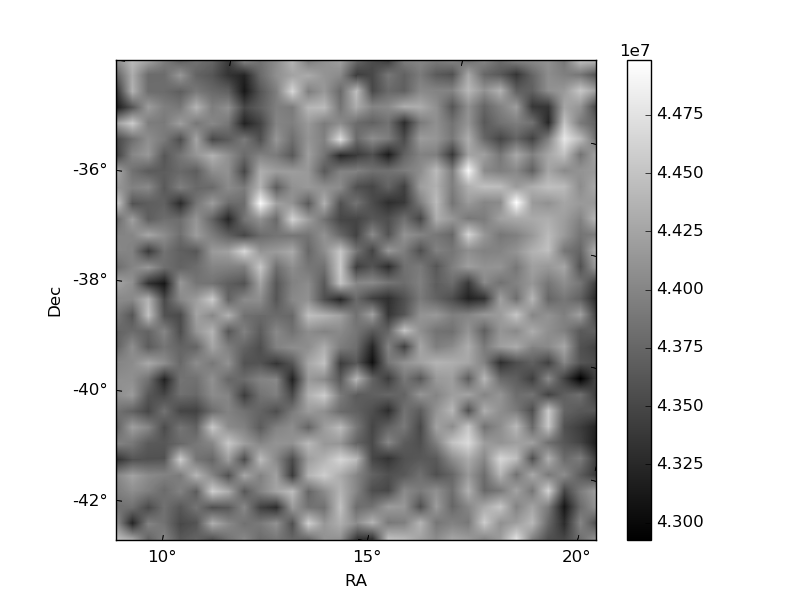
Histogram calculated using DETX and DETY for each event in the final _common_clean file
| Quadrant A | 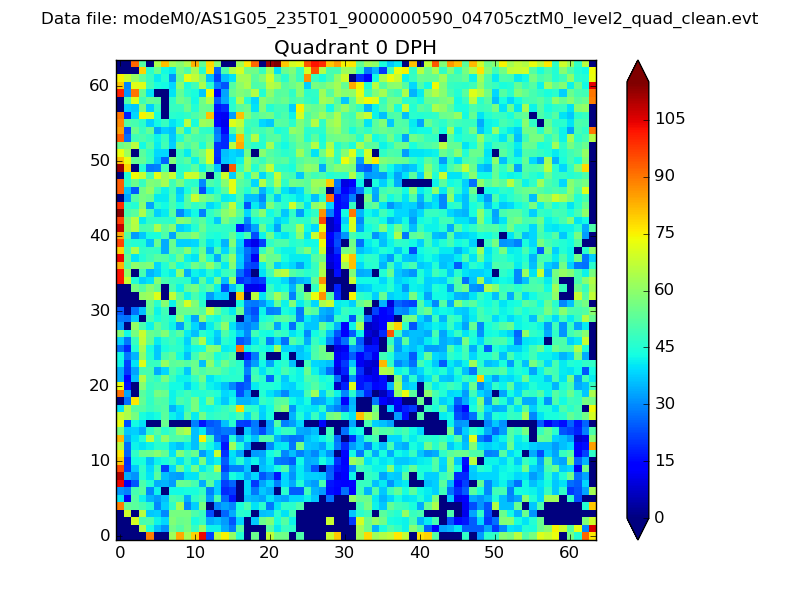 |
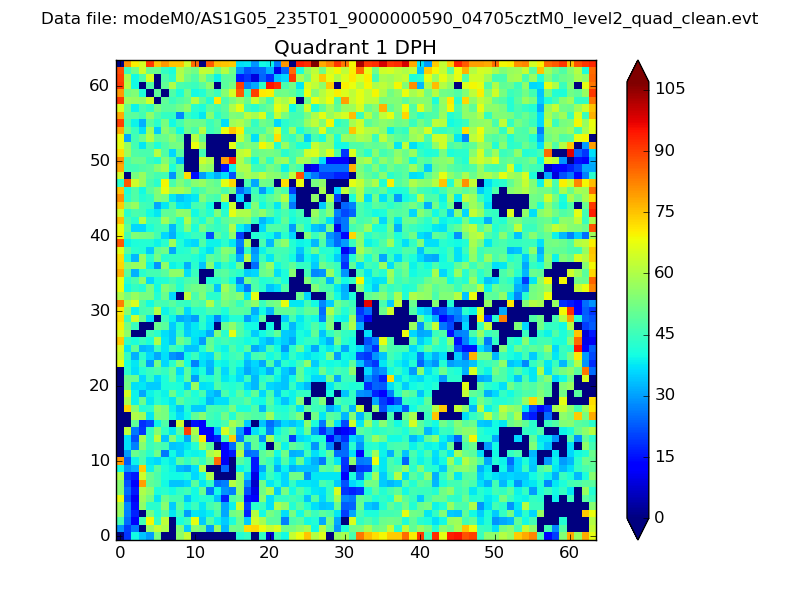 |
Quadrant B |
|---|---|---|---|
| Quadrant D | 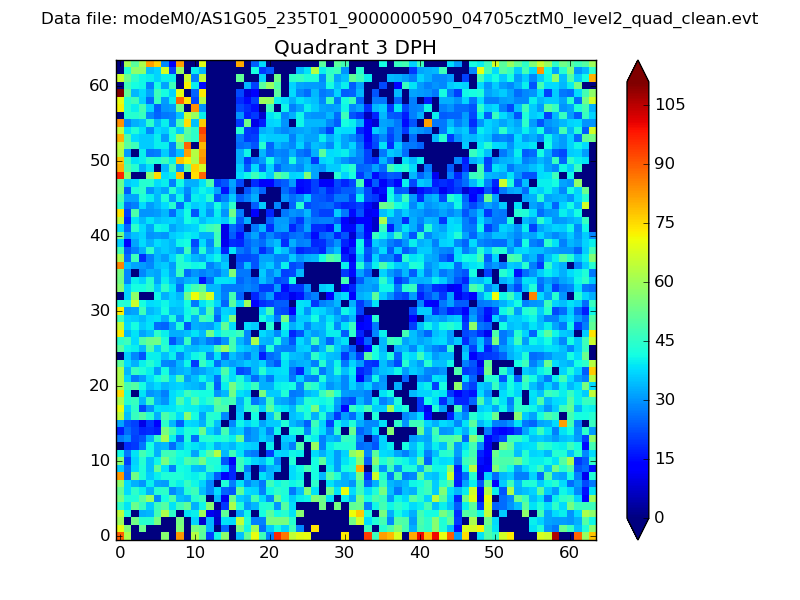 |
 |
Quadrant C |
| Plot type | Count rate plots | Images |
|---|---|---|
| Comparison with Poisson distribution Blue bars denote a histogram of data divided into 1 sec bins. Red curve is a Poisson curve with rate = median count rate of data. |
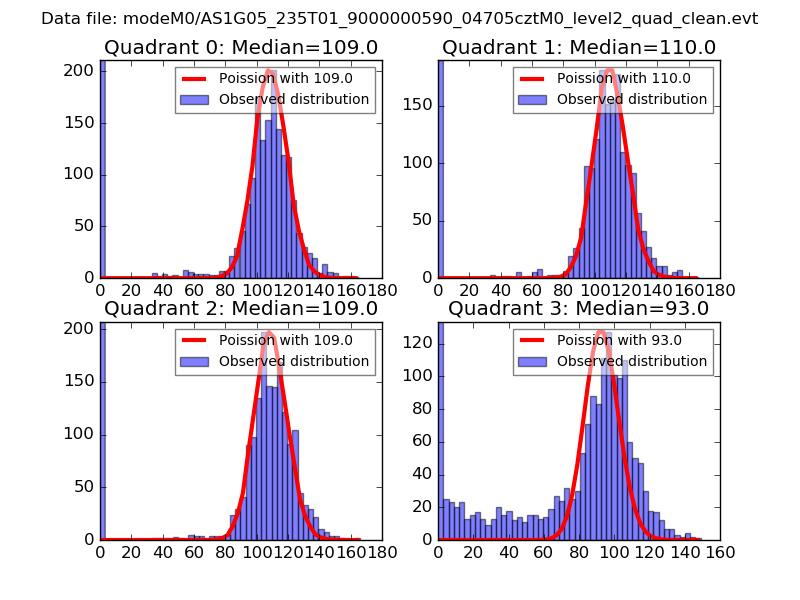 |
 |
| Quadrant-wise count rates Data is divided into 100 sec bins |
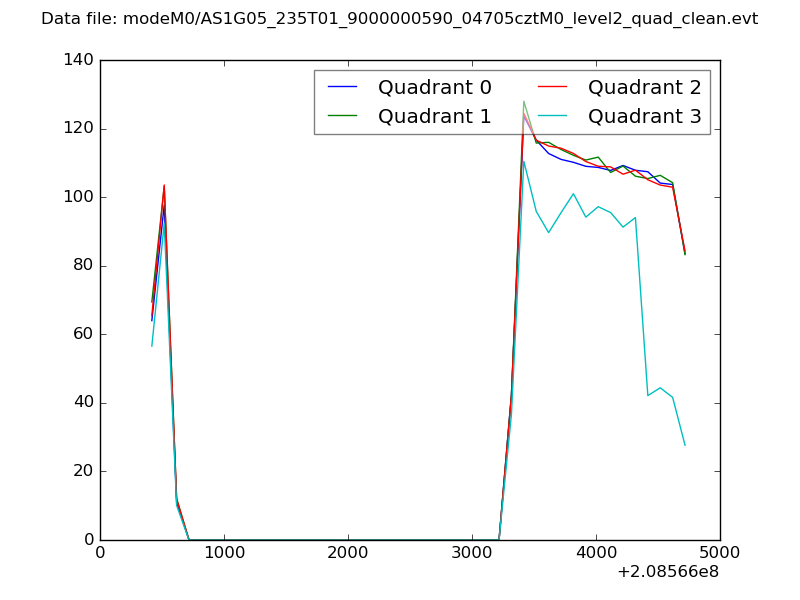 |
|
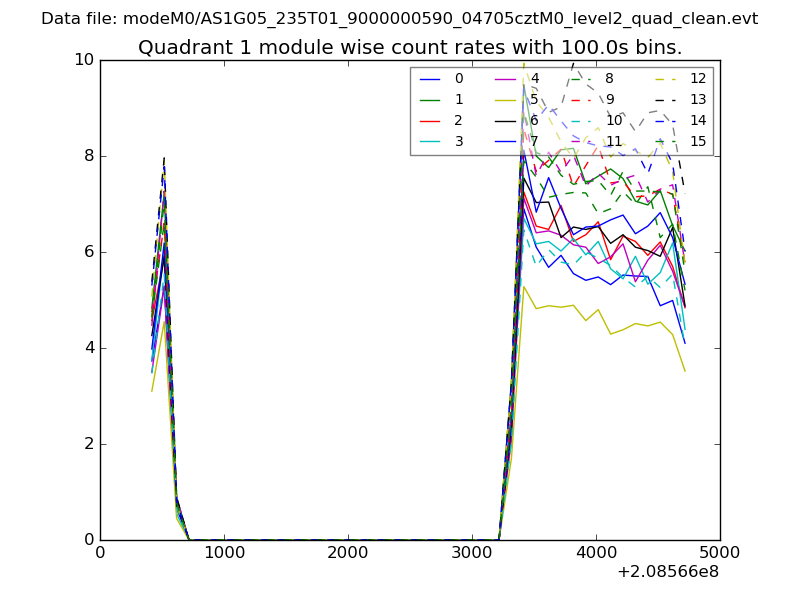
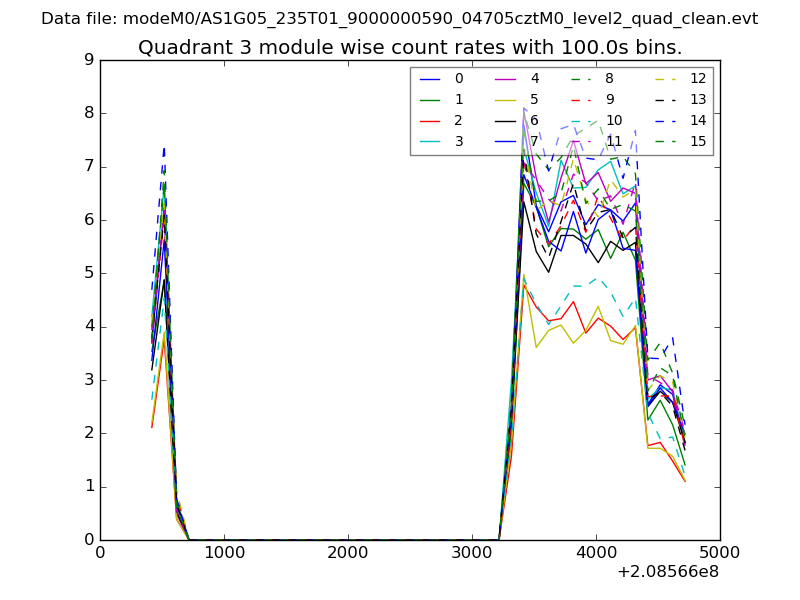
| Module-wise count rates for Quadrant A Data is divided into 100 sec bins |
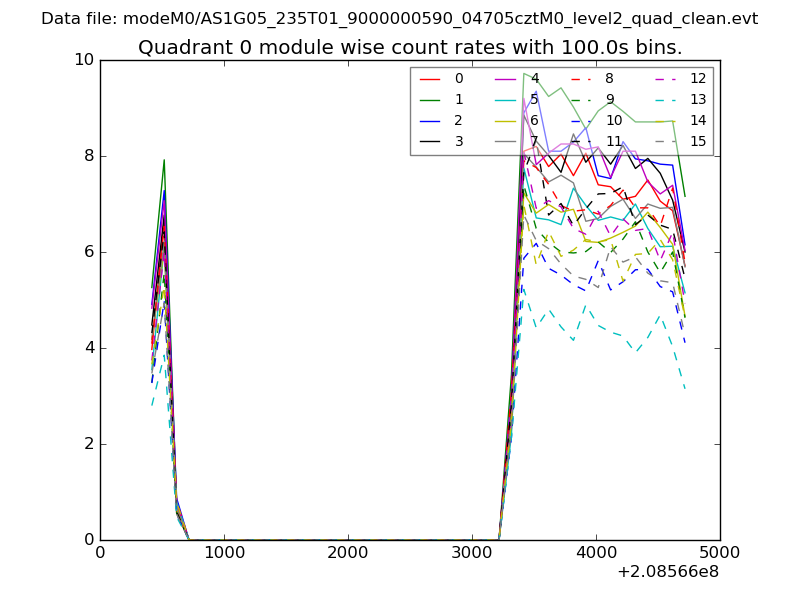 |
 |
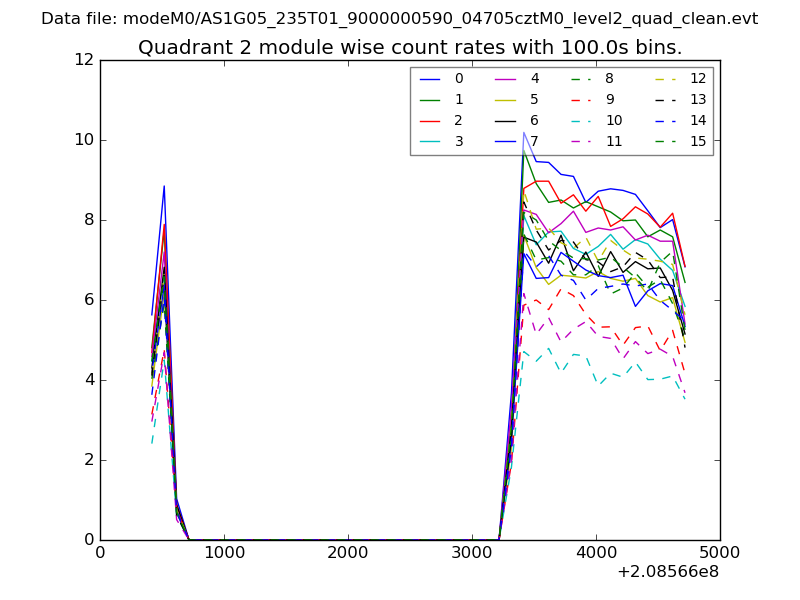
| Module-wise count rates for Quadrant B Data is divided into 100 sec bins |
 |
 |
| Module-wise count rates for Quadrant C Data is divided into 100 sec bins |
 |
 |
| Module-wise count rates for Quadrant D Data is divided into 100 sec bins |
 |
 |
| Parameter | Plot |
|---|---|
| CZT HV Monitor | 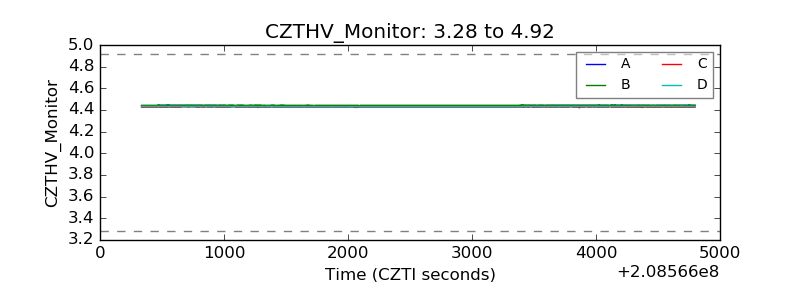 |
| D_VDD | 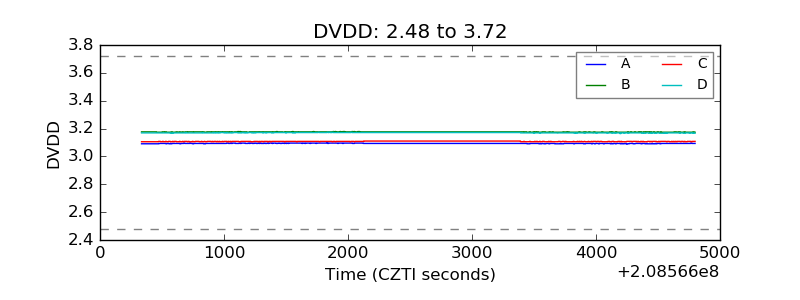 |
| Temperature 1 | 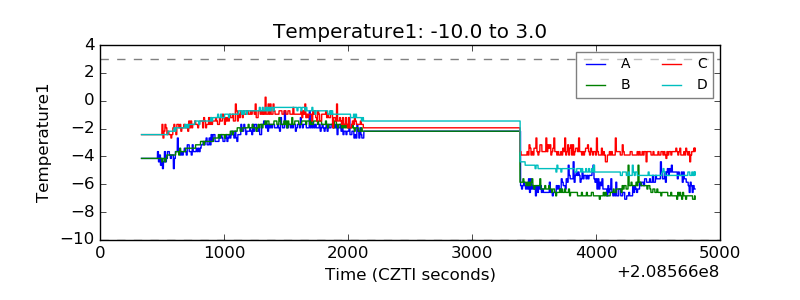 |
| Veto HV Monitor | 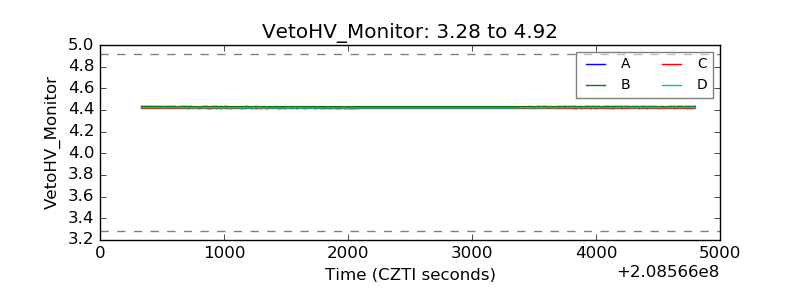 |
| Veto LLD | 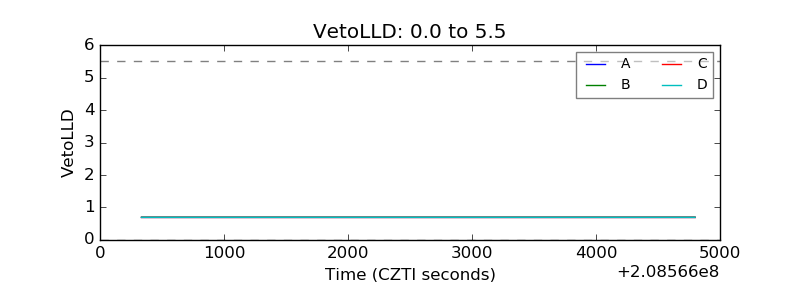 |
| Alpha Counter | 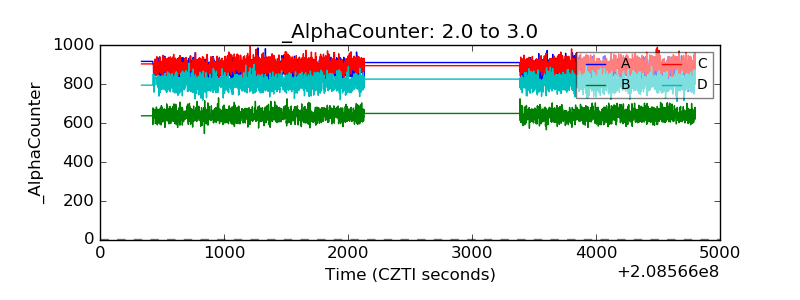 |
| _CPM_Rate | 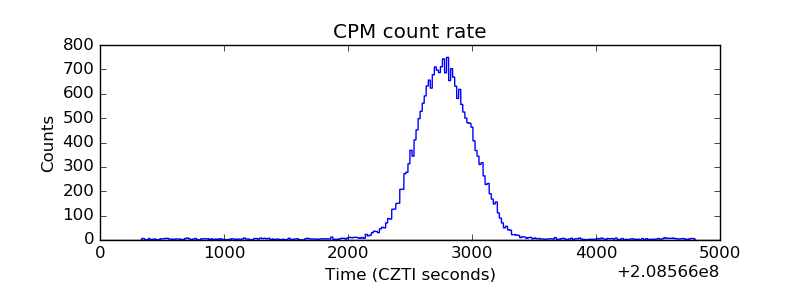 |
| CZT Counter | 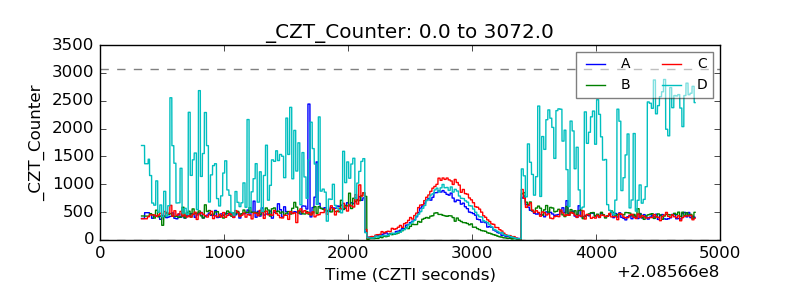 |
| +2.5 Volts monitor |  |
| +5 Volts monitor |  |
| _ROLL_ROT | 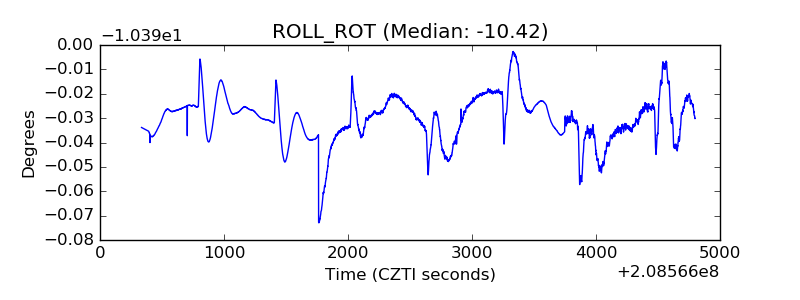 |
| _Roll_DEC | 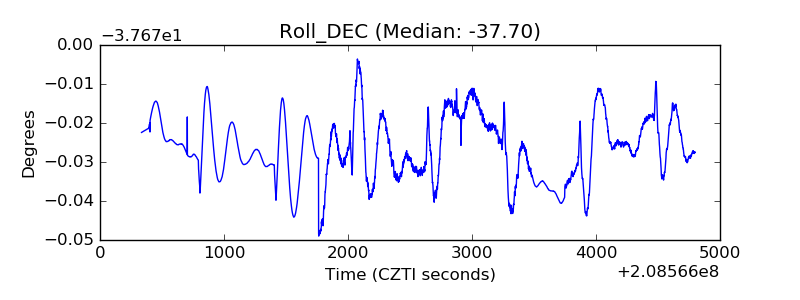 |
| _Roll_RA | 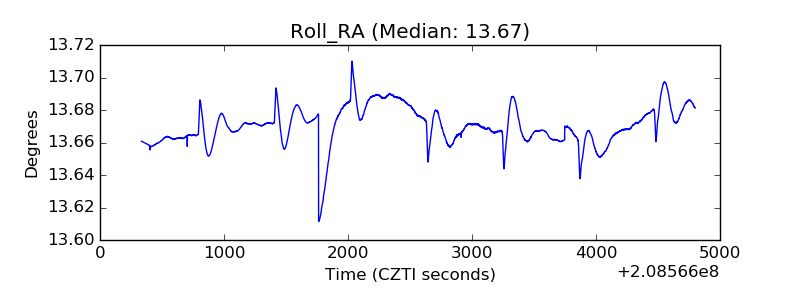 |
| Veto Counter | 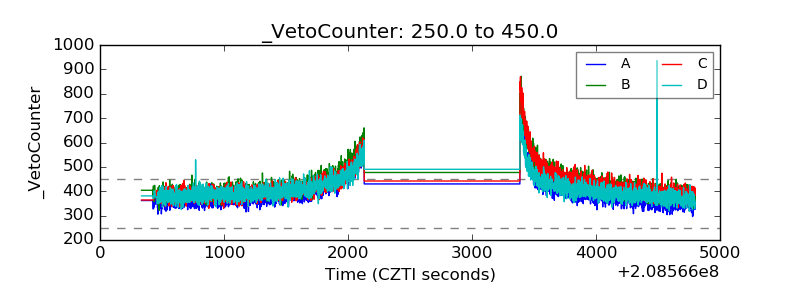 |