| Param | Original file | Final file |
|---|---|---|
| Filename | modeM0/AS1G05_235T01_9000000590_04706cztM0_level2.evt | modeM0/AS1G05_235T01_9000000590_04706cztM0_level2_quad_clean.evt |
| Size (bytes) | 1,524,265,920 | 204,514,560 |
| Size | 1.4 GB | 195.0 MB |
| Events in quadrant A | 7,623,947 | 1,317,984 |
| Events in quadrant B | 8,062,081 | 1,332,497 |
| Events in quadrant C | 8,141,777 | 1,306,902 |
| Events in quadrant D | 21,214,586 | 1,089,595 |
| Mode SS | |||
|---|---|---|---|
| Quadrant | BADHDUFLAG | Total packets | Discarded packets |
| A | 0 | 346 | 8 |
| B | 0 | 346 | 6 |
| C | 0 | 346 | 2 |
| D | 0 | 346 | 4 |
| Mode M9 | |||
|---|---|---|---|
| Quadrant | BADHDUFLAG | Total packets | Discarded packets |
| A | 0 | 35 | 0 |
| B | 0 | 35 | 0 |
| C | 0 | 35 | 0 |
| D | 0 | 36 | 0 |
| Mode M0 | |||
|---|---|---|---|
| Quadrant | BADHDUFLAG | Total packets | Discarded packets |
| A | 0 | 35192 | 577 |
| B | 0 | 35919 | 619 |
| C | 0 | 36604 | 578 |
| D | 0 | 76158 | 1562 |
| Quadrant | Total seconds | Saturated seconds | Saturation percentage |
|---|---|---|---|
| A | 16631 | 113 | 0.679454% |
| B | 16624 | 95 | 0.571463% |
| C | 16626 | 157 | 0.944304% |
| D | 16528 | 3324 | 20.111326% |
Noise dominated data is calculated using 1-second bins in cleaned event files. If a bin has >2000 counts, and if more than 50% of those come from <1% of pixels, then it is considered to be noise-dominated and hence unusable.
| Quadrant | # 1 sec bins | Bins with >0 counts | Bins with >2000 counts | High rate bins dominated by noise | Noise dominated (total time) | Noise dominated (detector-on time) | Marked lightcurve |
|---|---|---|---|---|---|---|---|
| A | 20496 | 16756 | 32 | 32 | 0.16% | 0.19% | 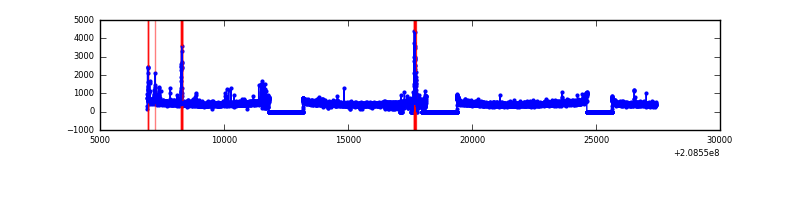 |
| B | 20496 | 16754 | 16 | 16 | 0.08% | 0.10% | 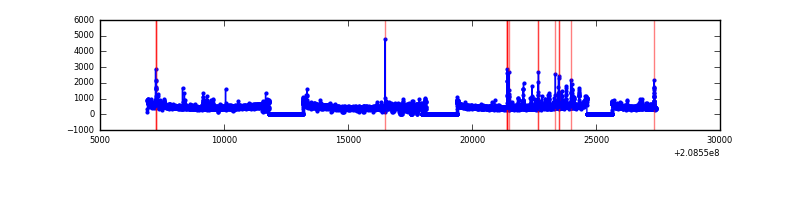 |
| C | 20496 | 16749 | 113 | 113 | 0.55% | 0.67% | 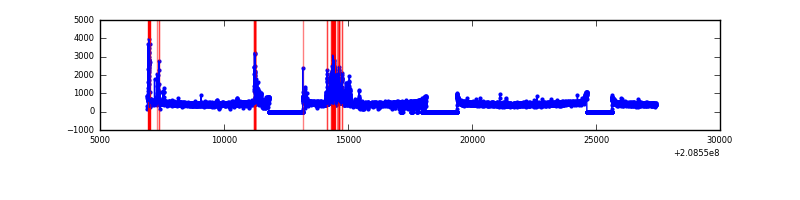 |
| D | 20496 | 16693 | 3045 | 3045 | 14.86% | 18.24% | 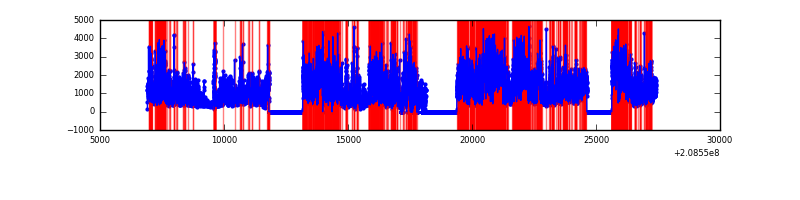 |
Top three noisy pixels from each quadrant. If the there are fewer than three noisy pixels in the level2.evt file, extra rows are filled as -1
| Pixel properties | Quadrant properties | ||||||
|---|---|---|---|---|---|---|---|
| Quadrant | DetID | PixID | Counts | Sigma | Mean | Median | Sigma |
| A | 0 | 118 | 116826 | 299.38 | 1910 | 1871 | 384.0 |
| A | 15 | 174 | 66428 | 168.13 | 1910 | 1871 | 384.0 |
| A | 8 | 15 | 35621 | 87.9 | 1910 | 1871 | 384.0 |
| B | 10 | 16 | 183888 | 494.6 | 1950 | 1900 | 368.0 |
| B | 14 | 167 | 136204 | 365.0 | 1950 | 1900 | 368.0 |
| B | 15 | 204 | 102512 | 273.44 | 1950 | 1900 | 368.0 |
| C | 9 | 68 | 635827 | 1451.19 | 1891 | 1899 | 436.8 |
| C | 9 | 247 | 102909 | 231.23 | 1891 | 1899 | 436.8 |
| C | 13 | 61 | 15540 | 31.23 | 1891 | 1899 | 436.8 |
| D | 2 | 63 | 10341842 | 25254.36 | 1709 | 1664 | 409.4 |
| D | 1 | 31 | 2369944 | 5784.17 | 1709 | 1664 | 409.4 |
| D | 13 | 235 | 1344816 | 3280.45 | 1709 | 1664 | 409.4 |
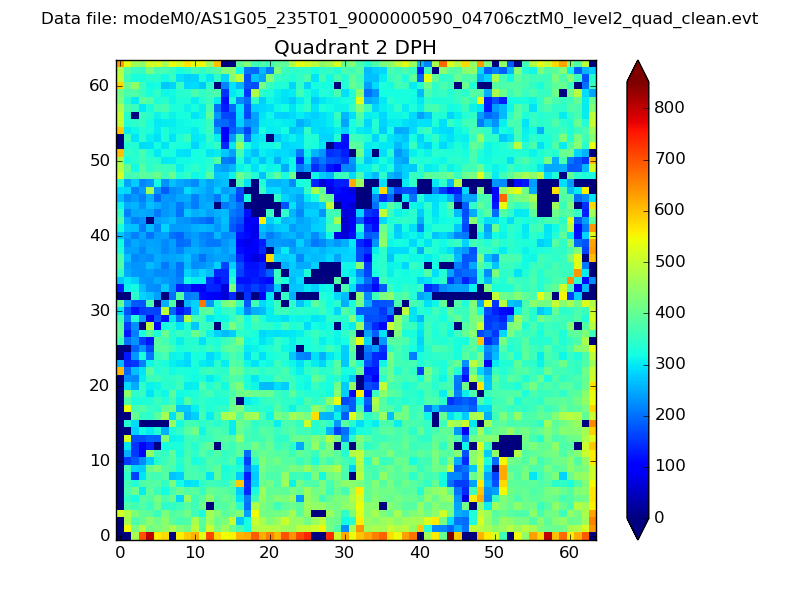
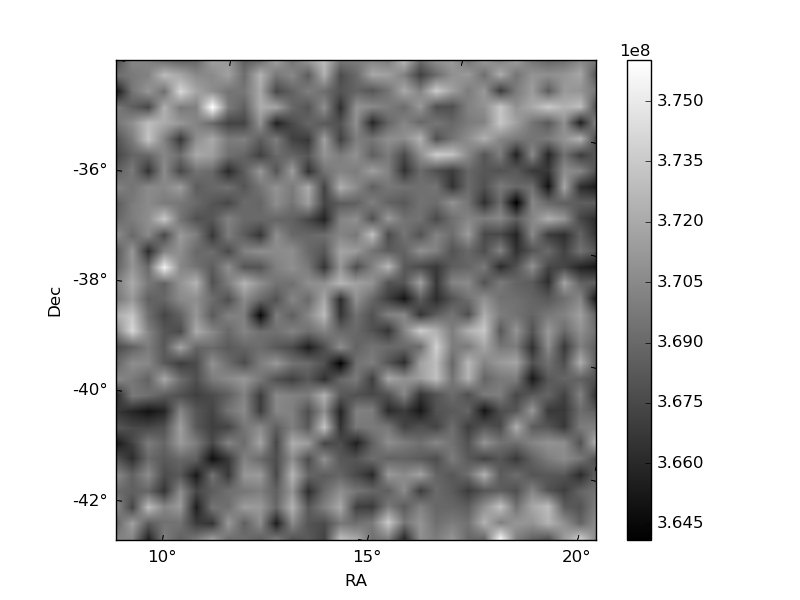
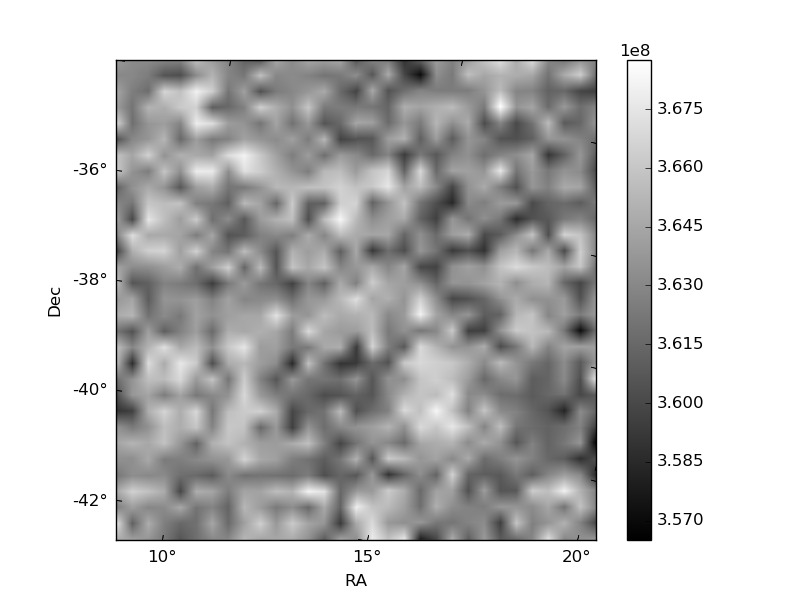
Histogram calculated using DETX and DETY for each event in the final _common_clean file
| Quadrant A | 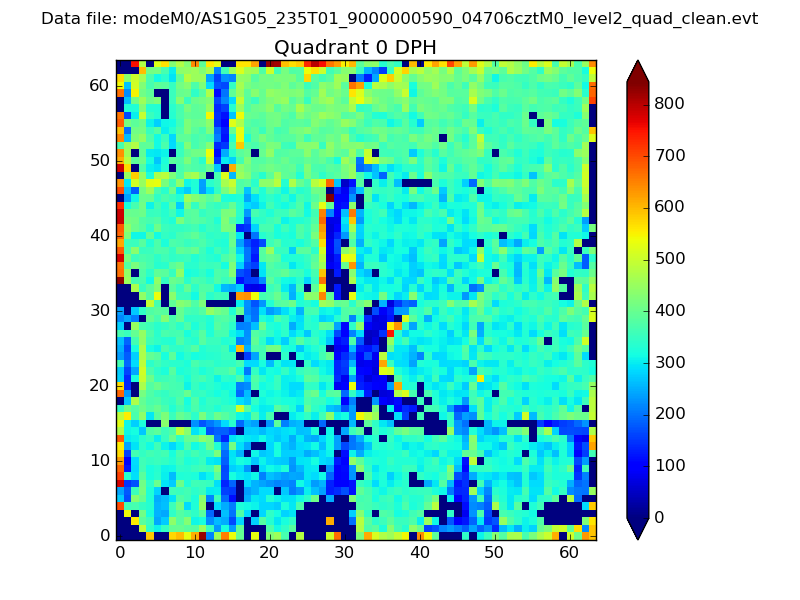 |
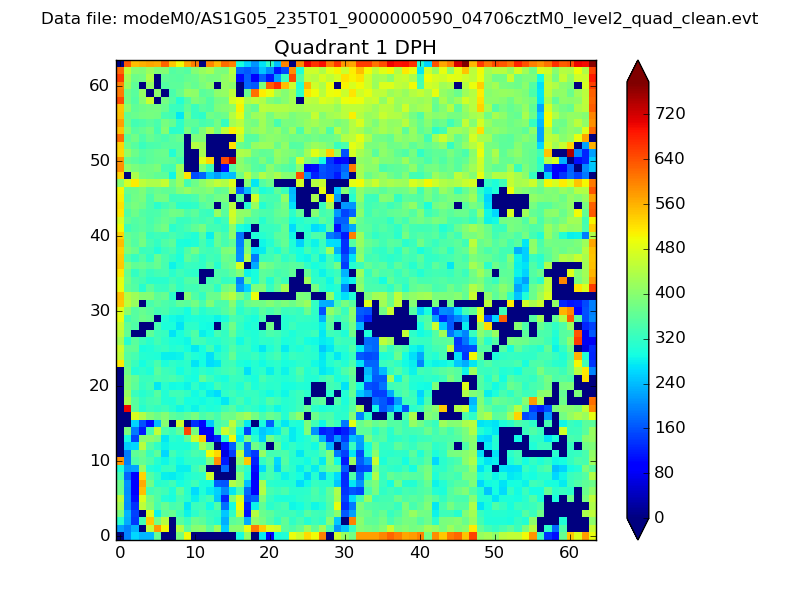 |
Quadrant B |
|---|---|---|---|
| Quadrant D | 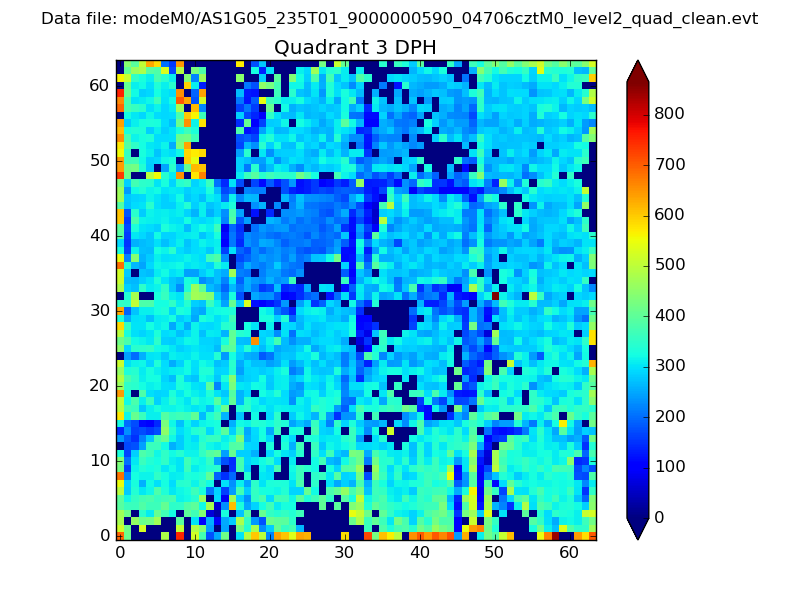 |
 |
Quadrant C |
| Plot type | Count rate plots | Images |
|---|---|---|
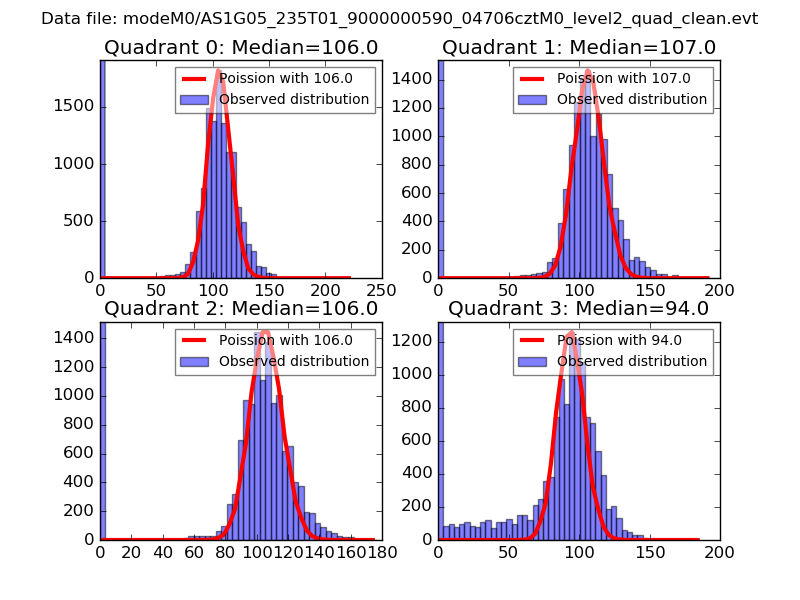
| Comparison with Poisson distribution Blue bars denote a histogram of data divided into 1 sec bins. Red curve is a Poisson curve with rate = median count rate of data. |
 |
 |
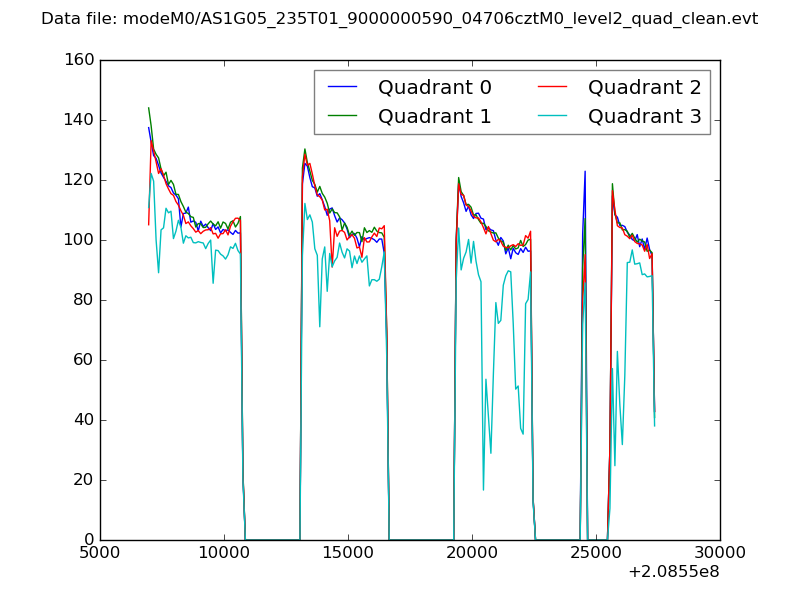
| Quadrant-wise count rates Data is divided into 100 sec bins |
 |
|
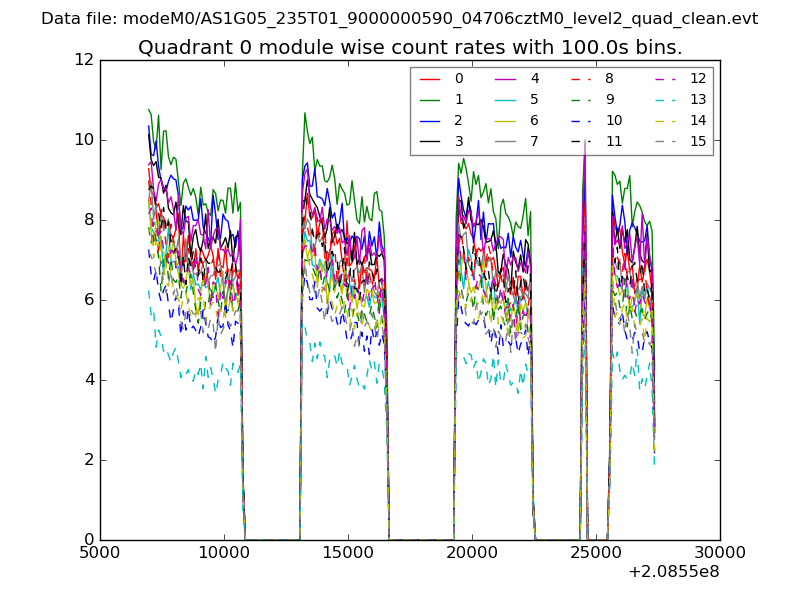
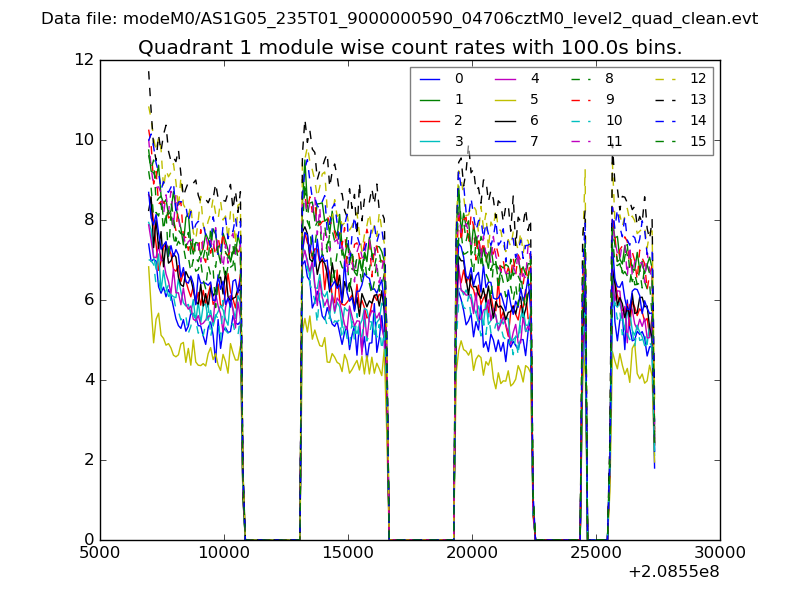
| Module-wise count rates for Quadrant A Data is divided into 100 sec bins |
 |
 |
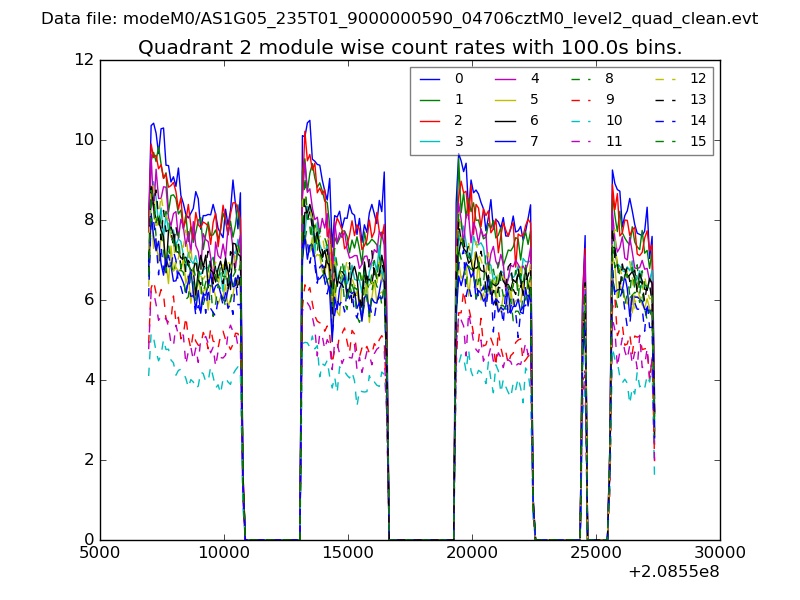
| Module-wise count rates for Quadrant B Data is divided into 100 sec bins |
 |
 |
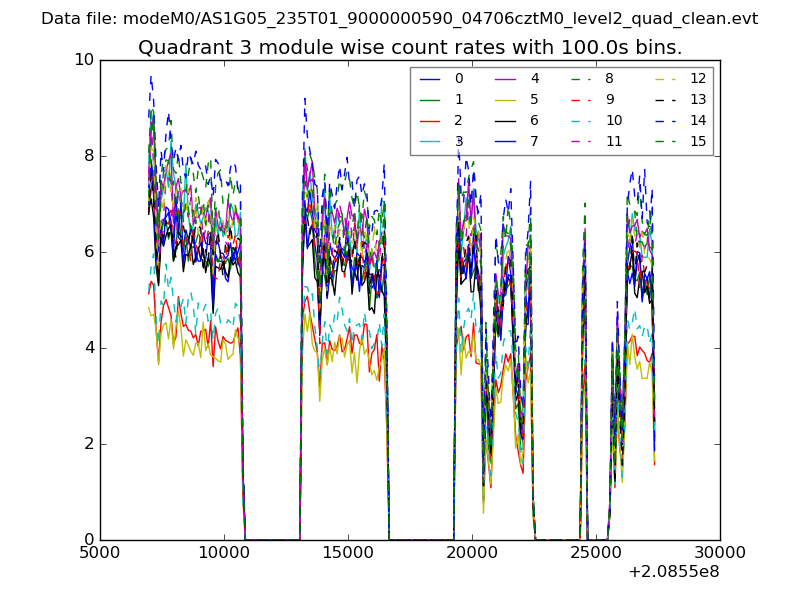
| Module-wise count rates for Quadrant C Data is divided into 100 sec bins |
 |
 |
| Module-wise count rates for Quadrant D Data is divided into 100 sec bins |
 |
 |
| Parameter | Plot |
|---|---|
| CZT HV Monitor | 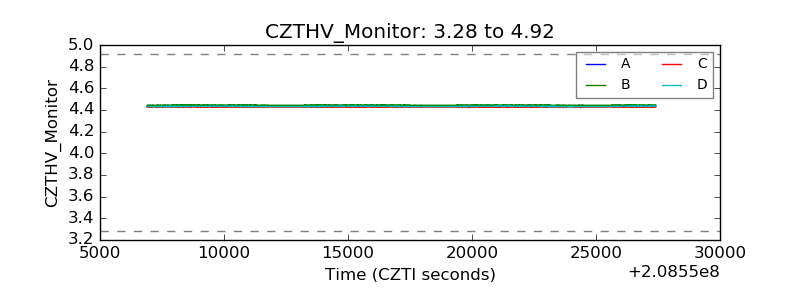 |
| D_VDD | 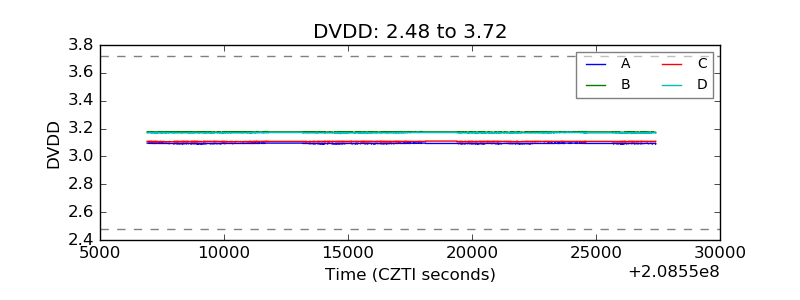 |
| Temperature 1 | 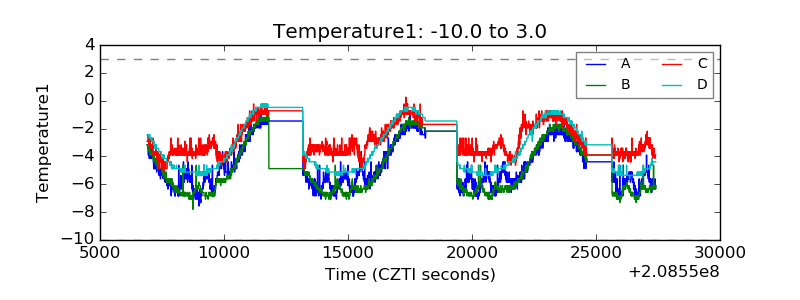 |
| Veto HV Monitor | 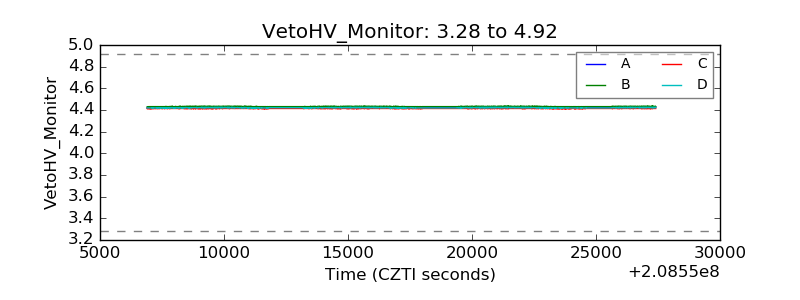 |
| Veto LLD | 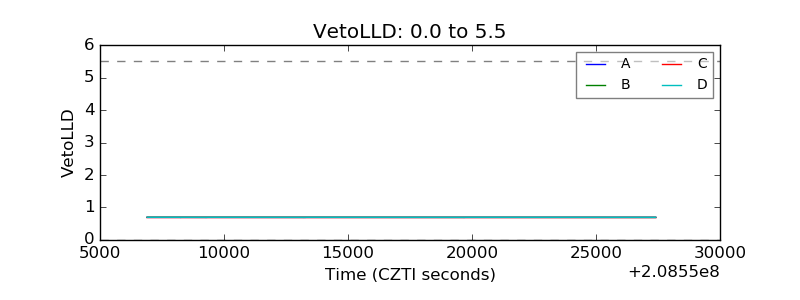 |
| Alpha Counter | 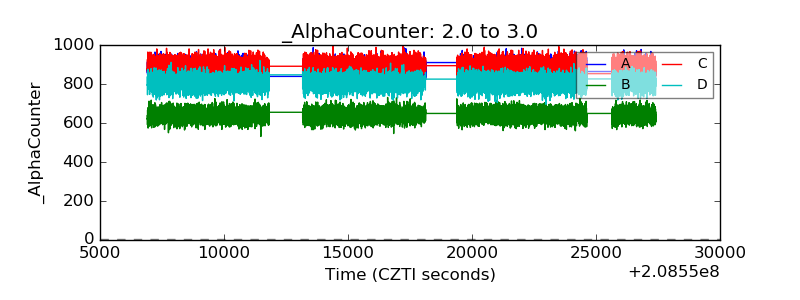 |
| _CPM_Rate | 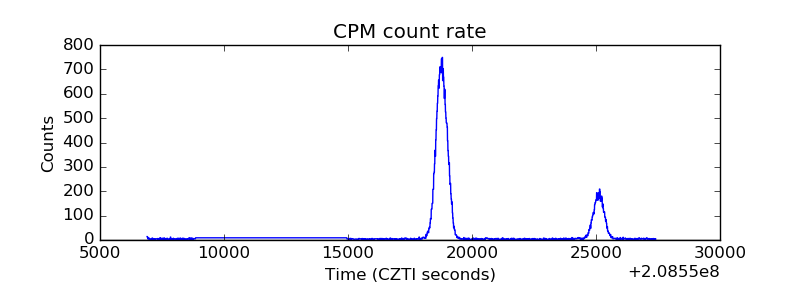 |
| CZT Counter | 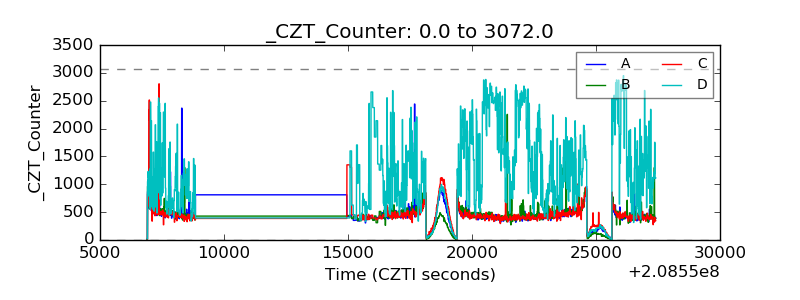 |
| +2.5 Volts monitor | 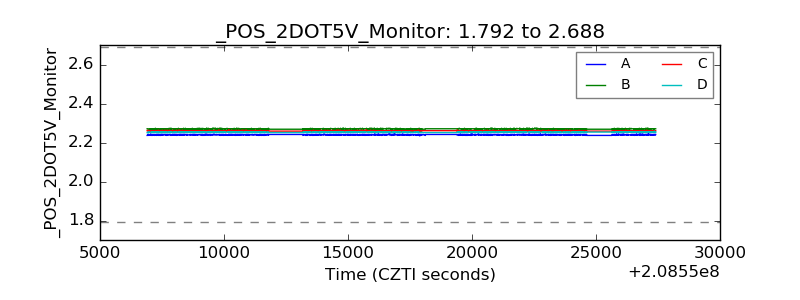 |
| +5 Volts monitor |  |
| _ROLL_ROT | 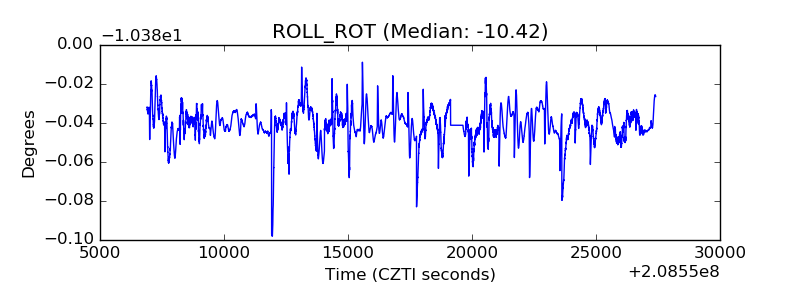 |
| _Roll_DEC | 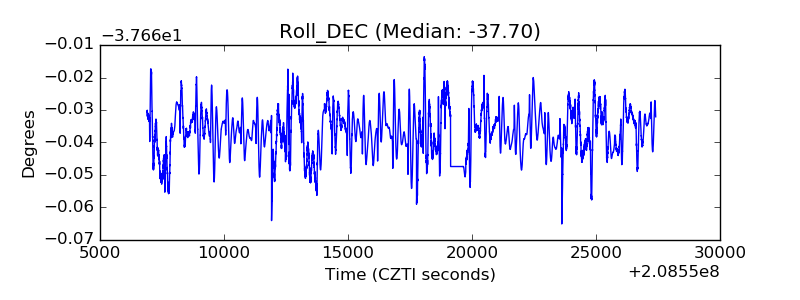 |
| _Roll_RA | 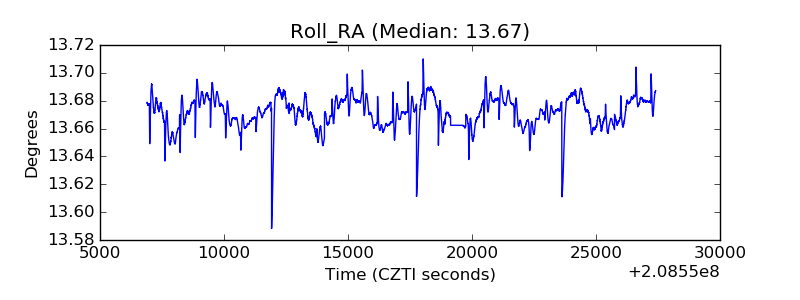 |
| Veto Counter | 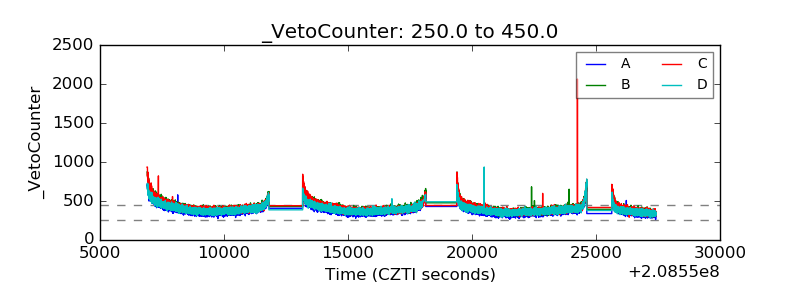 |