| Param | Original file | Final file |
|---|---|---|
| Filename | modeM0/AS1G05_235T01_9000000590_04713cztM0_level2.evt | modeM0/AS1G05_235T01_9000000590_04713cztM0_level2_quad_clean.evt |
| Size (bytes) | 3,243,985,920 | 403,770,240 |
| Size | 3.0 GB | 385.1 MB |
| Events in quadrant A | 17,950,928 | 2,441,042 |
| Events in quadrant B | 19,845,811 | 2,433,979 |
| Events in quadrant C | 17,898,315 | 2,424,741 |
| Events in quadrant D | 39,866,093 | 2,193,264 |
| Mode SS | |||
|---|---|---|---|
| Quadrant | BADHDUFLAG | Total packets | Discarded packets |
| A | 0 | 808 | 0 |
| B | 0 | 808 | 0 |
| C | 0 | 808 | 0 |
| D | 0 | 808 | 0 |
| Mode M9 | |||
|---|---|---|---|
| Quadrant | BADHDUFLAG | Total packets | Discarded packets |
| A | 0 | 32 | 0 |
| B | 0 | 32 | 0 |
| C | 0 | 32 | 0 |
| D | 0 | 32 | 0 |
| Mode M0 | |||
|---|---|---|---|
| Quadrant | BADHDUFLAG | Total packets | Discarded packets |
| A | 0 | 82313 | 8 |
| B | 0 | 85973 | 7 |
| C | 0 | 82771 | 7 |
| D | 0 | 145911 | 7 |
| Quadrant | Total seconds | Saturated seconds | Saturation percentage |
|---|---|---|---|
| A | 39807 | 917 | 2.303615% |
| B | 39807 | 992 | 2.492024% |
| C | 39807 | 858 | 2.155400% |
| D | 39807 | 6007 | 15.090311% |
Noise dominated data is calculated using 1-second bins in cleaned event files. If a bin has >2000 counts, and if more than 50% of those come from <1% of pixels, then it is considered to be noise-dominated and hence unusable.
| Quadrant | # 1 sec bins | Bins with >0 counts | Bins with >2000 counts | High rate bins dominated by noise | Noise dominated (total time) | Noise dominated (detector-on time) | Marked lightcurve |
|---|---|---|---|---|---|---|---|
| A | 42927 | 39813 | 0 | 0 | 0.00% | 0.00% | 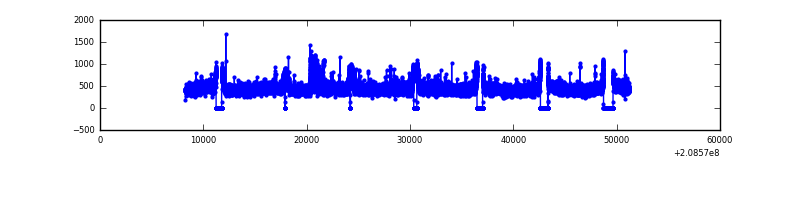 |
| B | 42927 | 39813 | 54 | 54 | 0.13% | 0.14% | 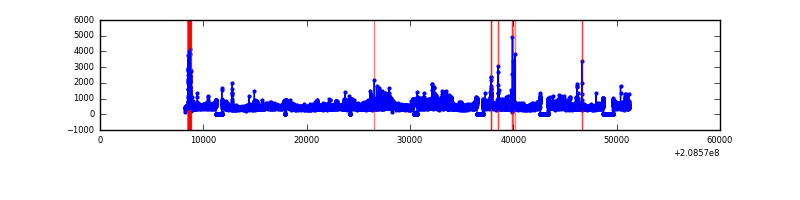 |
| C | 42927 | 39815 | 111 | 111 | 0.26% | 0.28% | 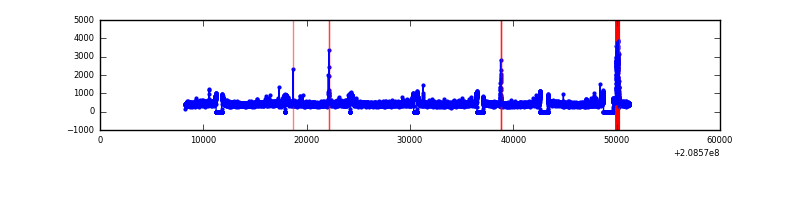 |
| D | 42927 | 39814 | 4960 | 4960 | 11.55% | 12.46% | 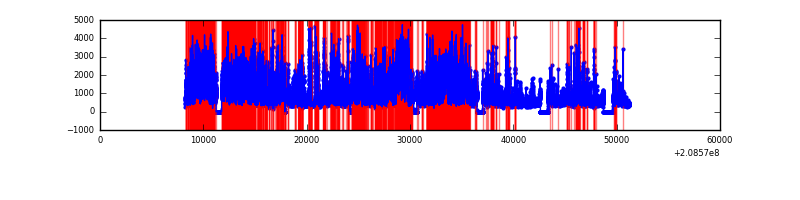 |
Top three noisy pixels from each quadrant. If the there are fewer than three noisy pixels in the level2.evt file, extra rows are filled as -1
| Pixel properties | Quadrant properties | ||||||
|---|---|---|---|---|---|---|---|
| Quadrant | DetID | PixID | Counts | Sigma | Mean | Median | Sigma |
| A | 8 | 15 | 220031 | 233.53 | 4551 | 4436 | 923.2 |
| A | 13 | 251 | 83248 | 85.37 | 4551 | 4436 | 923.2 |
| A | 13 | 14 | 70774 | 71.86 | 4551 | 4436 | 923.2 |
| B | 15 | 204 | 1129206 | 1264.98 | 4607 | 4490 | 889.1 |
| B | 4 | 80 | 328339 | 364.24 | 4607 | 4490 | 889.1 |
| B | 10 | 16 | 181202 | 198.75 | 4607 | 4490 | 889.1 |
| C | 9 | 247 | 482363 | 463.59 | 4451 | 4452 | 1030.9 |
| C | 13 | 61 | 36726 | 31.31 | 4451 | 4452 | 1030.9 |
| C | 8 | 128 | 22721 | 17.72 | 4451 | 4452 | 1030.9 |
| D | 2 | 63 | 16016946 | 15626.74 | 4252 | 4113 | 1024.7 |
| D | 13 | 235 | 4647861 | 4531.78 | 4252 | 4113 | 1024.7 |
| D | 2 | 136 | 974840 | 947.32 | 4252 | 4113 | 1024.7 |
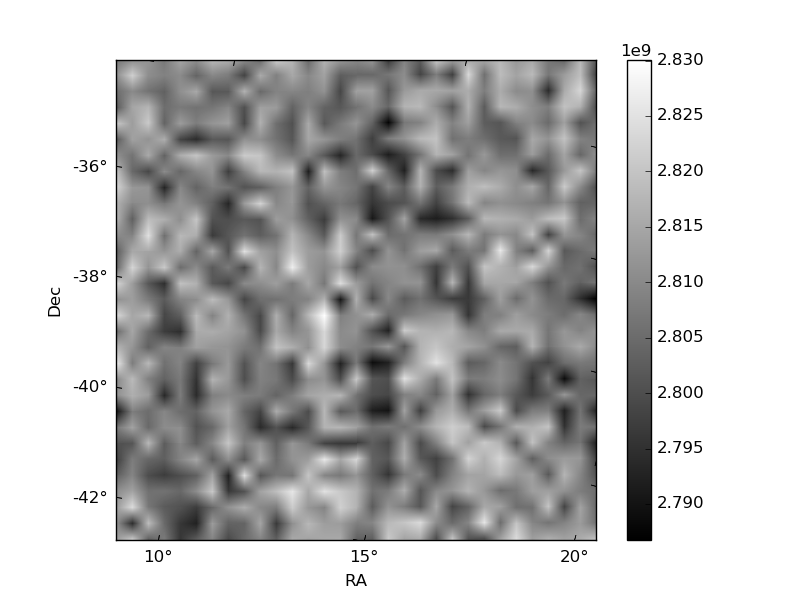
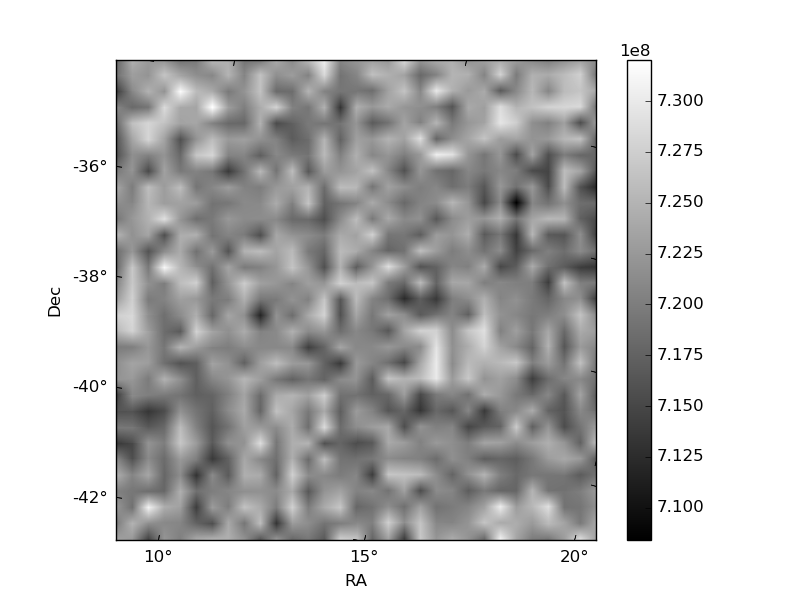
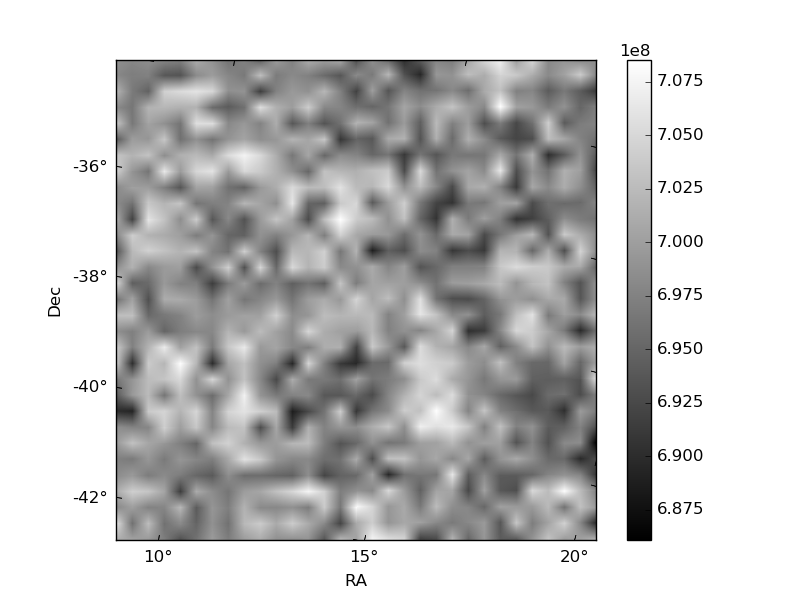
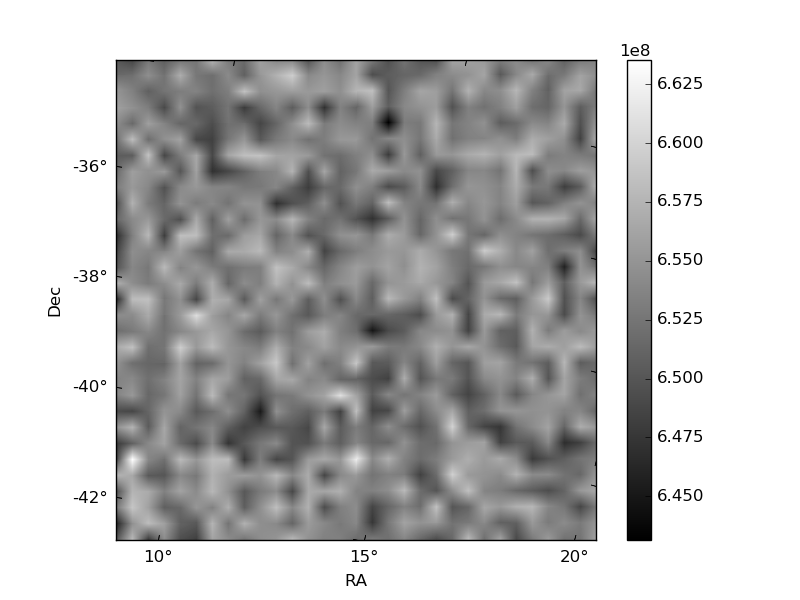
Histogram calculated using DETX and DETY for each event in the final _common_clean file
| Quadrant A | 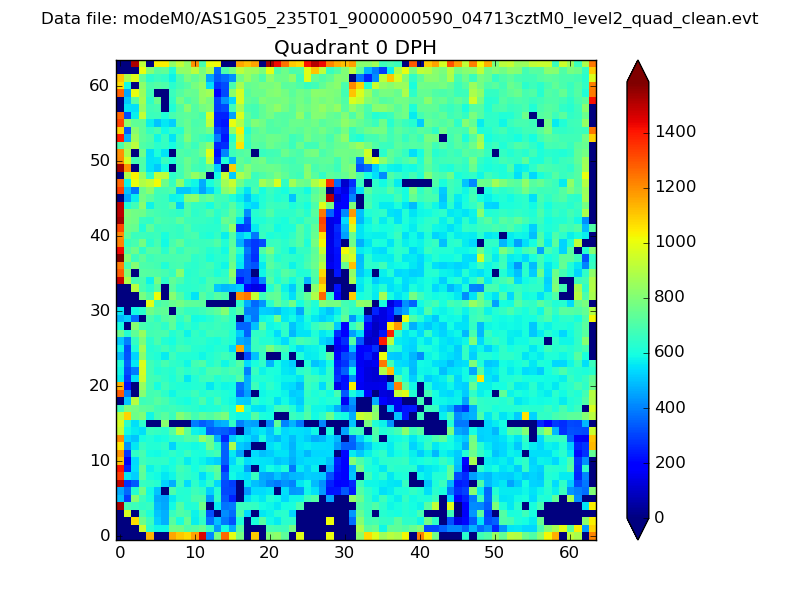 |
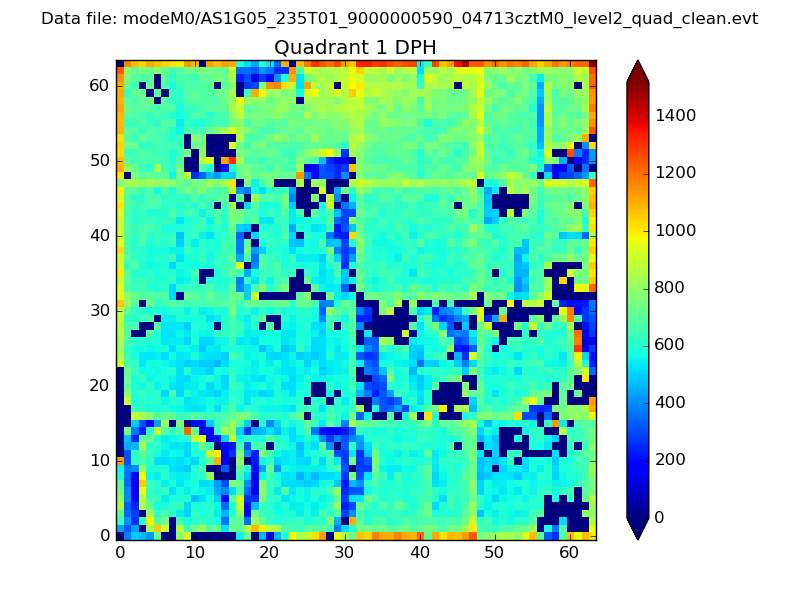 |
Quadrant B |
|---|---|---|---|
| Quadrant D | 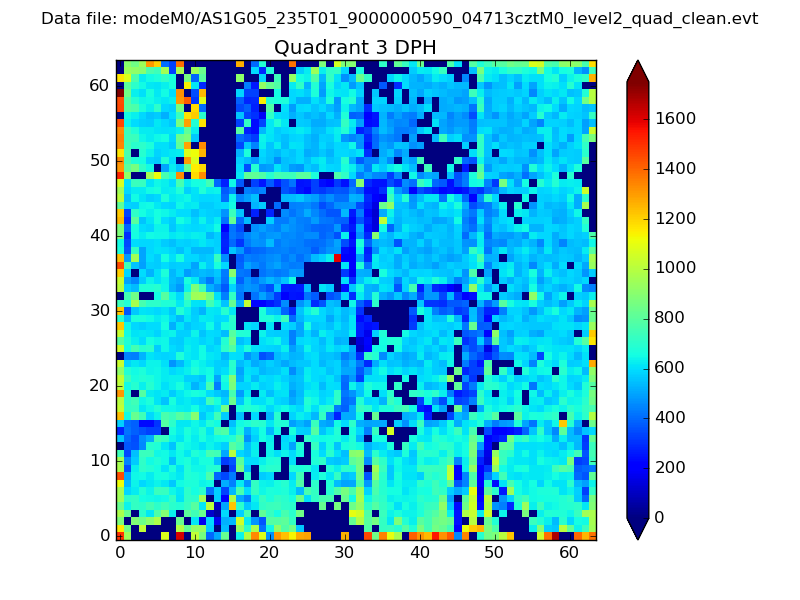 |
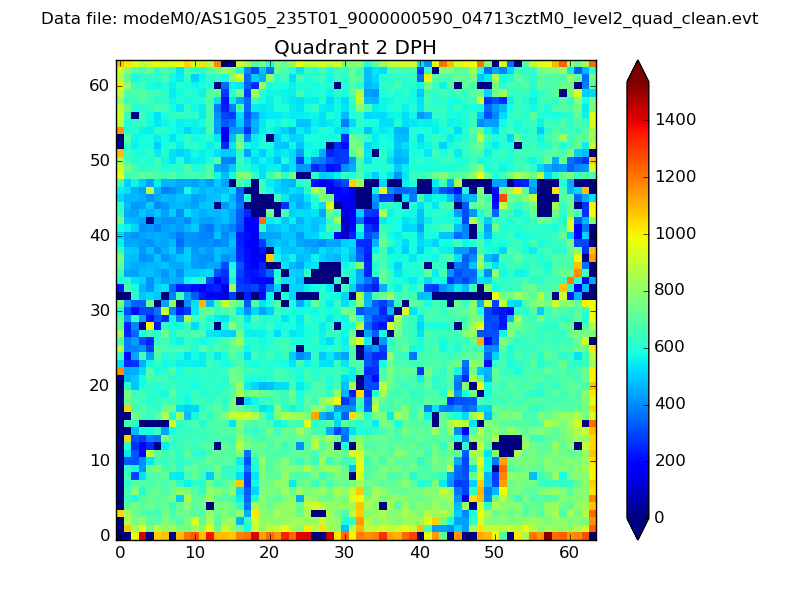 |
Quadrant C |
| Plot type | Count rate plots | Images |
|---|---|---|
| Comparison with Poisson distribution Blue bars denote a histogram of data divided into 1 sec bins. Red curve is a Poisson curve with rate = median count rate of data. |
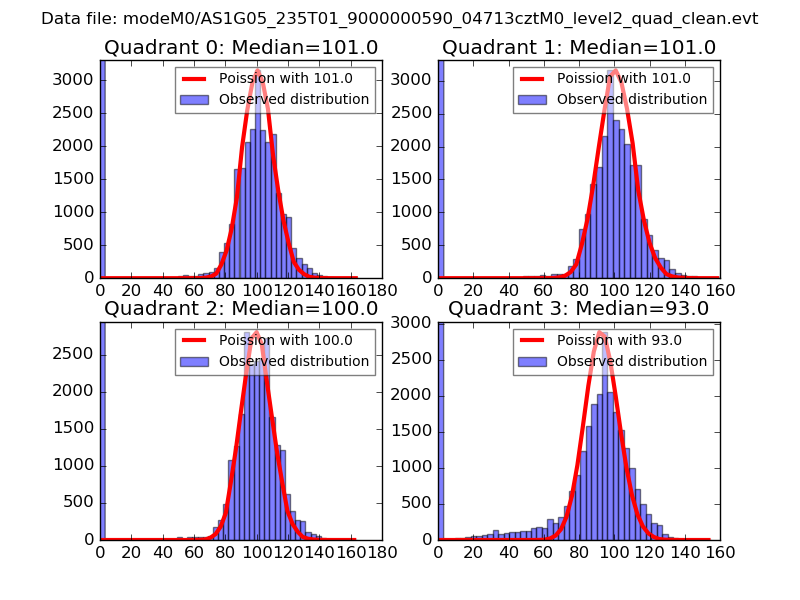 |
 |
| Quadrant-wise count rates Data is divided into 100 sec bins |
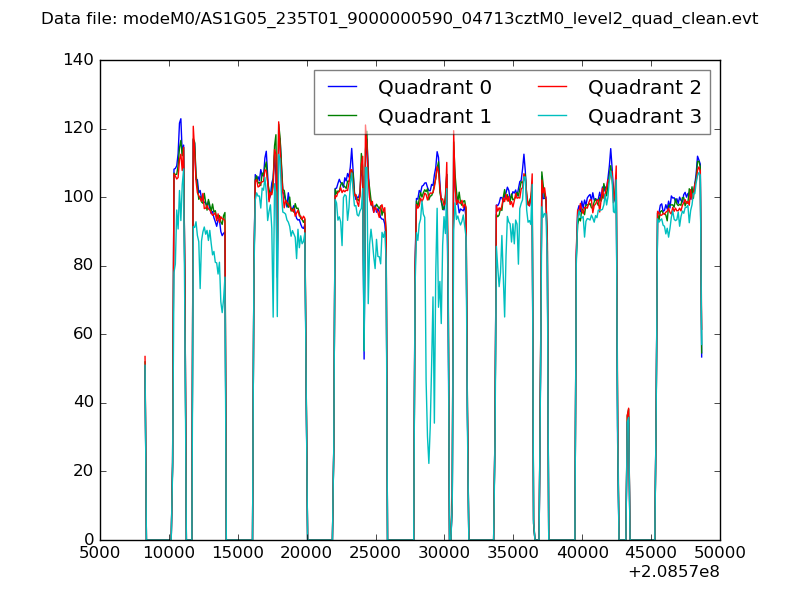 |
|
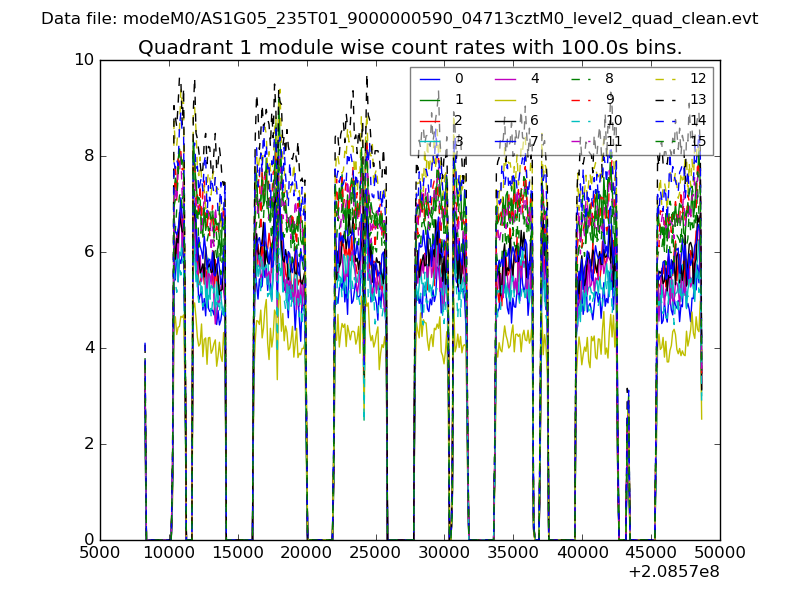
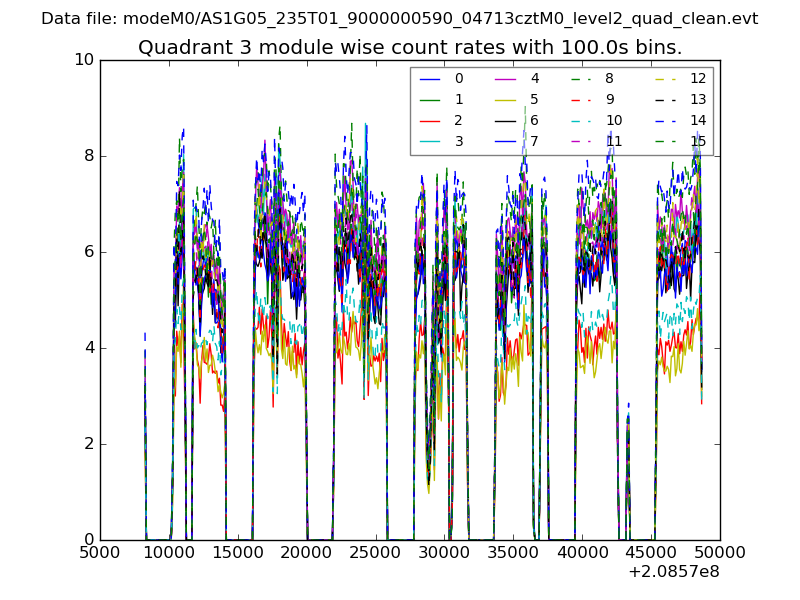
| Module-wise count rates for Quadrant A Data is divided into 100 sec bins |
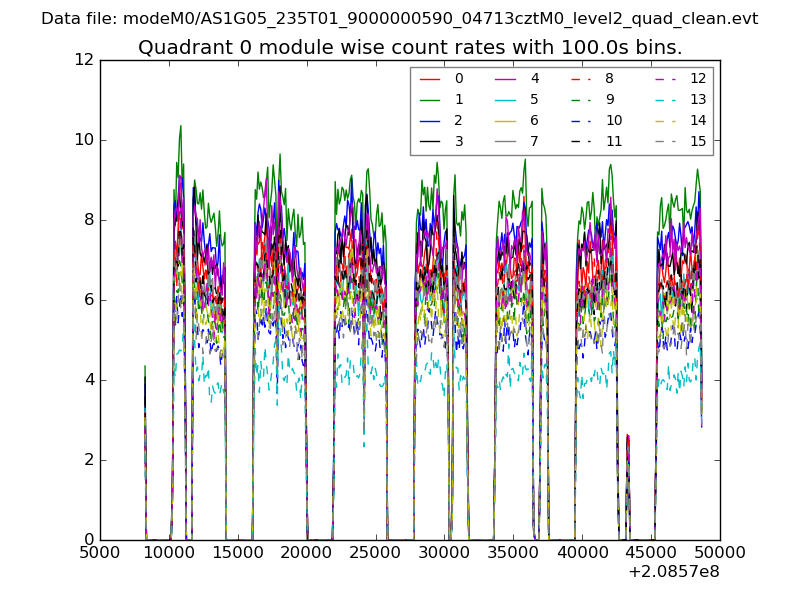 |
 |
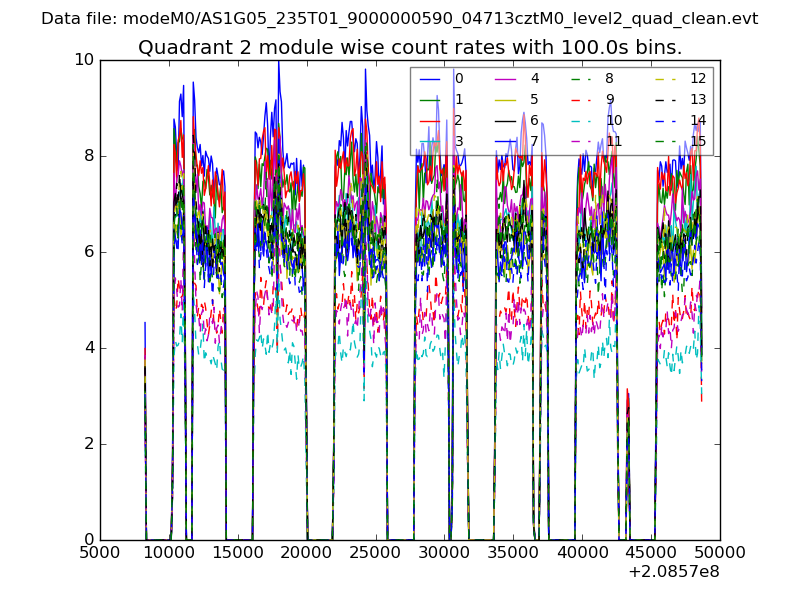
| Module-wise count rates for Quadrant B Data is divided into 100 sec bins |
 |
 |
| Module-wise count rates for Quadrant C Data is divided into 100 sec bins |
 |
 |
| Module-wise count rates for Quadrant D Data is divided into 100 sec bins |
 |
 |
| Parameter | Plot |
|---|---|
| CZT HV Monitor | 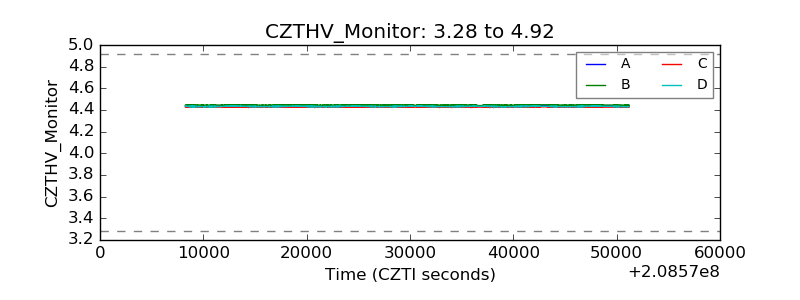 |
| D_VDD | 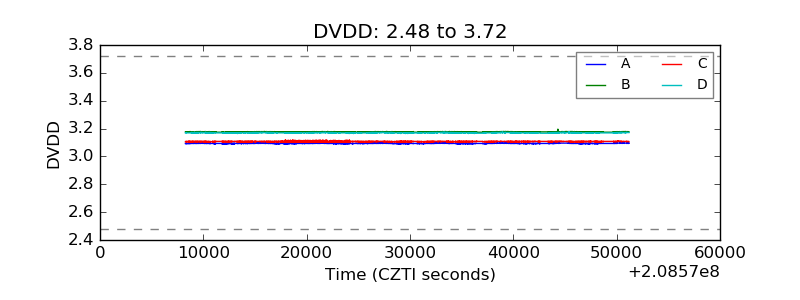 |
| Temperature 1 | 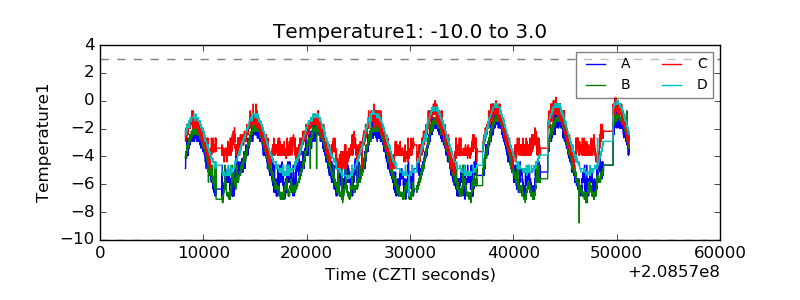 |
| Veto HV Monitor |  |
| Veto LLD | 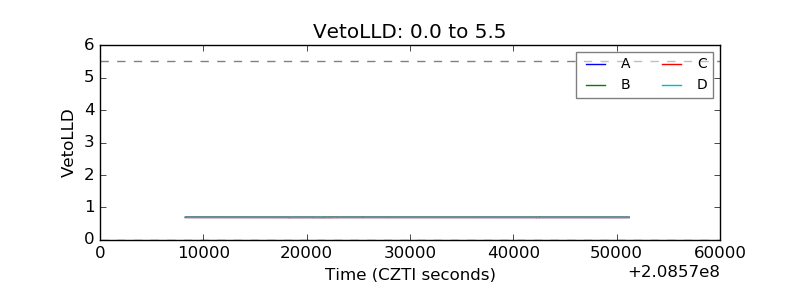 |
| Alpha Counter | 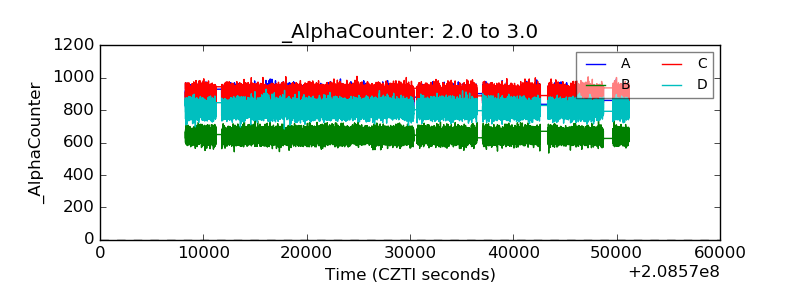 |
| _CPM_Rate | 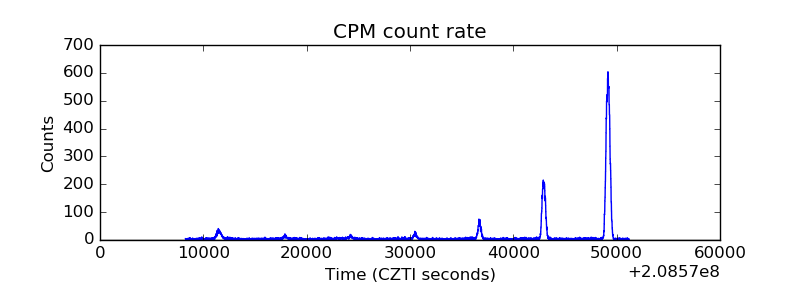 |
| CZT Counter | 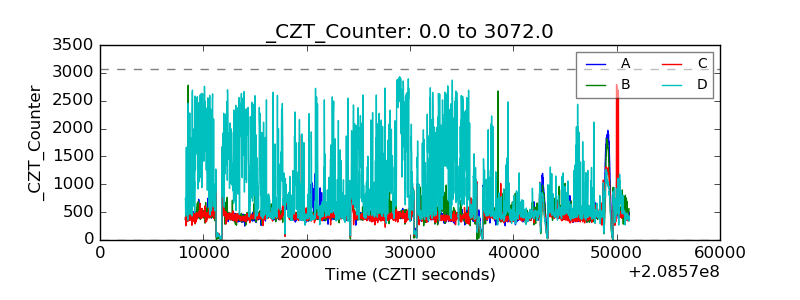 |
| +2.5 Volts monitor |  |
| +5 Volts monitor |  |
| _ROLL_ROT | 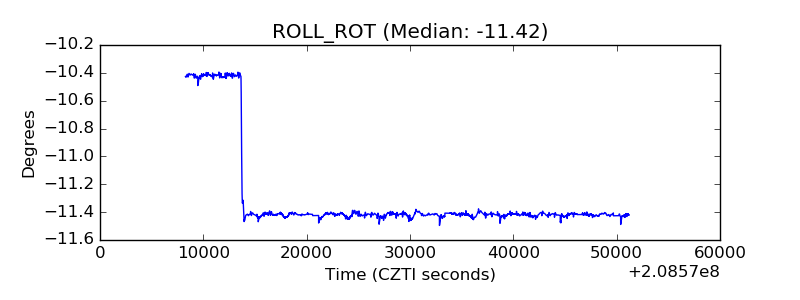 |
| _Roll_DEC | 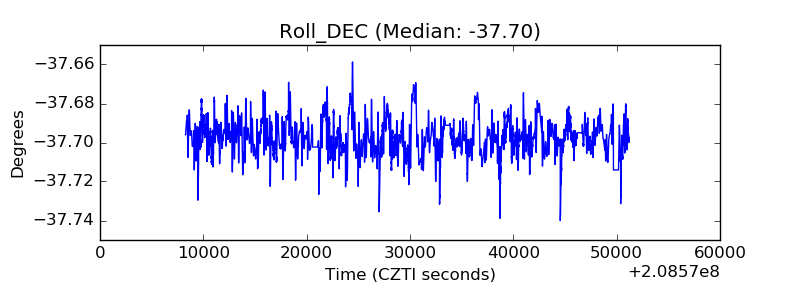 |
| _Roll_RA | 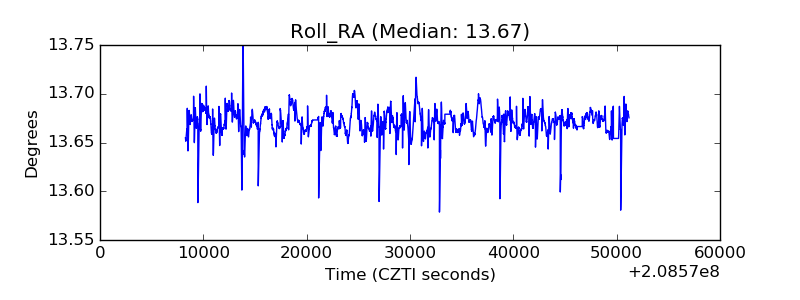 |
| Veto Counter | 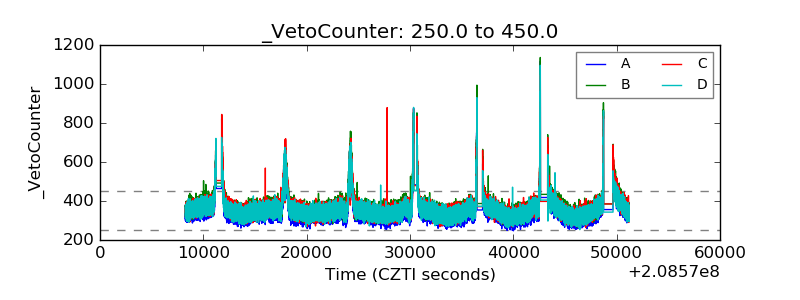 |