| Param | Original file | Final file |
|---|---|---|
| Filename | modeM0/AS1G05_235T01_9000000590_04715cztM0_level2.evt | modeM0/AS1G05_235T01_9000000590_04715cztM0_level2_quad_clean.evt |
| Size (bytes) | 131,641,920 | 17,668,800 |
| Size | 125.5 MB | 16.9 MB |
| Events in quadrant A | 937,205 | 97,209 |
| Events in quadrant B | 1,038,804 | 96,560 |
| Events in quadrant C | 866,519 | 95,284 |
| Events in quadrant D | 999,574 | 93,851 |
| Mode SS | |||
|---|---|---|---|
| Quadrant | BADHDUFLAG | Total packets | Discarded packets |
| A | 0 | 42 | 0 |
| B | 0 | 42 | 0 |
| C | 0 | 42 | 0 |
| D | 0 | 42 | 0 |
| Mode M0 | |||
|---|---|---|---|
| Quadrant | BADHDUFLAG | Total packets | Discarded packets |
| A | 0 | 4194 | 0 |
| B | 0 | 4498 | 0 |
| C | 0 | 4215 | 0 |
| D | 0 | 4571 | 0 |
| Quadrant | Total seconds | Saturated seconds | Saturation percentage |
|---|---|---|---|
| A | 2087 | 4 | 0.191663% |
| B | 2087 | 1 | 0.047916% |
| C | 2087 | 1 | 0.047916% |
| D | 2087 | 1 | 0.047916% |
Noise dominated data is calculated using 1-second bins in cleaned event files. If a bin has >2000 counts, and if more than 50% of those come from <1% of pixels, then it is considered to be noise-dominated and hence unusable.
| Quadrant | # 1 sec bins | Bins with >0 counts | Bins with >2000 counts | High rate bins dominated by noise | Noise dominated (total time) | Noise dominated (detector-on time) | Marked lightcurve |
|---|---|---|---|---|---|---|---|
| A | 2087 | 2087 | 0 | 0 | 0.00% | 0.00% | 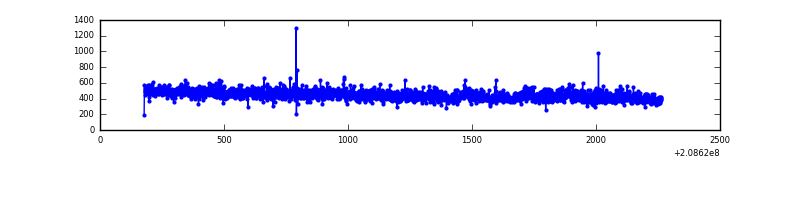 |
| B | 2087 | 2087 | 2 | 2 | 0.10% | 0.10% | 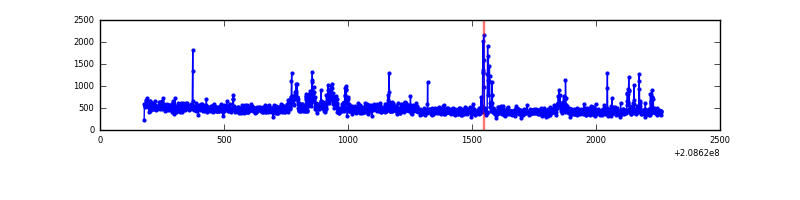 |
| C | 2087 | 2087 | 1 | 1 | 0.05% | 0.05% | 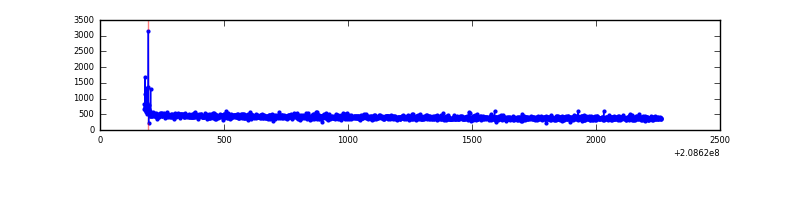 |
| D | 2087 | 2087 | 1 | 1 | 0.05% | 0.05% | 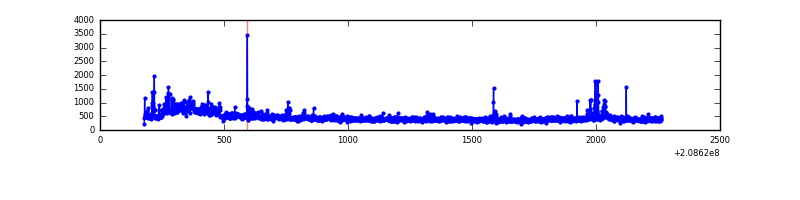 |
Top three noisy pixels from each quadrant. If the there are fewer than three noisy pixels in the level2.evt file, extra rows are filled as -1
| Pixel properties | Quadrant properties | ||||||
|---|---|---|---|---|---|---|---|
| Quadrant | DetID | PixID | Counts | Sigma | Mean | Median | Sigma |
| A | 13 | 251 | 42985 | 868.47 | 230 | 226 | 49.2 |
| A | 13 | 14 | 4857 | 94.06 | 230 | 226 | 49.2 |
| A | 12 | 194 | 2413 | 44.42 | 230 | 226 | 49.2 |
| B | 15 | 204 | 61820 | 1319.01 | 232 | 227 | 46.7 |
| B | 14 | 167 | 29349 | 623.64 | 232 | 227 | 46.7 |
| B | 10 | 16 | 19854 | 420.31 | 232 | 227 | 46.7 |
| C | 9 | 247 | 13273 | 250.32 | 218 | 218 | 52.2 |
| C | 13 | 61 | 1876 | 31.79 | 218 | 218 | 52.2 |
| C | 9 | 16 | 979 | 14.59 | 218 | 218 | 52.2 |
| D | 2 | 63 | 87203 | 1581.54 | 218 | 211 | 55.0 |
| D | 2 | 234 | 26632 | 480.34 | 218 | 211 | 55.0 |
| D | 2 | 136 | 18150 | 326.14 | 218 | 211 | 55.0 |
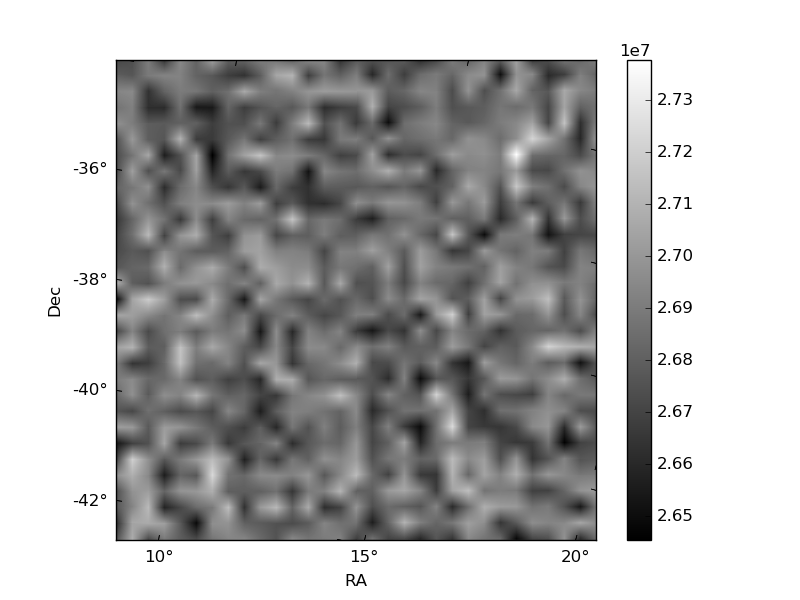
Histogram calculated using DETX and DETY for each event in the final _common_clean file
| Quadrant A | 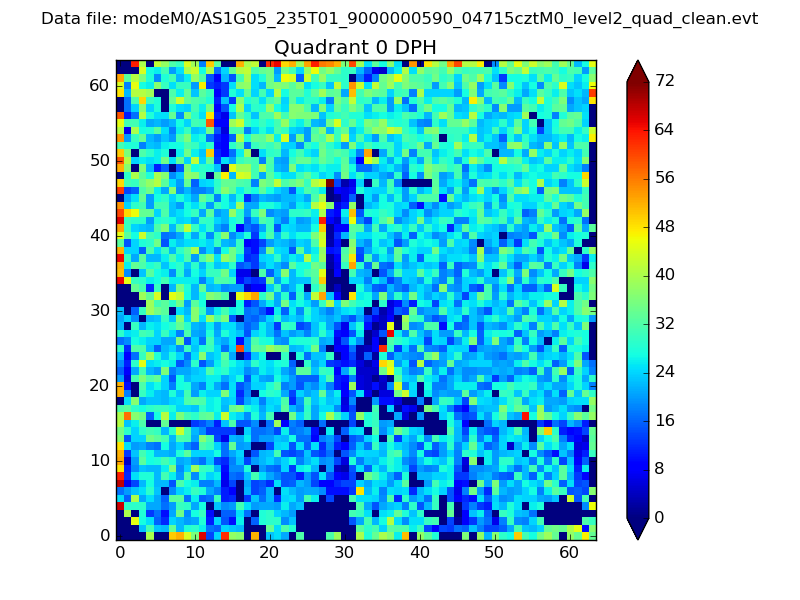 |
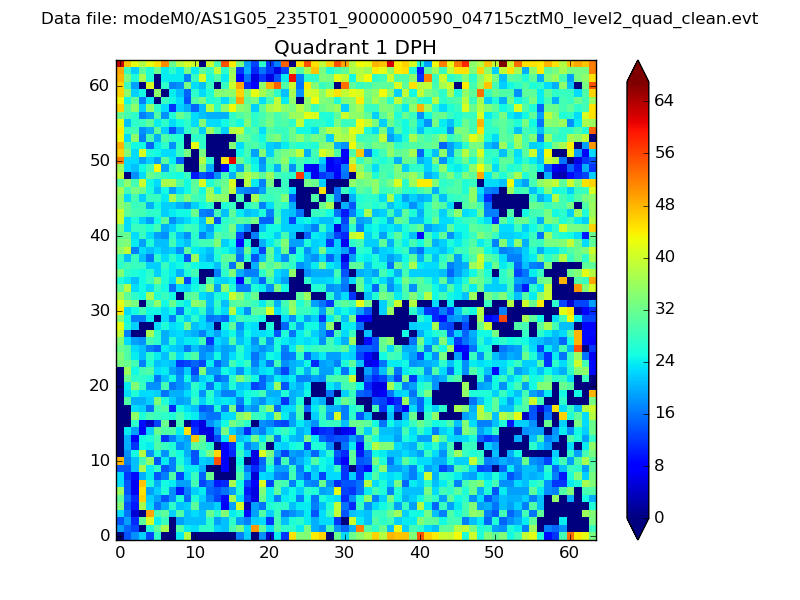 |
Quadrant B |
|---|---|---|---|
| Quadrant D | 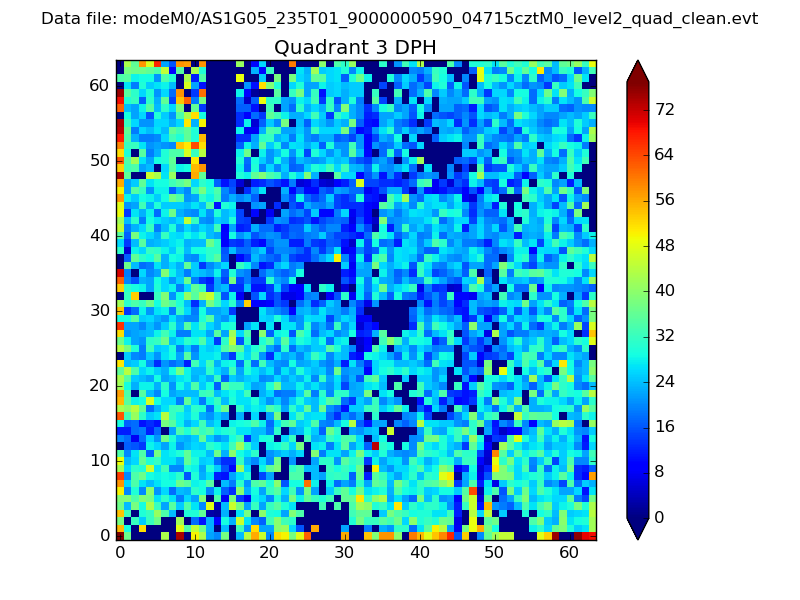 |
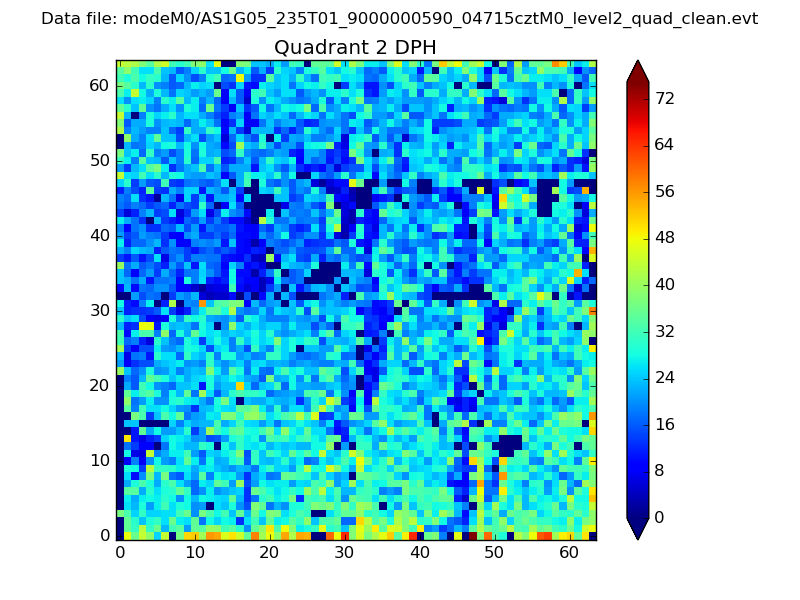 |
Quadrant C |
| Plot type | Count rate plots | Images |
|---|---|---|
| Comparison with Poisson distribution Blue bars denote a histogram of data divided into 1 sec bins. Red curve is a Poisson curve with rate = median count rate of data. |
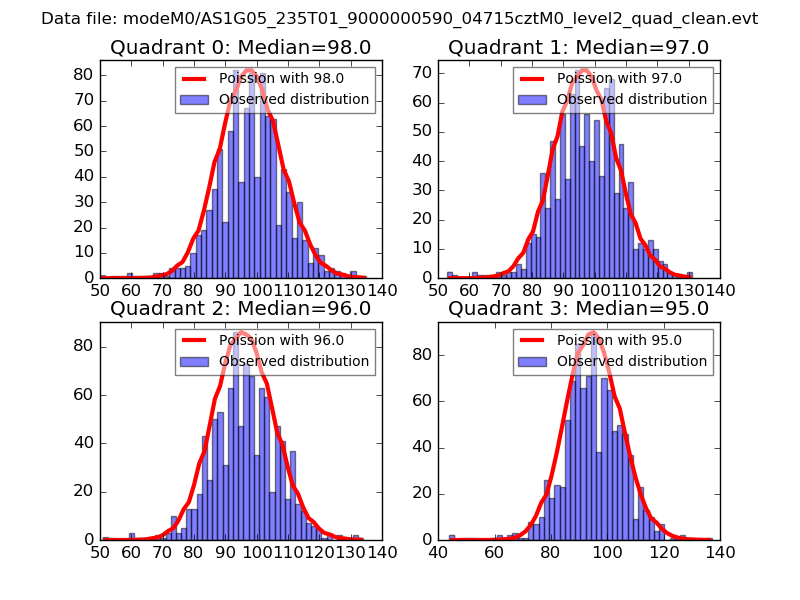 |
 |
| Quadrant-wise count rates Data is divided into 100 sec bins |
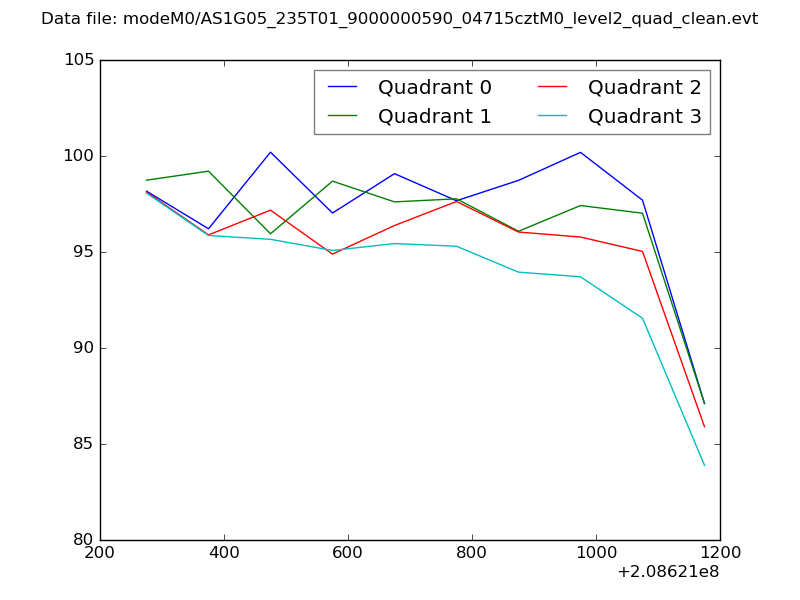 |
|
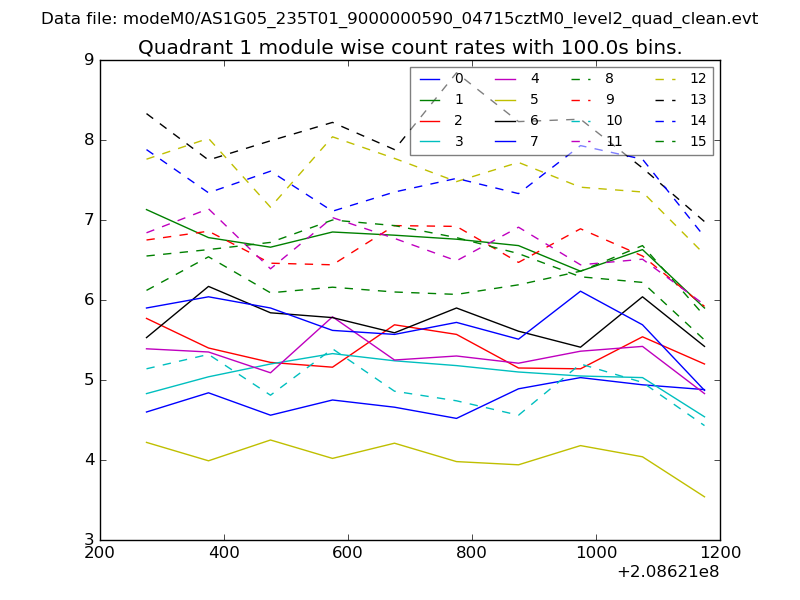
| Module-wise count rates for Quadrant A Data is divided into 100 sec bins |
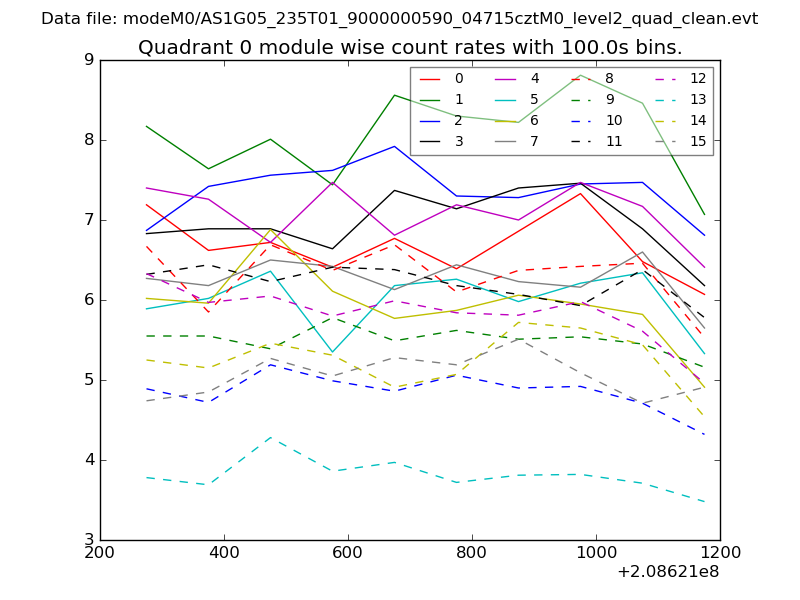 |
 |
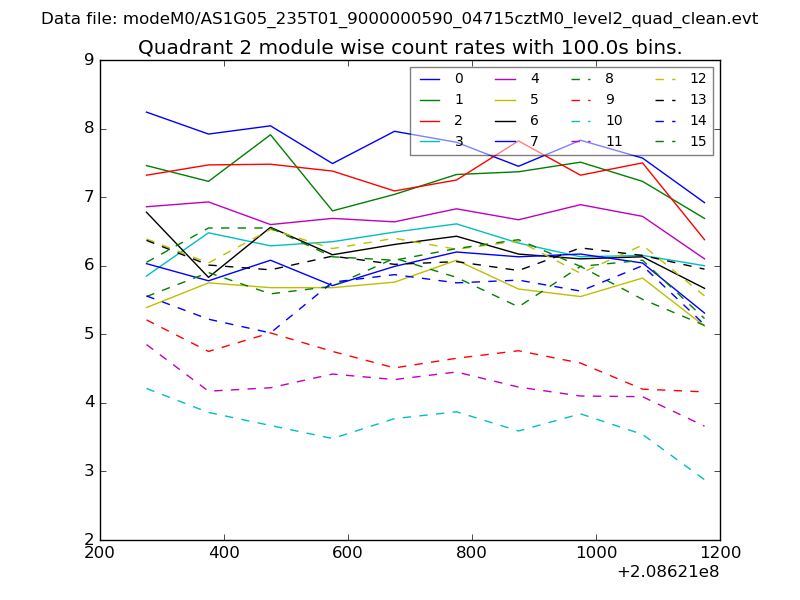
| Module-wise count rates for Quadrant B Data is divided into 100 sec bins |
 |
 |
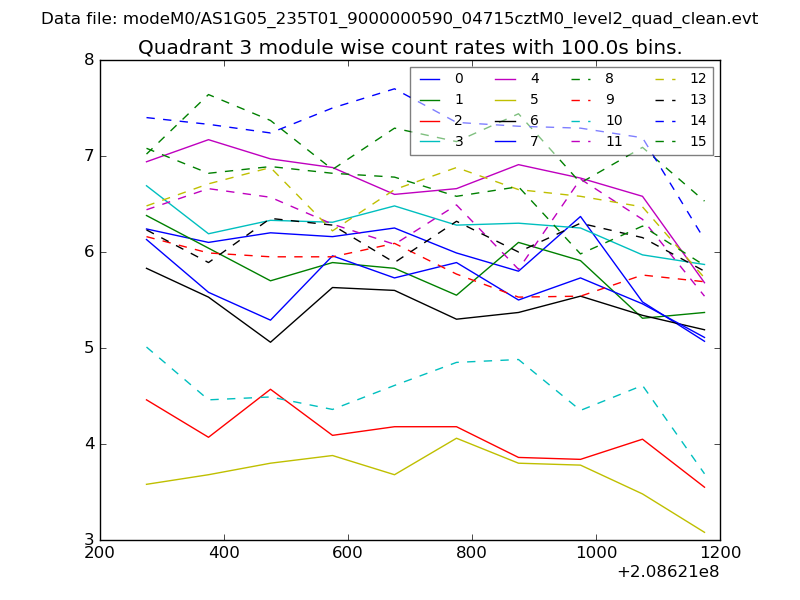
| Module-wise count rates for Quadrant C Data is divided into 100 sec bins |
 |
 |
| Module-wise count rates for Quadrant D Data is divided into 100 sec bins |
 |
 |
| Parameter | Plot |
|---|---|
| CZT HV Monitor | 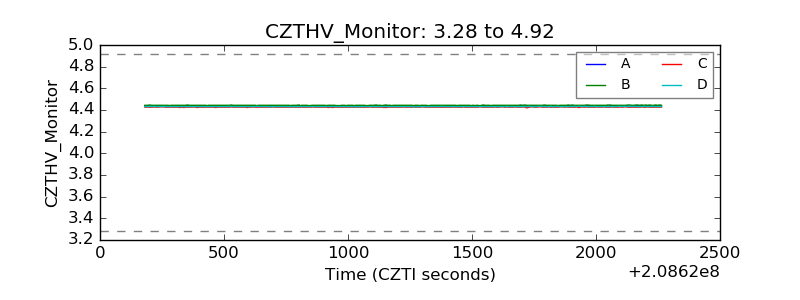 |
| D_VDD | 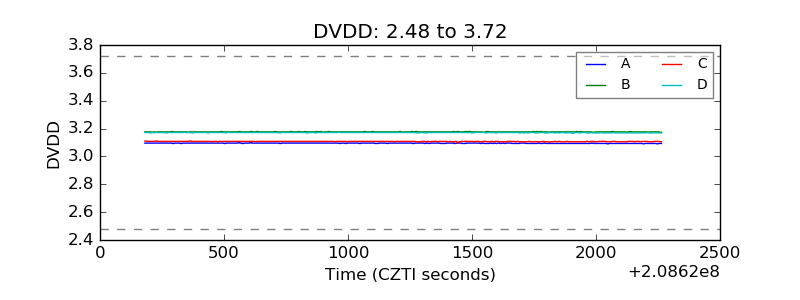 |
| Temperature 1 | 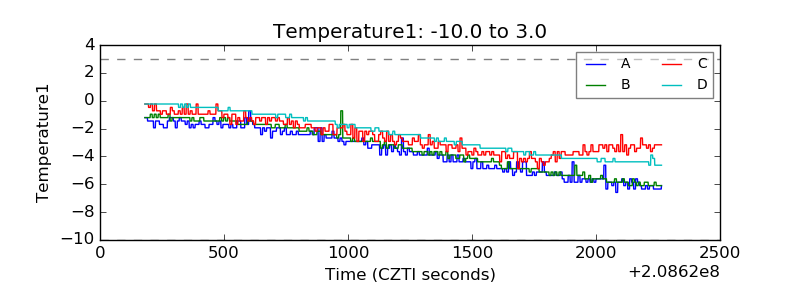 |
| Veto HV Monitor | 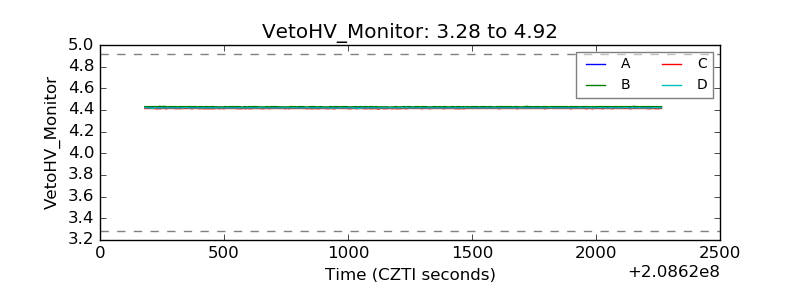 |
| Veto LLD | 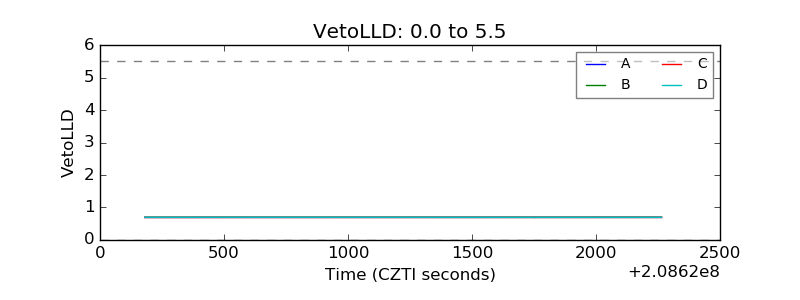 |
| Alpha Counter | 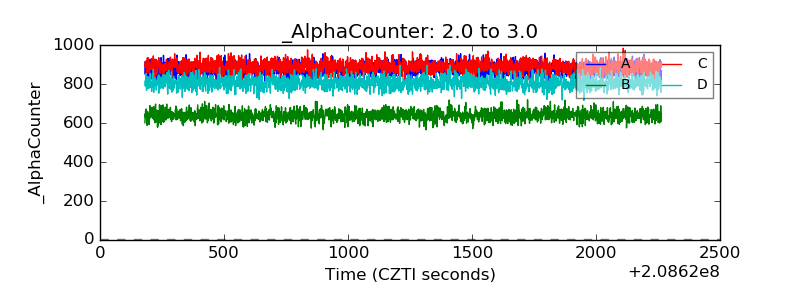 |
| _CPM_Rate | 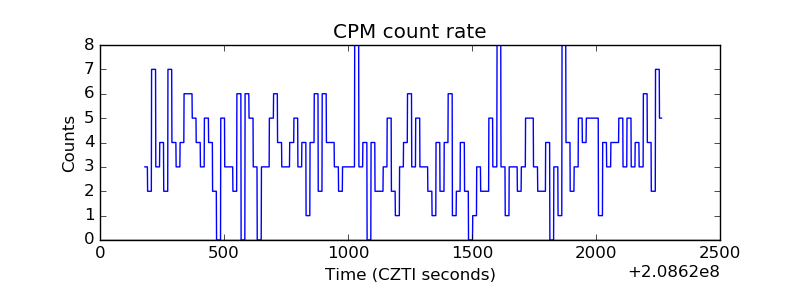 |
| CZT Counter | 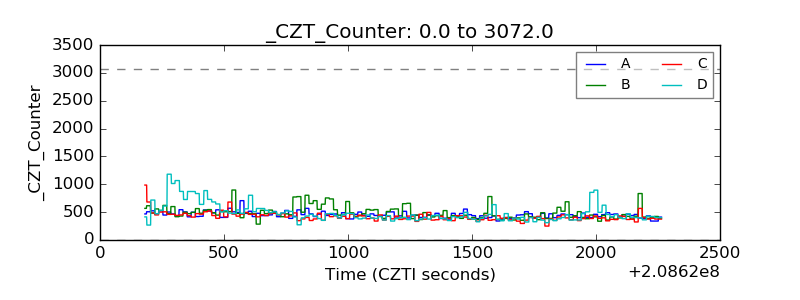 |
| +2.5 Volts monitor |  |
| +5 Volts monitor |  |
| _ROLL_ROT | 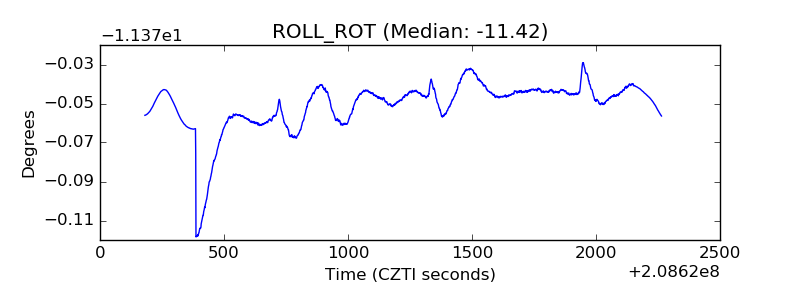 |
| _Roll_DEC | 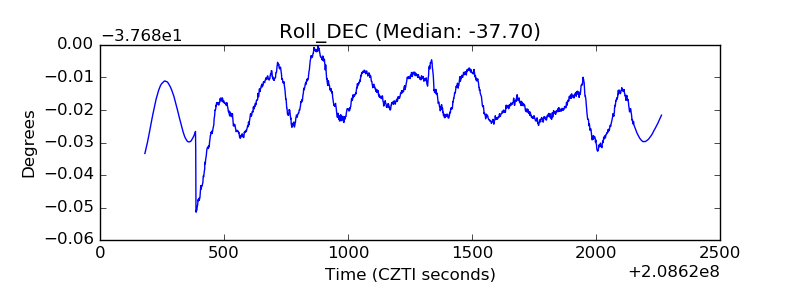 |
| _Roll_RA |  |
| Veto Counter | 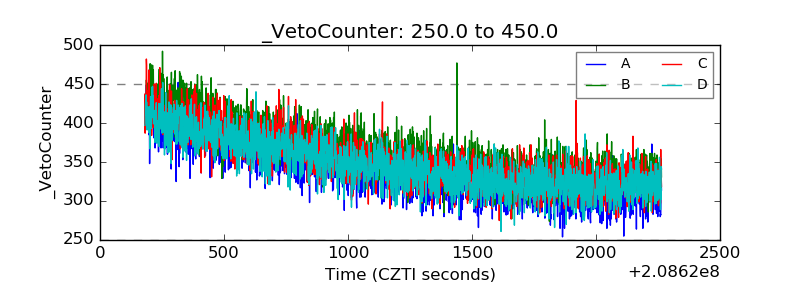 |