| Param | Original file | Final file |
|---|---|---|
| Filename | modeM0/AS1G05_227T01_9000000592cztM0_level2.fits | modeM0/AS1G05_227T01_9000000592cztM0_level2_quad_clean.evt |
| Size (bytes) | 528,675,840 | 468,869,760 |
| Size | 504.2 MB | 447.1 MB |
| Events in quadrant A | 3,166,656 | 2,646,722 |
| Events in quadrant B | 3,042,150 | 2,641,221 |
| Events in quadrant C | 3,131,830 | 2,604,267 |
| Events in quadrant D | 2,660,810 | 2,298,695 |
| Mode M0 | |||
|---|---|---|---|
| Quadrant | BADHDUFLAG | Total packets | Discarded packets |
| A | 0 | 121877 | 0 |
| B | 0 | 134841 | 0 |
| C | 0 | 131006 | 0 |
| D | 0 | 152462 | 0 |
| Mode M9 | |||
|---|---|---|---|
| Quadrant | BADHDUFLAG | Total packets | Discarded packets |
| A | 0 | 97 | 0 |
| B | 0 | 97 | 0 |
| C | 0 | 97 | 0 |
| D | 0 | 97 | 0 |
| Mode SS | |||
|---|---|---|---|
| Quadrant | BADHDUFLAG | Total packets | Discarded packets |
| A | 0 | 1186 | 0 |
| B | 0 | 1186 | 0 |
| C | 0 | 1186 | 0 |
| D | 0 | 1186 | 0 |
| Quadrant | Total seconds | Saturated seconds | Saturation percentage |
|---|---|---|---|
| A | 58439 | 751 | 1.285101% |
| B | 58439 | 1585 | 2.712230% |
| C | 58439 | 1431 | 2.448707% |
| D | 58439 | 2294 | 3.925461% |
Noise dominated data is calculated using 1-second bins in cleaned event files. If a bin has >2000 counts, and if more than 50% of those come from <1% of pixels, then it is considered to be noise-dominated and hence unusable.
| Quadrant | # 1 sec bins | Bins with >0 counts | Bins with >2000 counts | High rate bins dominated by noise | Noise dominated (total time) | Noise dominated (detector-on time) | Marked lightcurve |
|---|---|---|---|---|---|---|---|
| A | 74758 | 58429 | 0 | 0 | 0.00% | 0.00% |  |
| B | 74758 | 58396 | 0 | 0 | 0.00% | 0.00% |  |
| C | 74758 | 58436 | 0 | 0 | 0.00% | 0.00% |  |
| D | 74758 | 58413 | 0 | 0 | 0.00% | 0.00% | 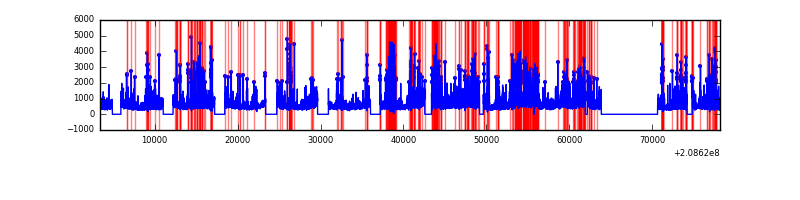 |
Top three noisy pixels from each quadrant. If the there are fewer than three noisy pixels in the level2.evt file, extra rows are filled as -1
| Pixel properties | Quadrant properties | ||||||
|---|---|---|---|---|---|---|---|
| Quadrant | DetID | PixID | Counts | Sigma | Mean | Median | Sigma |
| A | 0 | 29 | 3192 | 11.5 | 821 | 765 | 211.0 |
| A | 14 | 188 | 3123 | 11.17 | 821 | 765 | 211.0 |
| A | 14 | 204 | 2780 | 9.55 | 821 | 765 | 211.0 |
| B | 2 | 9 | 2817 | 12.54 | 804 | 763 | 163.8 |
| B | 14 | 254 | 2188 | 8.7 | 804 | 763 | 163.8 |
| B | 12 | 226 | 2104 | 8.19 | 804 | 763 | 163.8 |
| C | 1 | 80 | 2263 | 6.69 | 827 | 762 | 224.4 |
| C | 1 | 81 | 2216 | 6.48 | 827 | 762 | 224.4 |
| C | 12 | 241 | 2168 | 6.27 | 827 | 762 | 224.4 |
| D | 11 | 82 | 2134 | 7.04 | 757 | 683 | 206.2 |
| D | 4 | 160 | 2070 | 6.73 | 757 | 683 | 206.2 |
| D | 3 | 14 | 2020 | 6.48 | 757 | 683 | 206.2 |
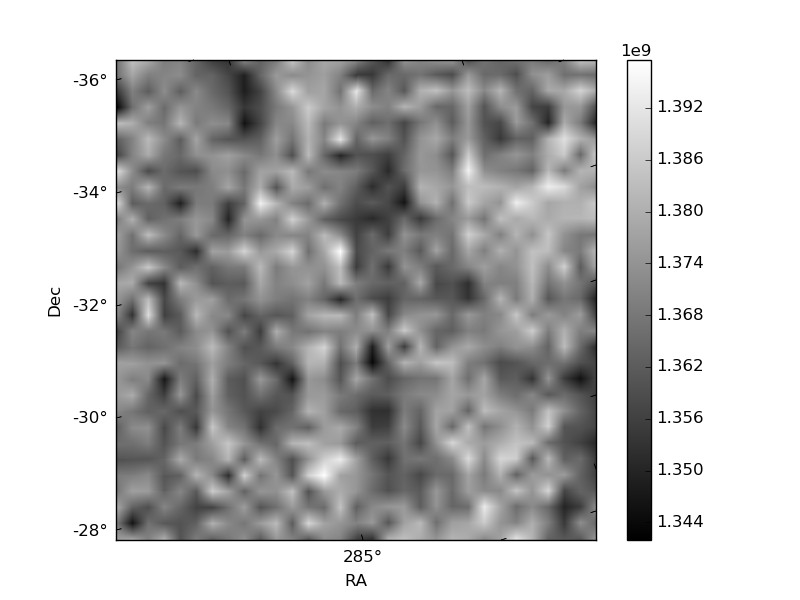
Histogram calculated using DETX and DETY for each event in the final _common_clean file
| Quadrant A | 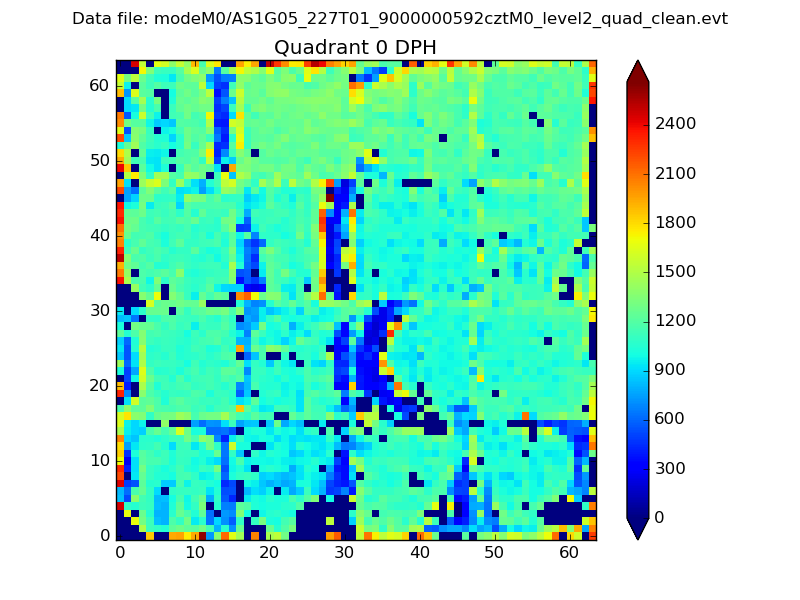 |
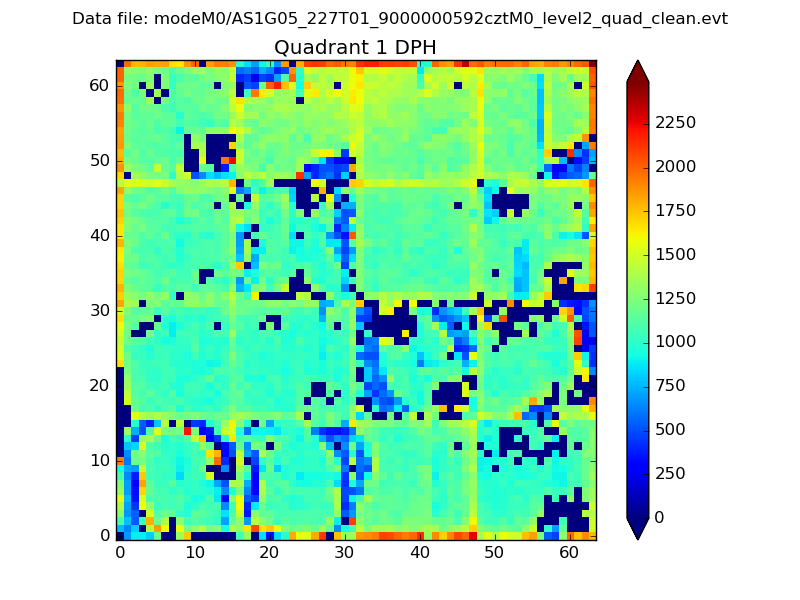 |
Quadrant B |
|---|---|---|---|
| Quadrant D |  |
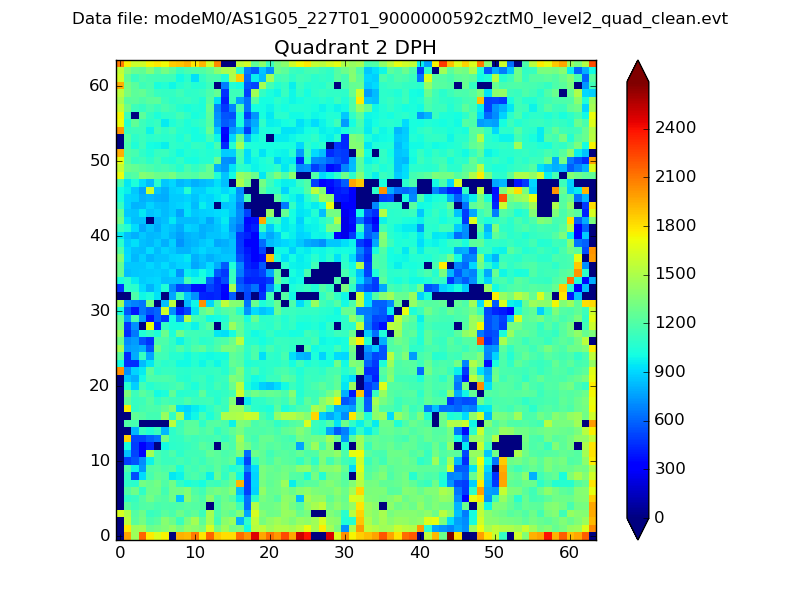 |
Quadrant C |
| Plot type | Count rate plots | Images |
|---|---|---|
| Comparison with Poisson distribution Blue bars denote a histogram of data divided into 1 sec bins. Red curve is a Poisson curve with rate = median count rate of data. |
 |
 |
| Quadrant-wise count rates Data is divided into 100 sec bins |
 |
|
| Module-wise count rates for Quadrant A Data is divided into 100 sec bins |
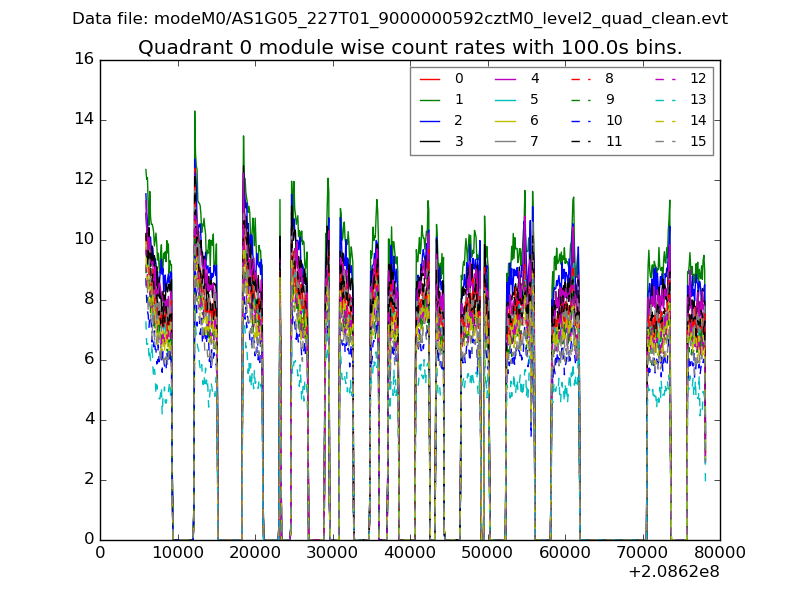 |
 |
| Module-wise count rates for Quadrant B Data is divided into 100 sec bins |
 |
 |
| Module-wise count rates for Quadrant C Data is divided into 100 sec bins |
 |
 |
| Module-wise count rates for Quadrant D Data is divided into 100 sec bins |
 |
 |
| Parameter | Plot |
|---|---|
| CZT HV Monitor |  |
| D_VDD |  |
| Temperature 1 |  |
| Veto HV Monitor |  |
| Veto LLD |  |
| Alpha Counter |  |
| _CPM_Rate |  |
| CZT Counter |  |
| +2.5 Volts monitor |  |
| +5 Volts monitor |  |
| _ROLL_ROT | 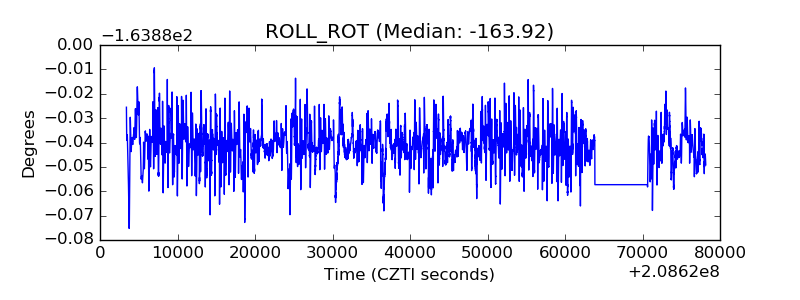 |
| _Roll_DEC | 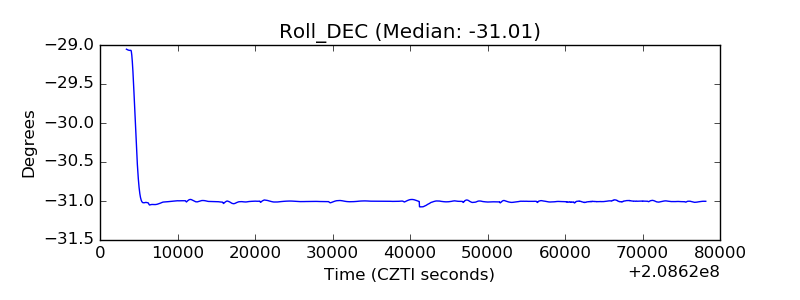 |
| _Roll_RA |  |
| Veto Counter | 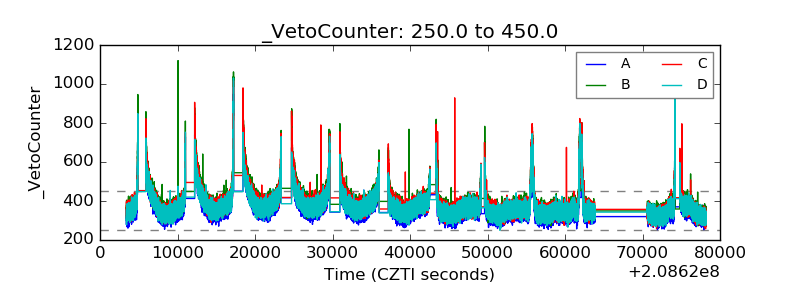 |