| Param | Original file | Final file |
|---|---|---|
| Filename | modeM0/AS1G05_227T01_9000000592_04715cztM0_level2.evt | modeM0/AS1G05_227T01_9000000592_04715cztM0_level2_quad_clean.evt |
| Size (bytes) | 193,651,200 | 26,648,640 |
| Size | 184.7 MB | 25.4 MB |
| Events in quadrant A | 1,369,613 | 153,149 |
| Events in quadrant B | 1,432,000 | 154,658 |
| Events in quadrant C | 1,335,475 | 154,218 |
| Events in quadrant D | 1,538,170 | 147,130 |
| Mode M0 | |||
|---|---|---|---|
| Quadrant | BADHDUFLAG | Total packets | Discarded packets |
| A | 0 | 5851 | 2 |
| B | 0 | 6012 | 1 |
| C | 0 | 5751 | 1 |
| D | 0 | 6340 | 1 |
| Mode M9 | |||
|---|---|---|---|
| Quadrant | BADHDUFLAG | Total packets | Discarded packets |
| A | 0 | 11 | 0 |
| B | 0 | 11 | 0 |
| C | 0 | 11 | 0 |
| D | 0 | 11 | 0 |
| Mode SS | |||
|---|---|---|---|
| Quadrant | BADHDUFLAG | Total packets | Discarded packets |
| A | 0 | 56 | 0 |
| B | 0 | 56 | 0 |
| C | 0 | 56 | 0 |
| D | 0 | 56 | 0 |
| Quadrant | Total seconds | Saturated seconds | Saturation percentage |
|---|---|---|---|
| A | 2759 | 58 | 2.102211% |
| B | 2759 | 52 | 1.884741% |
| C | 2759 | 35 | 1.268576% |
| D | 2759 | 54 | 1.957231% |
Noise dominated data is calculated using 1-second bins in cleaned event files. If a bin has >2000 counts, and if more than 50% of those come from <1% of pixels, then it is considered to be noise-dominated and hence unusable.
| Quadrant | # 1 sec bins | Bins with >0 counts | Bins with >2000 counts | High rate bins dominated by noise | Noise dominated (total time) | Noise dominated (detector-on time) | Marked lightcurve |
|---|---|---|---|---|---|---|---|
| A | 3799 | 2759 | 0 | 0 | 0.00% | 0.00% | 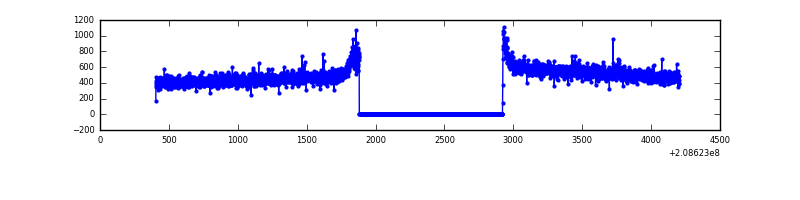 |
| B | 3799 | 2760 | 0 | 0 | 0.00% | 0.00% | 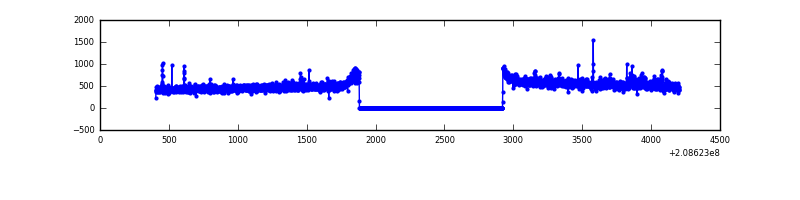 |
| C | 3799 | 2760 | 0 | 0 | 0.00% | 0.00% | 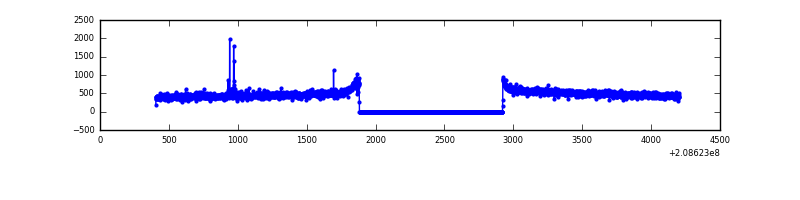 |
| D | 3799 | 2760 | 3 | 3 | 0.08% | 0.11% |  |
Top three noisy pixels from each quadrant. If the there are fewer than three noisy pixels in the level2.evt file, extra rows are filled as -1
| Pixel properties | Quadrant properties | ||||||
|---|---|---|---|---|---|---|---|
| Quadrant | DetID | PixID | Counts | Sigma | Mean | Median | Sigma |
| A | 13 | 251 | 10548 | 141.07 | 349 | 341 | 72.4 |
| A | 8 | 15 | 8530 | 113.18 | 349 | 341 | 72.4 |
| A | 13 | 14 | 6071 | 79.19 | 349 | 341 | 72.4 |
| B | 14 | 167 | 19682 | 275.2 | 352 | 344 | 70.3 |
| B | 15 | 204 | 17404 | 242.78 | 352 | 344 | 70.3 |
| B | 4 | 80 | 12169 | 168.28 | 352 | 344 | 70.3 |
| C | 9 | 16 | 8076 | 96.02 | 339 | 340 | 80.6 |
| C | 13 | 61 | 2755 | 29.98 | 339 | 340 | 80.6 |
| C | 9 | 247 | 1983 | 20.39 | 339 | 340 | 80.6 |
| D | 2 | 63 | 144992 | 1755.84 | 337 | 327 | 82.4 |
| D | 2 | 234 | 43778 | 527.38 | 337 | 327 | 82.4 |
| D | 2 | 136 | 30916 | 371.27 | 337 | 327 | 82.4 |
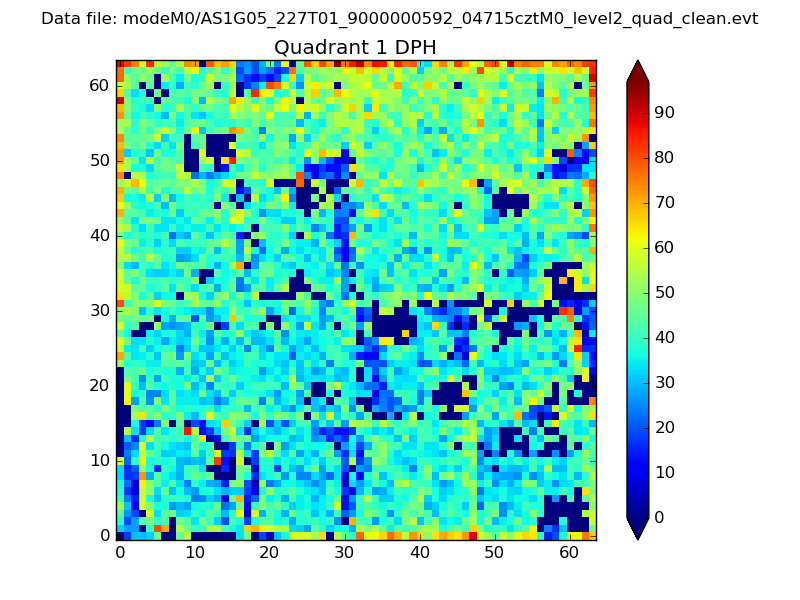
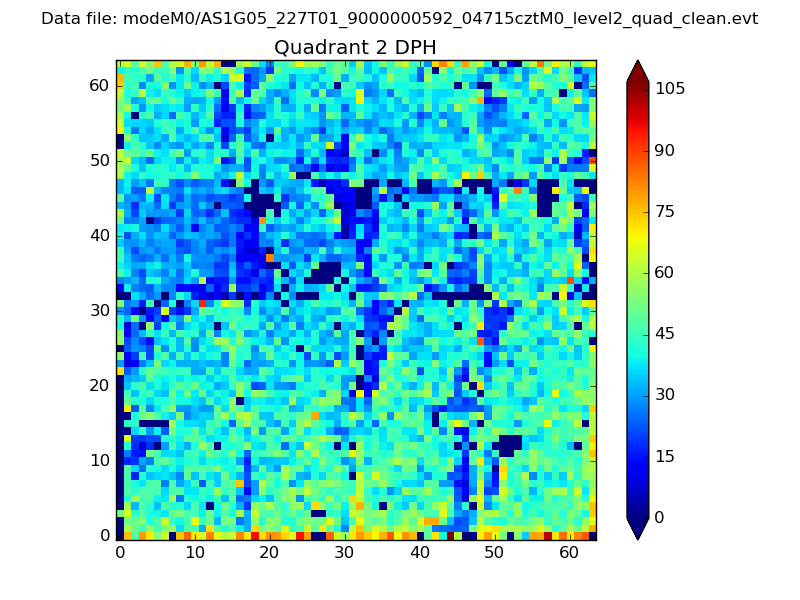
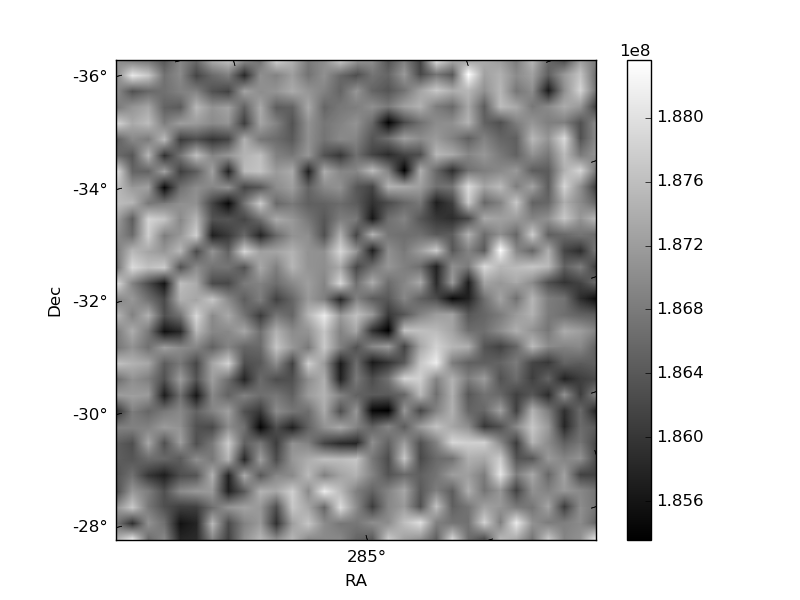
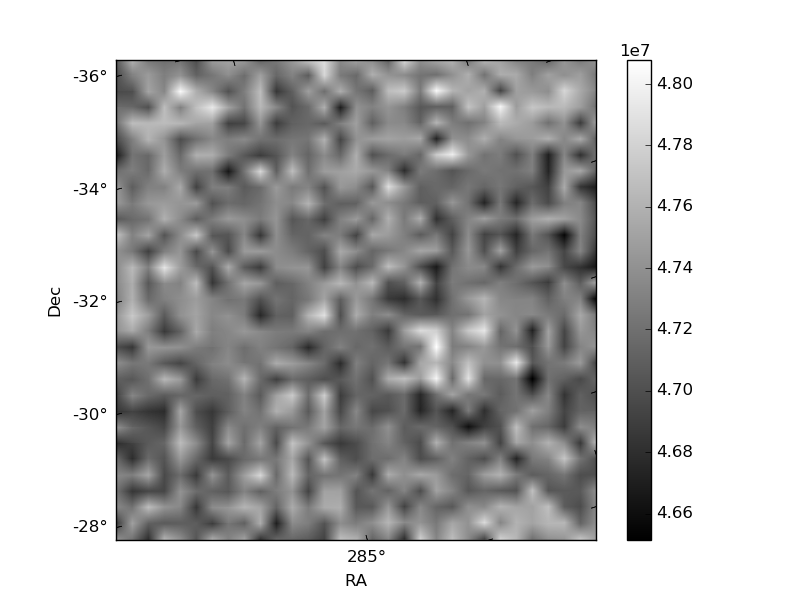
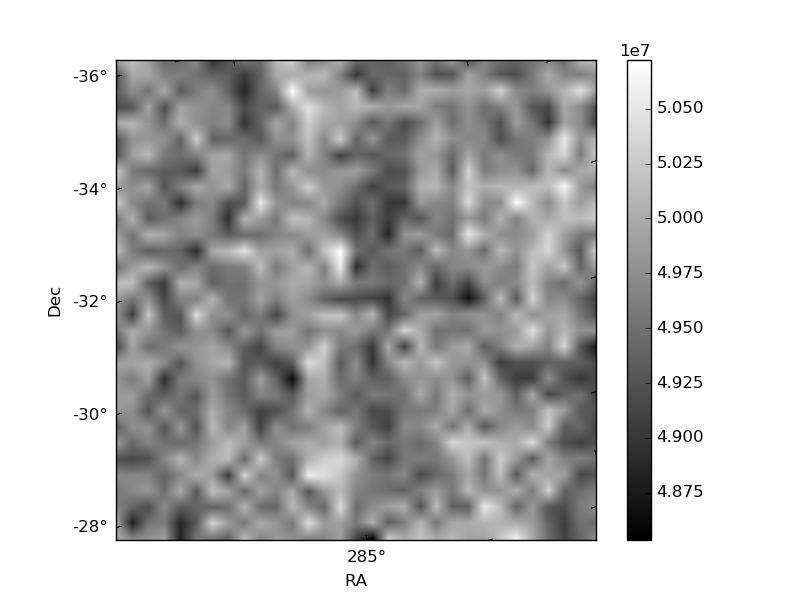
Histogram calculated using DETX and DETY for each event in the final _common_clean file
| Quadrant A | 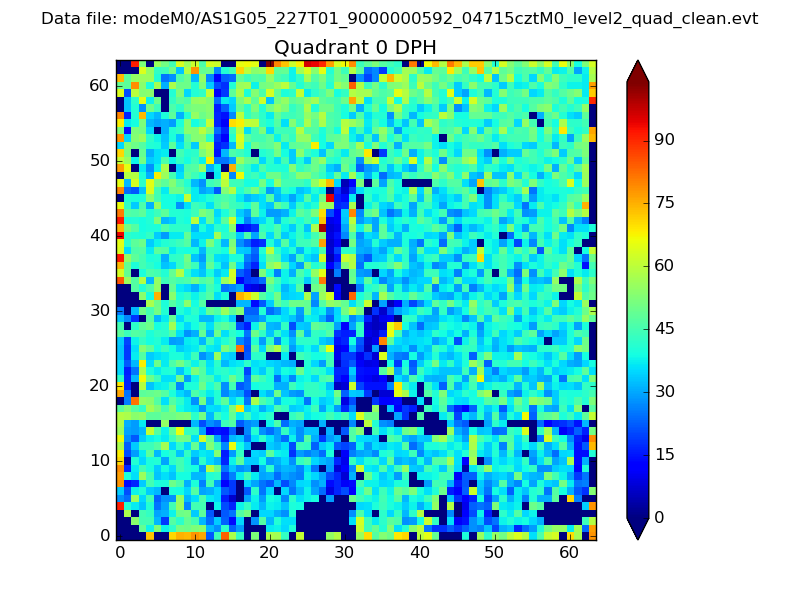 |
 |
Quadrant B |
|---|---|---|---|
| Quadrant D | 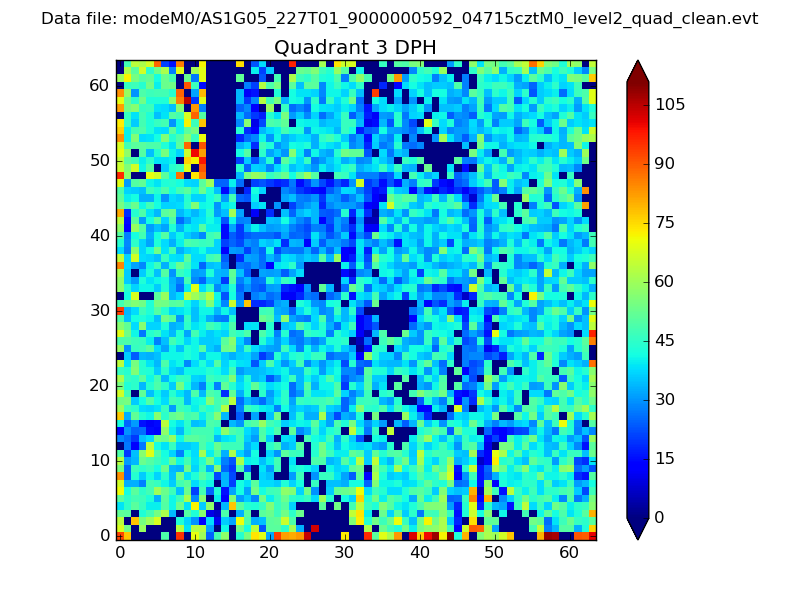 |
 |
Quadrant C |
| Plot type | Count rate plots | Images |
|---|---|---|
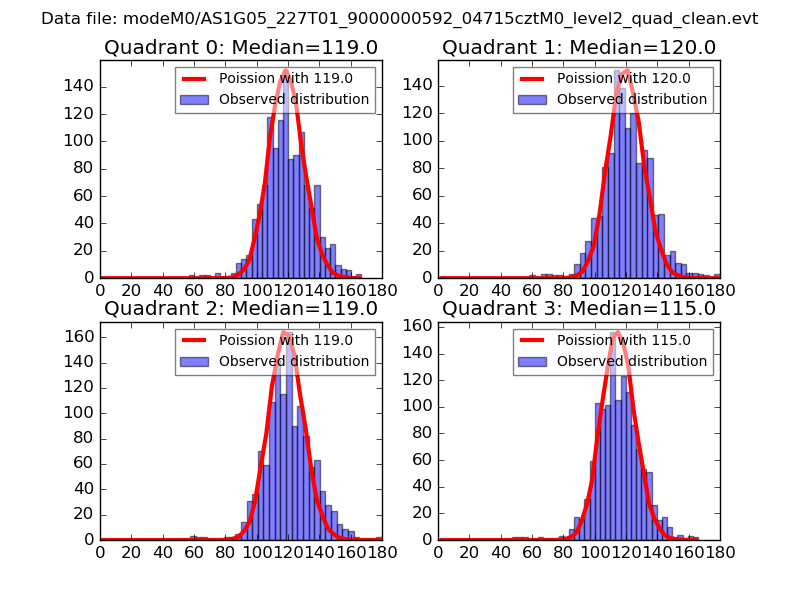
| Comparison with Poisson distribution Blue bars denote a histogram of data divided into 1 sec bins. Red curve is a Poisson curve with rate = median count rate of data. |
 |
 |
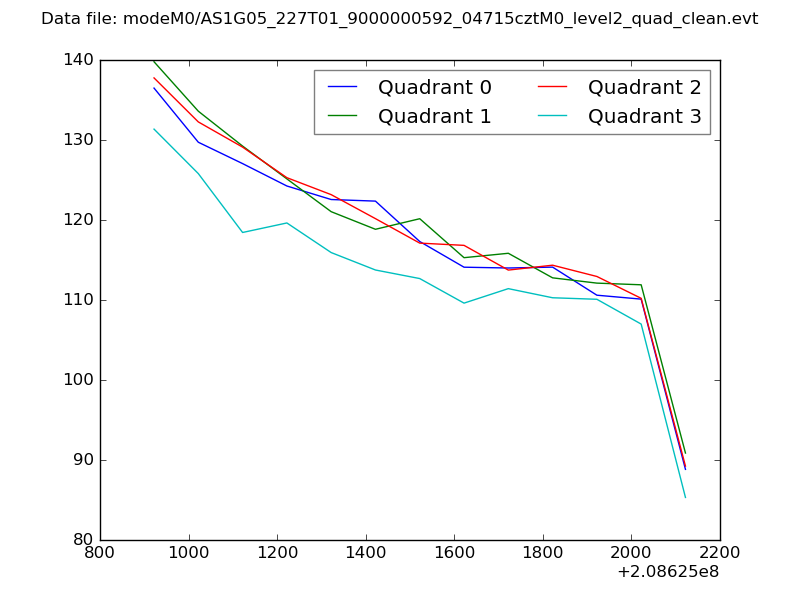
| Quadrant-wise count rates Data is divided into 100 sec bins |
 |
|
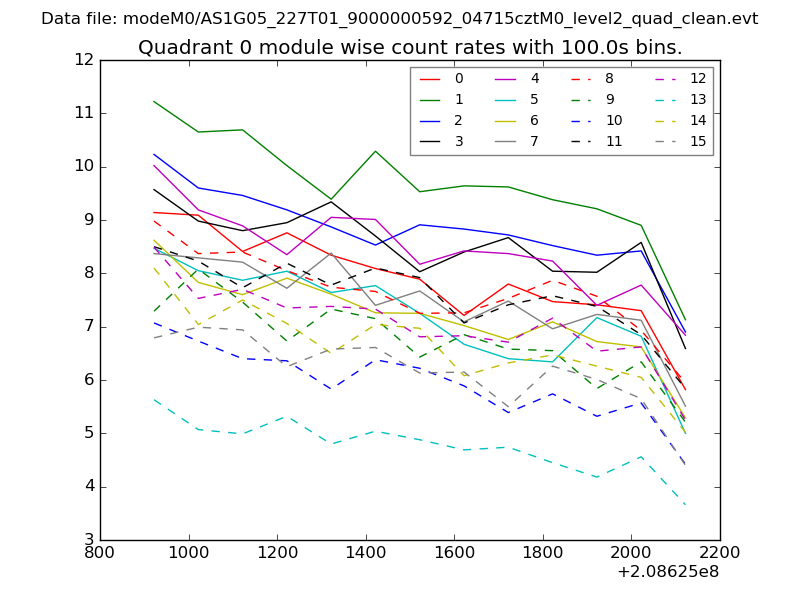
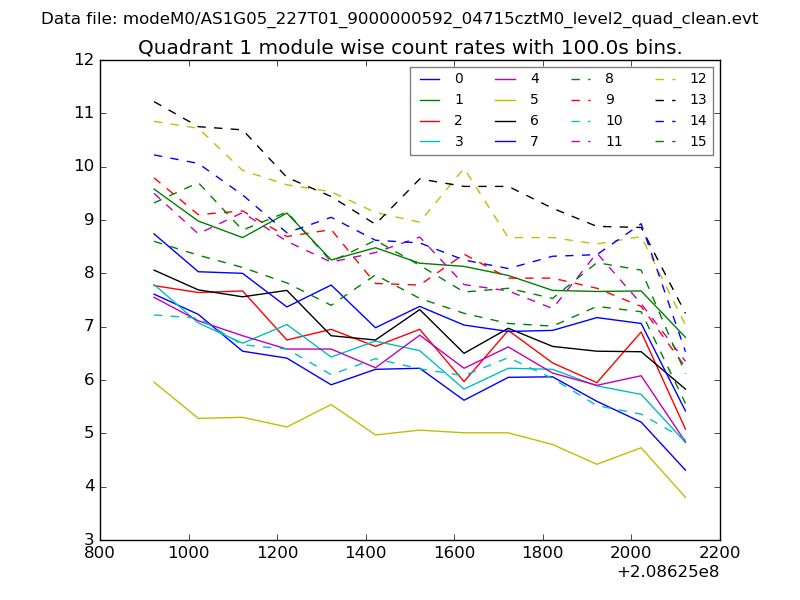
| Module-wise count rates for Quadrant A Data is divided into 100 sec bins |
 |
 |
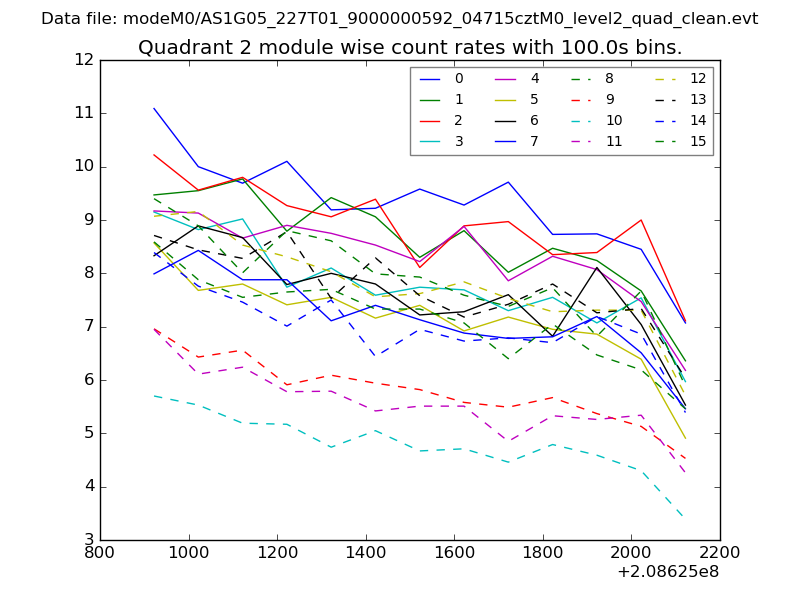
| Module-wise count rates for Quadrant B Data is divided into 100 sec bins |
 |
 |
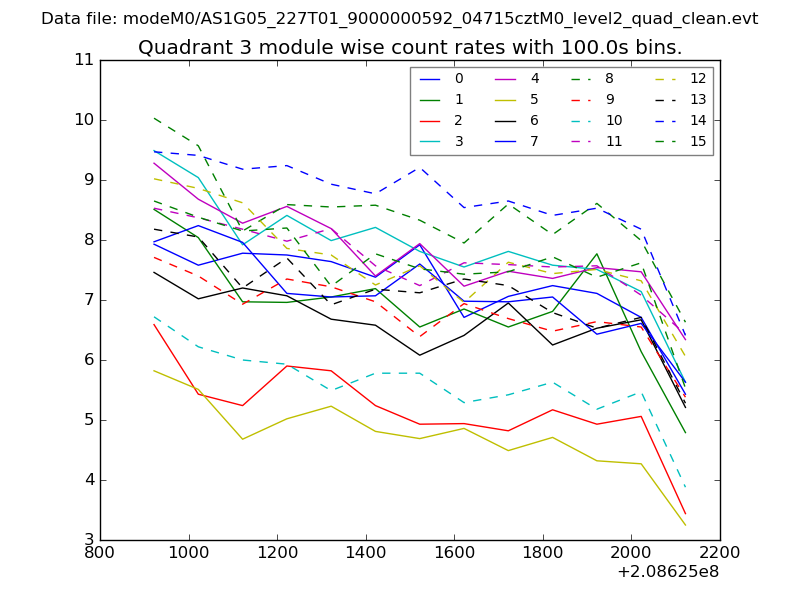
| Module-wise count rates for Quadrant C Data is divided into 100 sec bins |
 |
 |
| Module-wise count rates for Quadrant D Data is divided into 100 sec bins |
 |
 |
| Parameter | Plot |
|---|---|
| CZT HV Monitor | 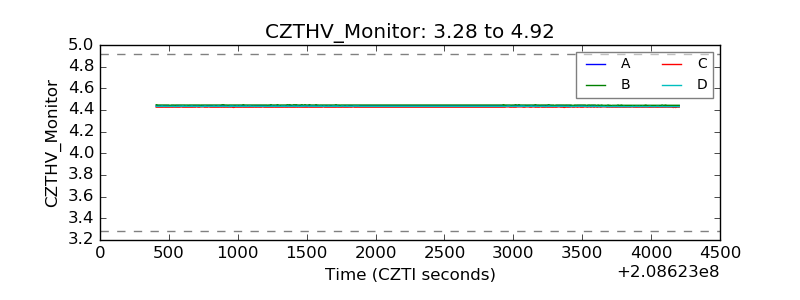 |
| D_VDD | 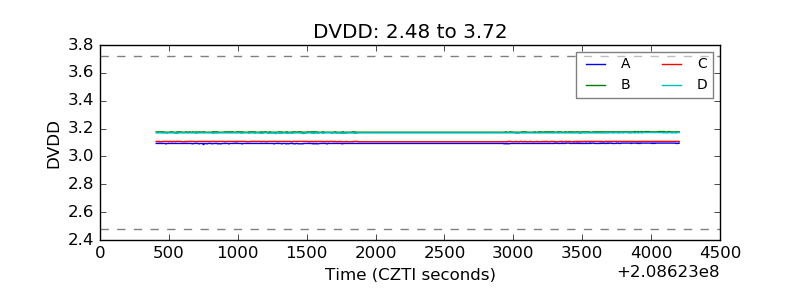 |
| Temperature 1 | 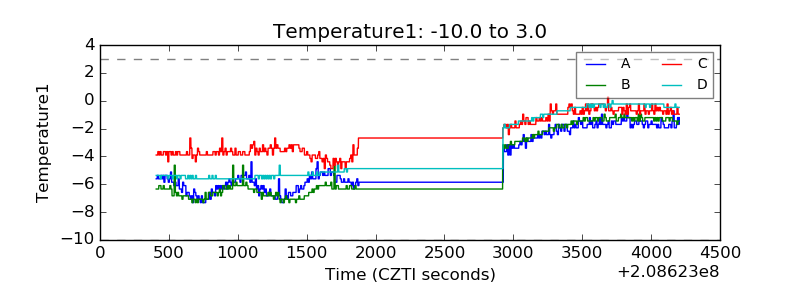 |
| Veto HV Monitor | 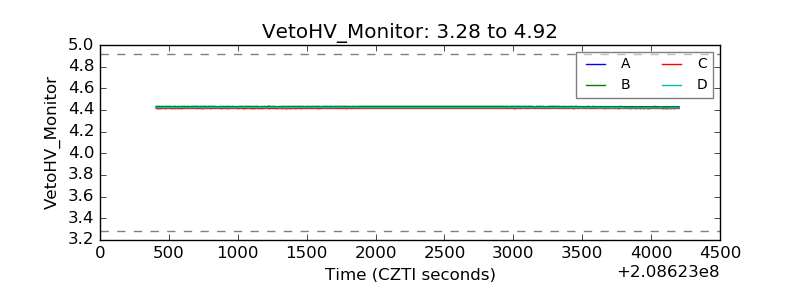 |
| Veto LLD | 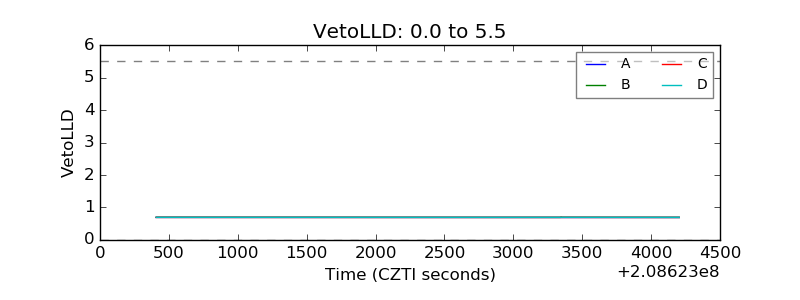 |
| Alpha Counter | 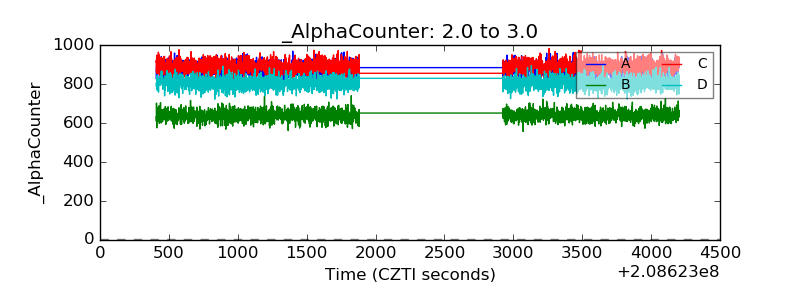 |
| _CPM_Rate | 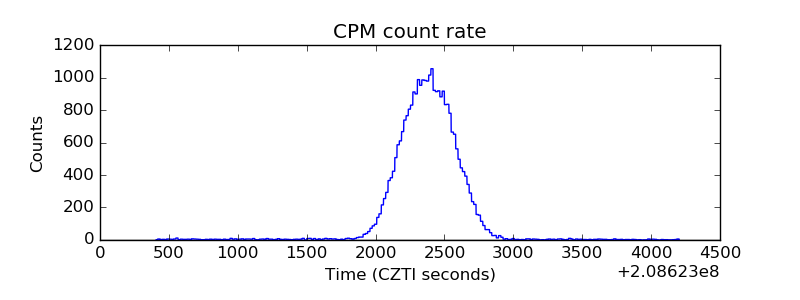 |
| CZT Counter | 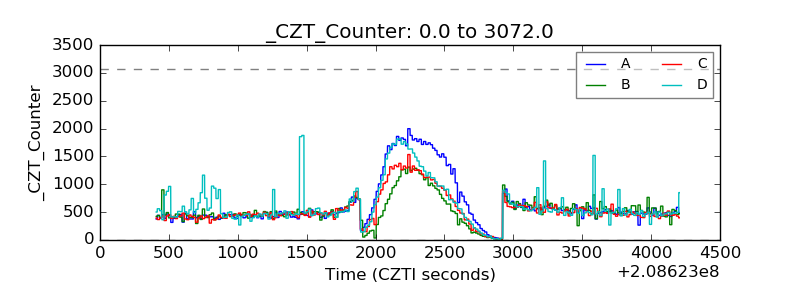 |
| +2.5 Volts monitor |  |
| +5 Volts monitor |  |
| _ROLL_ROT | 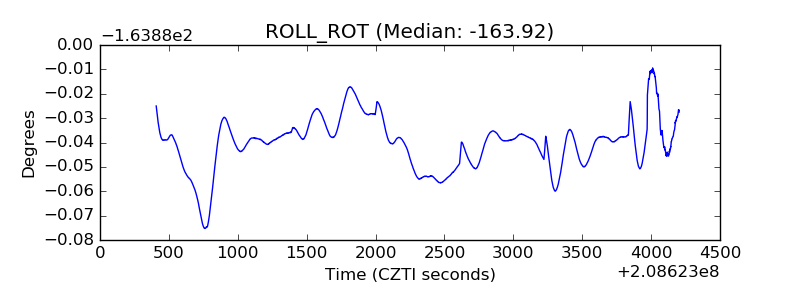 |
| _Roll_DEC | 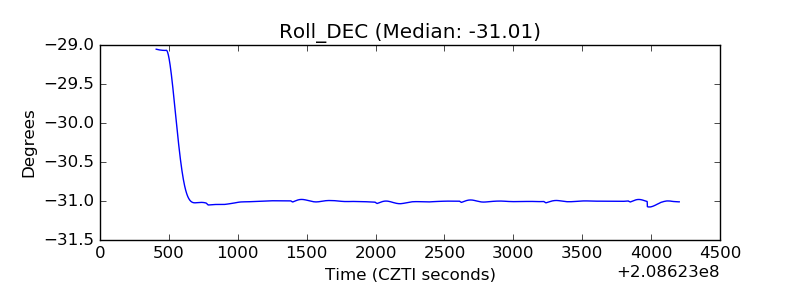 |
| _Roll_RA | 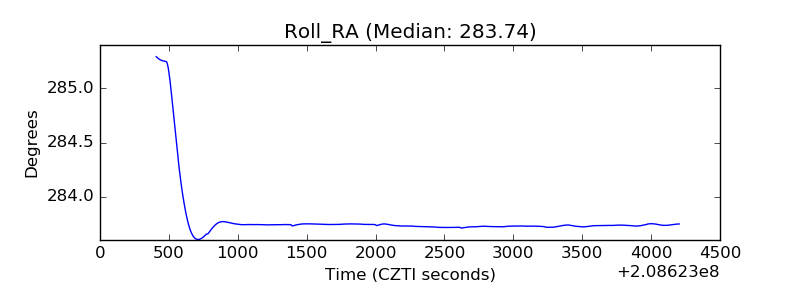 |
| Veto Counter | 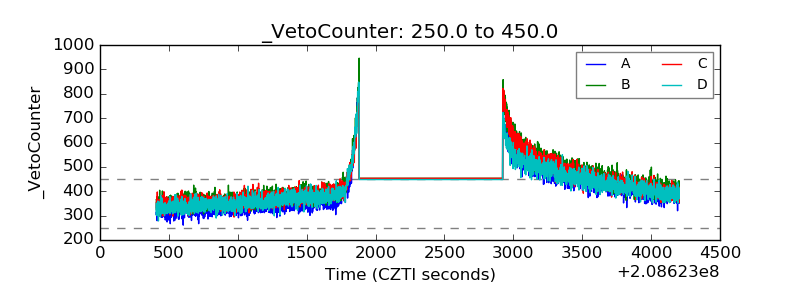 |