| Param | Original file | Final file |
|---|---|---|
| Filename | modeM0/AS1G05_227T01_9000000592_04717cztM0_level2.evt | modeM0/AS1G05_227T01_9000000592_04717cztM0_level2_quad_clean.evt |
| Size (bytes) | 450,596,160 | 79,781,760 |
| Size | 429.7 MB | 76.1 MB |
| Events in quadrant A | 2,986,795 | 499,572 |
| Events in quadrant B | 3,453,519 | 500,983 |
| Events in quadrant C | 2,889,742 | 500,613 |
| Events in quadrant D | 3,886,741 | 473,543 |
| Mode M0 | |||
|---|---|---|---|
| Quadrant | BADHDUFLAG | Total packets | Discarded packets |
| A | 0 | 13177 | 2 |
| B | 0 | 14481 | 1 |
| C | 0 | 13014 | 1 |
| D | 0 | 15580 | 1 |
| Mode M9 | |||
|---|---|---|---|
| Quadrant | BADHDUFLAG | Total packets | Discarded packets |
| A | 0 | 12 | 0 |
| B | 0 | 12 | 0 |
| C | 0 | 12 | 0 |
| D | 0 | 12 | 0 |
| Mode SS | |||
|---|---|---|---|
| Quadrant | BADHDUFLAG | Total packets | Discarded packets |
| A | 0 | 128 | 0 |
| B | 0 | 128 | 0 |
| C | 0 | 128 | 0 |
| D | 0 | 128 | 0 |
| Quadrant | Total seconds | Saturated seconds | Saturation percentage |
|---|---|---|---|
| A | 6321 | 80 | 1.265623% |
| B | 6321 | 140 | 2.214839% |
| C | 6321 | 51 | 0.806834% |
| D | 6321 | 131 | 2.072457% |
Noise dominated data is calculated using 1-second bins in cleaned event files. If a bin has >2000 counts, and if more than 50% of those come from <1% of pixels, then it is considered to be noise-dominated and hence unusable.
| Quadrant | # 1 sec bins | Bins with >0 counts | Bins with >2000 counts | High rate bins dominated by noise | Noise dominated (total time) | Noise dominated (detector-on time) | Marked lightcurve |
|---|---|---|---|---|---|---|---|
| A | 7541 | 6322 | 0 | 0 | 0.00% | 0.00% | 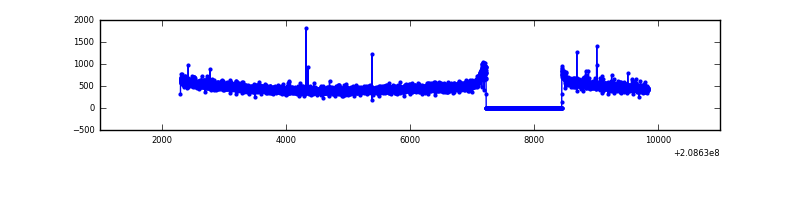 |
| B | 7541 | 6322 | 53 | 53 | 0.70% | 0.84% | 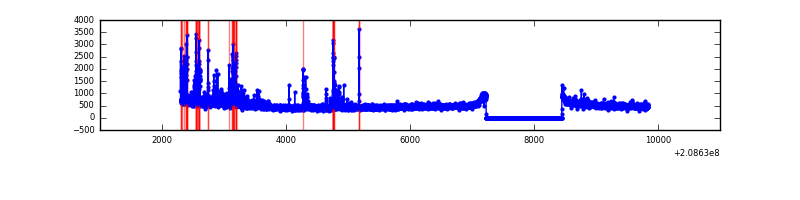 |
| C | 7541 | 6322 | 1 | 1 | 0.01% | 0.02% | 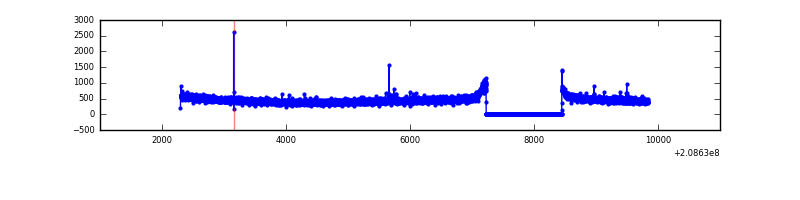 |
| D | 7541 | 6322 | 59 | 59 | 0.78% | 0.93% | 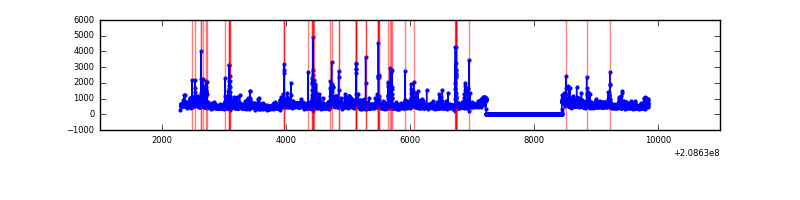 |
Top three noisy pixels from each quadrant. If the there are fewer than three noisy pixels in the level2.evt file, extra rows are filled as -1
| Pixel properties | Quadrant properties | ||||||
|---|---|---|---|---|---|---|---|
| Quadrant | DetID | PixID | Counts | Sigma | Mean | Median | Sigma |
| A | 13 | 14 | 20889 | 129.14 | 765 | 751 | 155.9 |
| A | 0 | 118 | 11569 | 69.37 | 765 | 751 | 155.9 |
| A | 0 | 226 | 9031 | 53.1 | 765 | 751 | 155.9 |
| B | 14 | 167 | 237604 | 1597.4 | 770 | 752 | 148.3 |
| B | 5 | 184 | 66766 | 445.22 | 770 | 752 | 148.3 |
| B | 15 | 204 | 49006 | 325.44 | 770 | 752 | 148.3 |
| C | 9 | 247 | 13474 | 74.44 | 735 | 740 | 171.1 |
| C | 9 | 16 | 6181 | 31.81 | 735 | 740 | 171.1 |
| C | 13 | 61 | 6151 | 31.63 | 735 | 740 | 171.1 |
| D | 2 | 63 | 506025 | 2870.57 | 726 | 705 | 176.0 |
| D | 1 | 31 | 252100 | 1428.1 | 726 | 705 | 176.0 |
| D | 13 | 112 | 124439 | 702.9 | 726 | 705 | 176.0 |
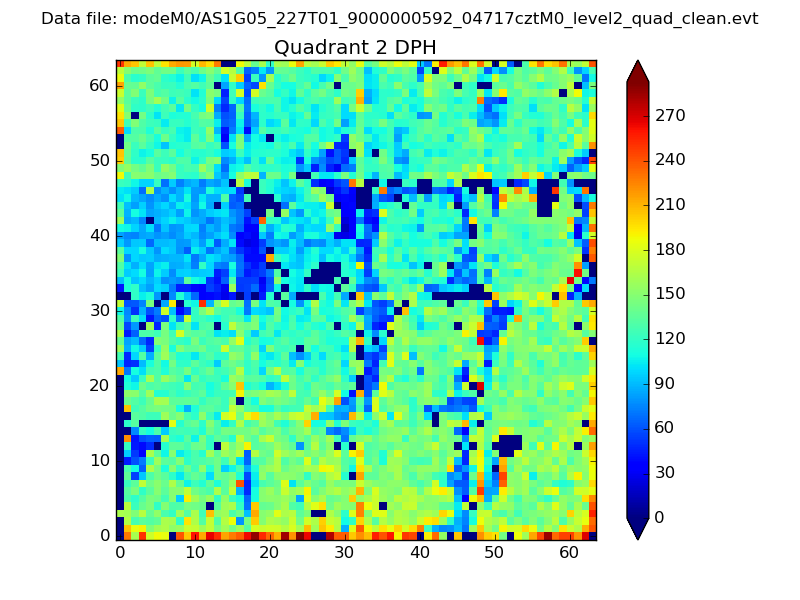
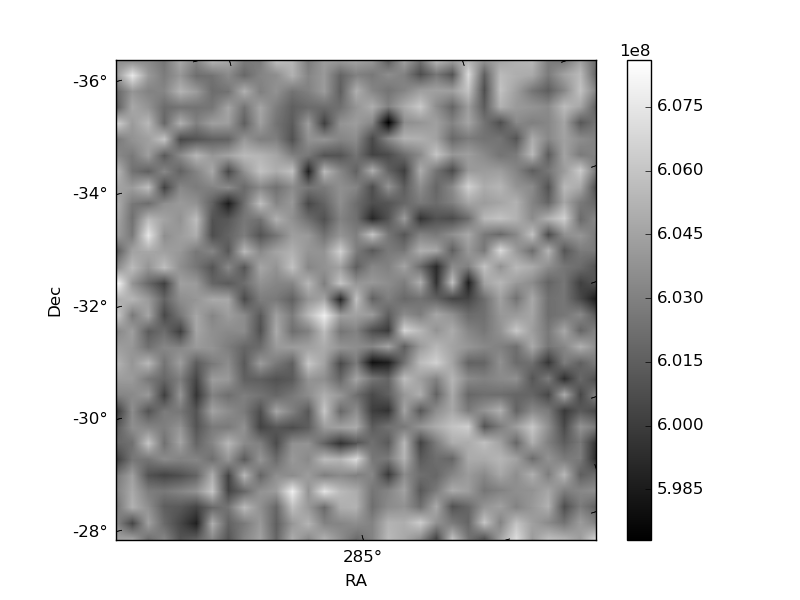
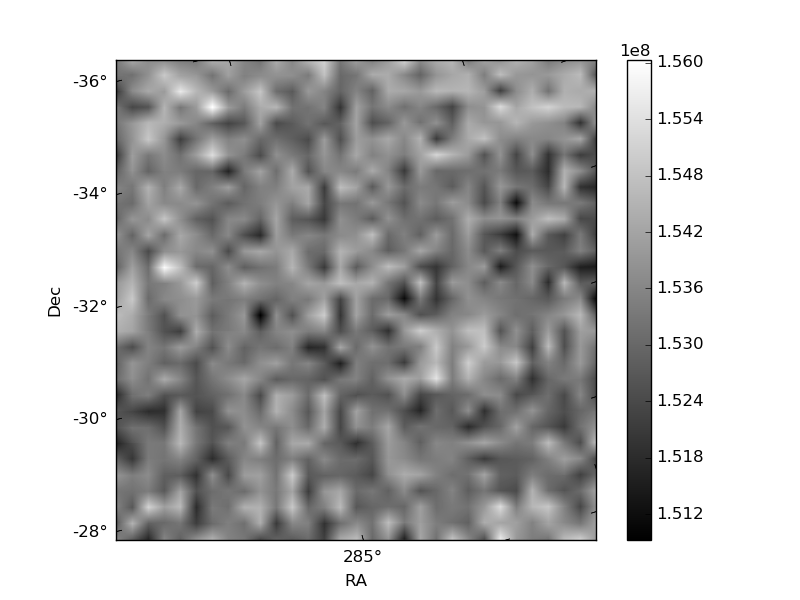
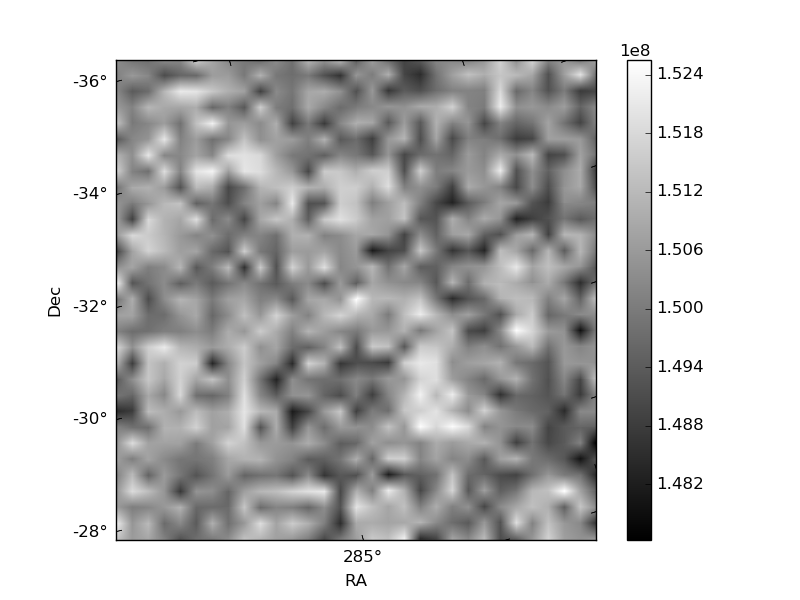
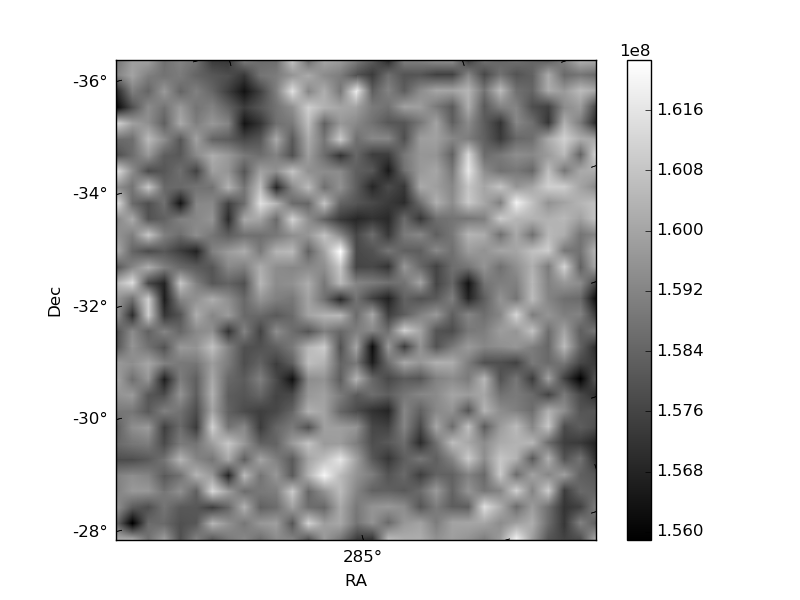
Histogram calculated using DETX and DETY for each event in the final _common_clean file
| Quadrant A | 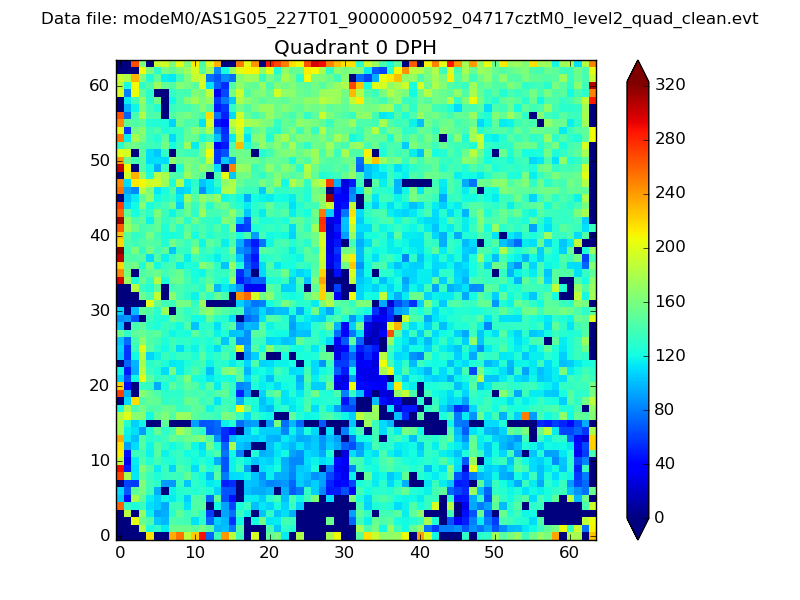 |
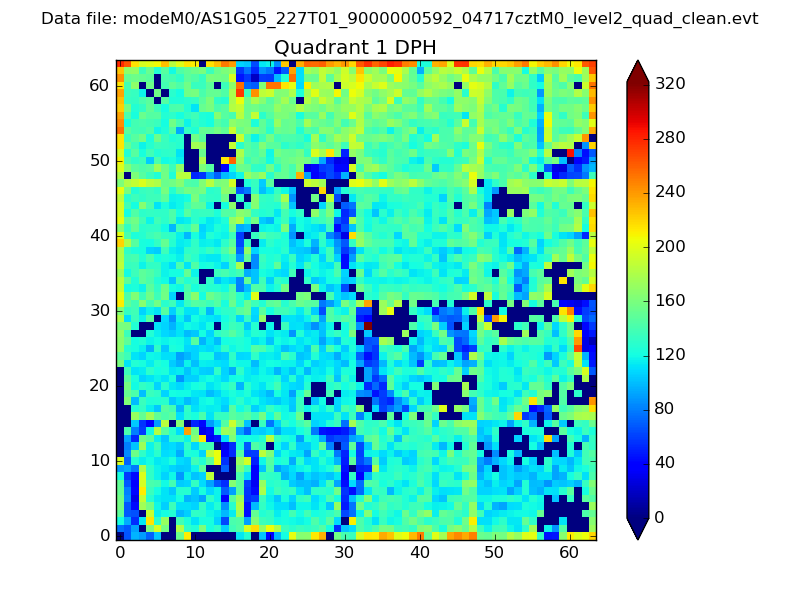 |
Quadrant B |
|---|---|---|---|
| Quadrant D | 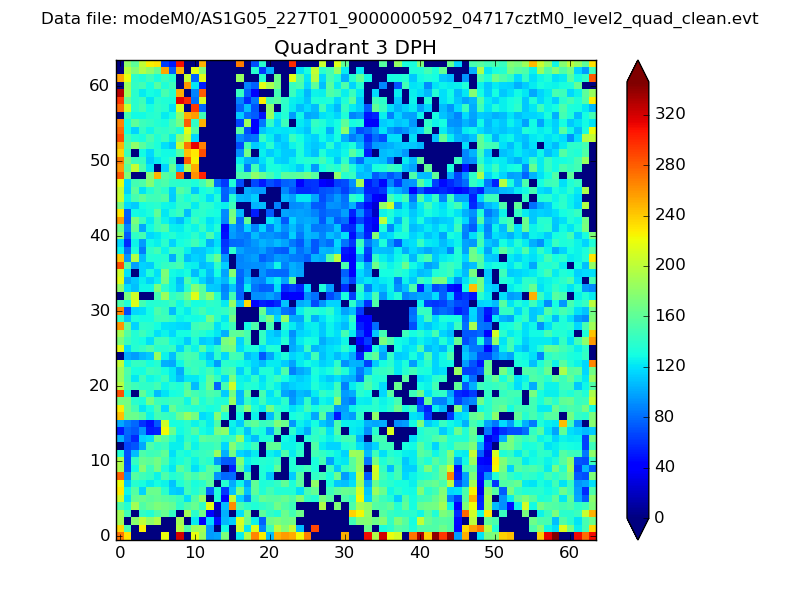 |
 |
Quadrant C |
| Plot type | Count rate plots | Images |
|---|---|---|
| Comparison with Poisson distribution Blue bars denote a histogram of data divided into 1 sec bins. Red curve is a Poisson curve with rate = median count rate of data. |
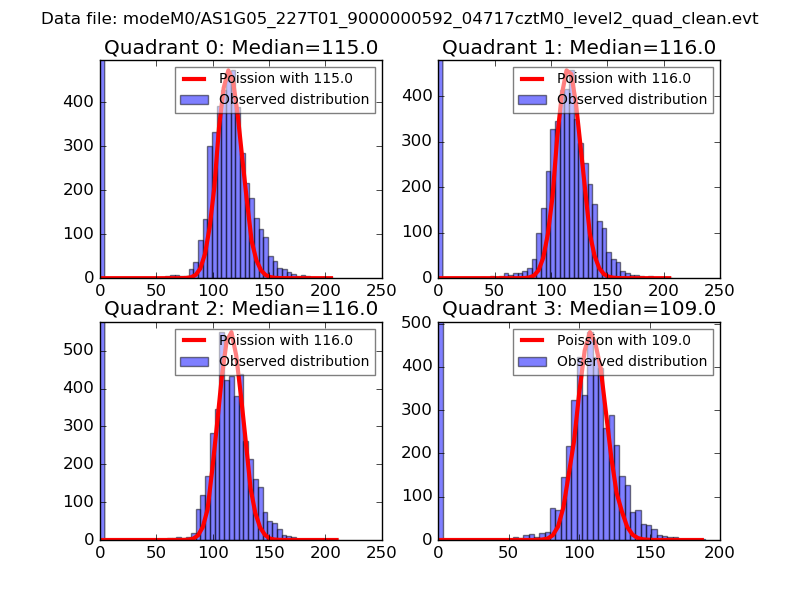 |
 |
| Quadrant-wise count rates Data is divided into 100 sec bins |
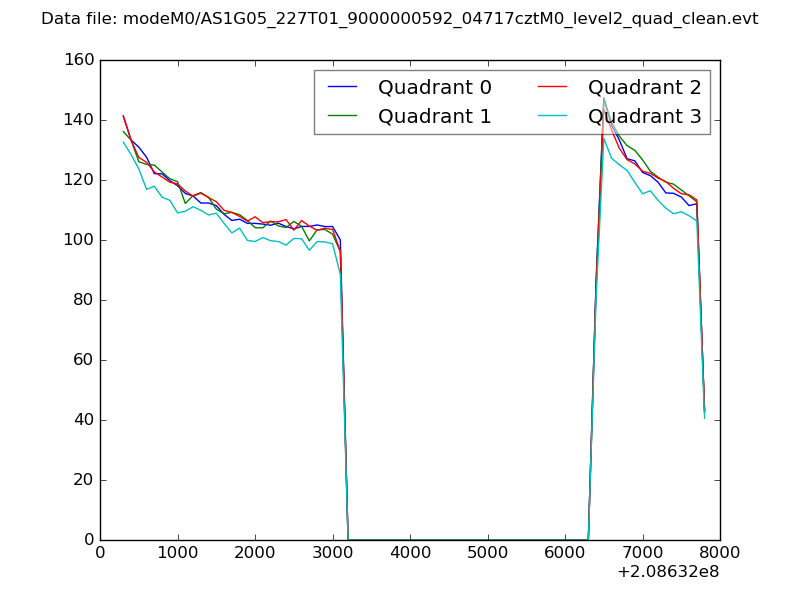 |
|
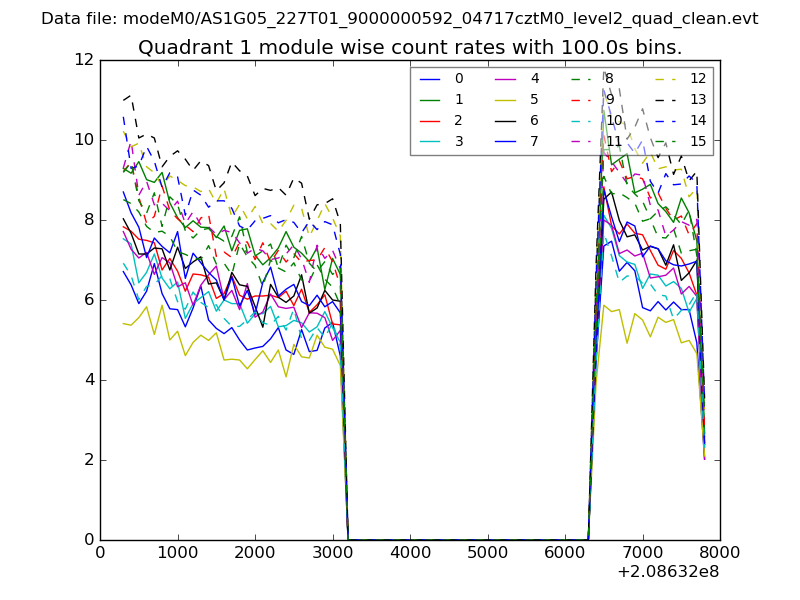
| Module-wise count rates for Quadrant A Data is divided into 100 sec bins |
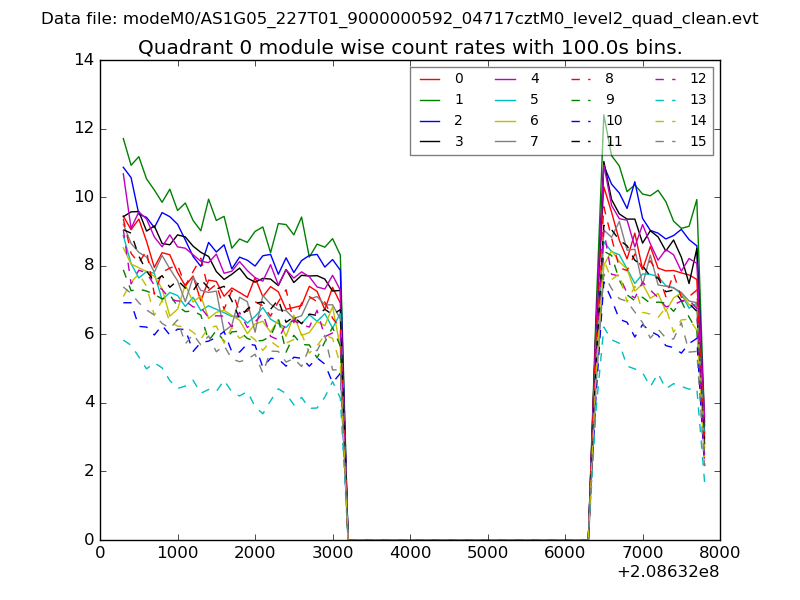 |
 |
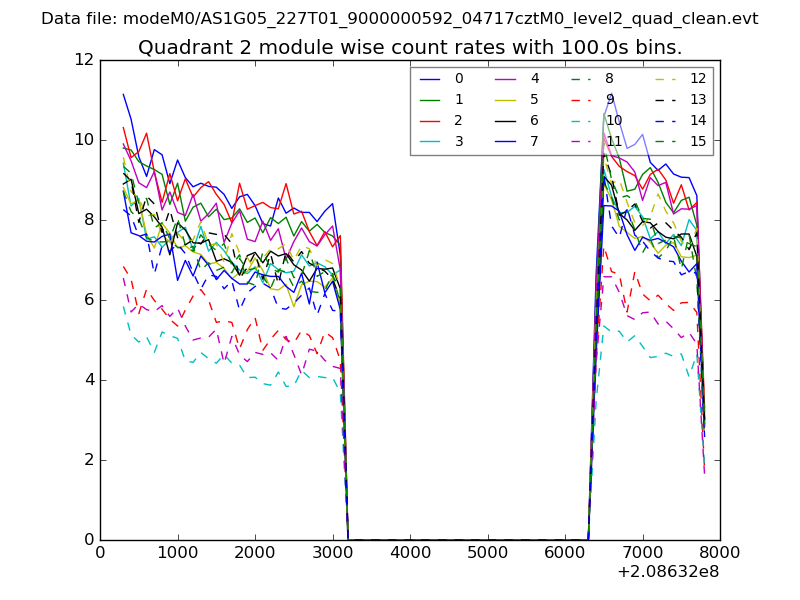
| Module-wise count rates for Quadrant B Data is divided into 100 sec bins |
 |
 |
| Module-wise count rates for Quadrant C Data is divided into 100 sec bins |
 |
 |
| Module-wise count rates for Quadrant D Data is divided into 100 sec bins |
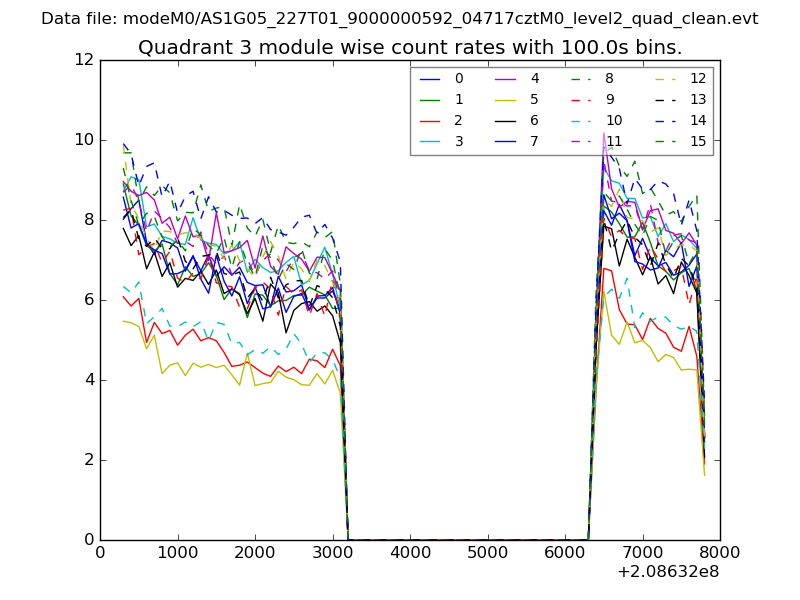 |
 |
| Parameter | Plot |
|---|---|
| CZT HV Monitor | 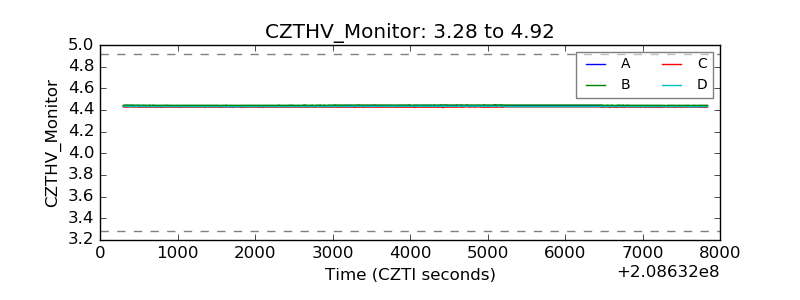 |
| D_VDD | 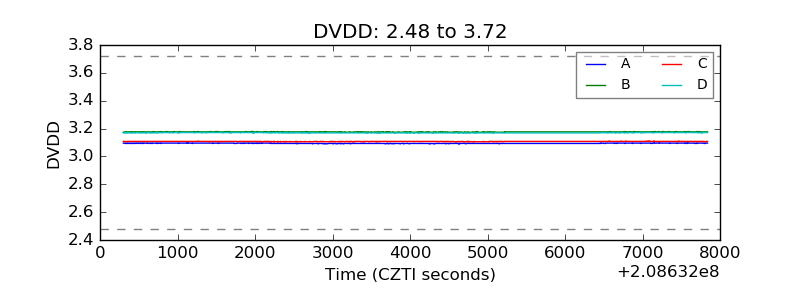 |
| Temperature 1 | 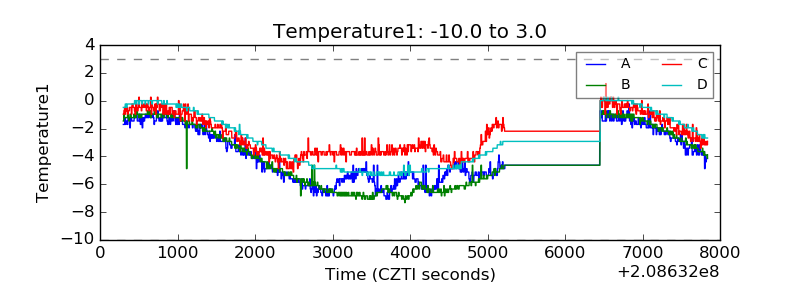 |
| Veto HV Monitor | 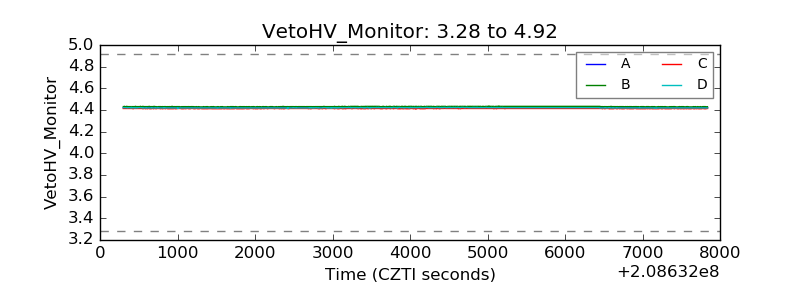 |
| Veto LLD | 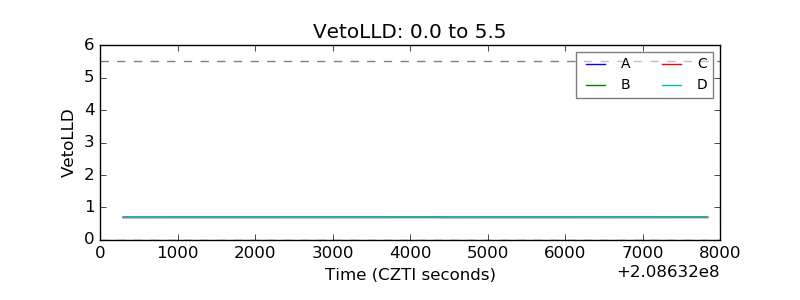 |
| Alpha Counter | 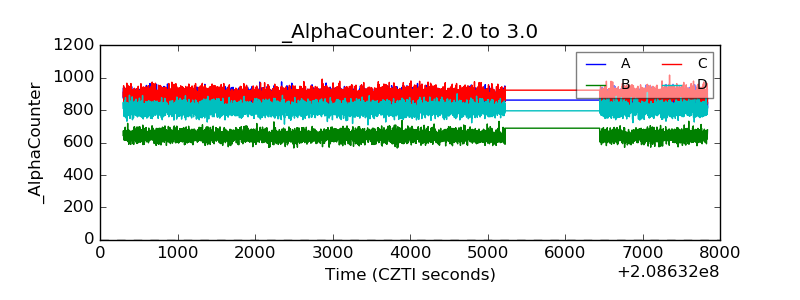 |
| _CPM_Rate | 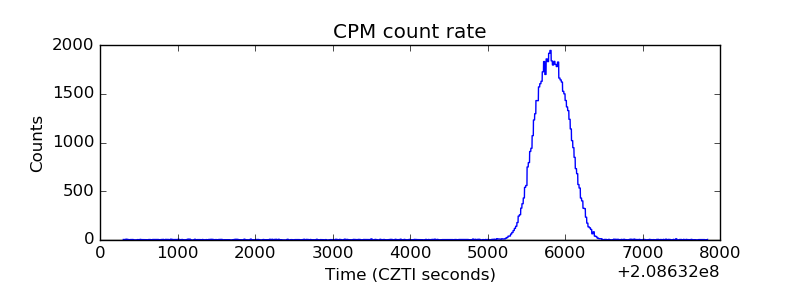 |
| CZT Counter | 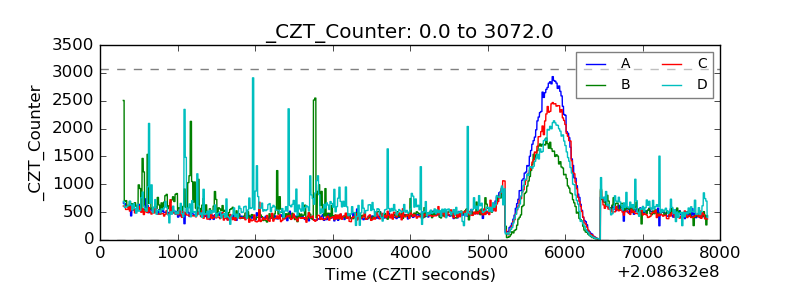 |
| +2.5 Volts monitor |  |
| +5 Volts monitor |  |
| _ROLL_ROT | 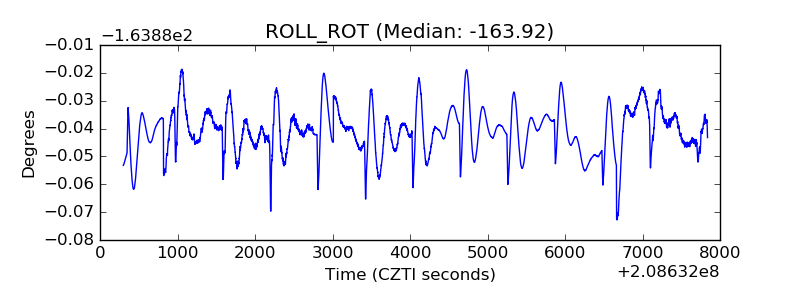 |
| _Roll_DEC | 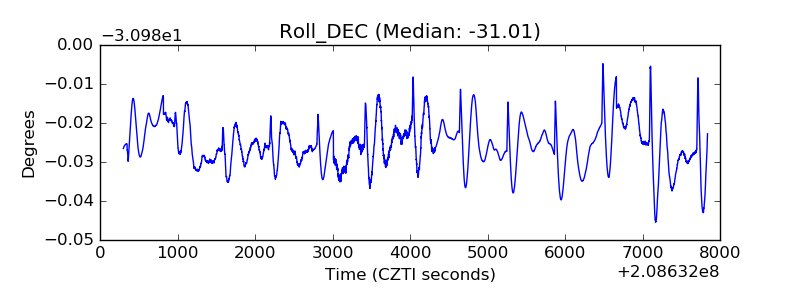 |
| _Roll_RA | 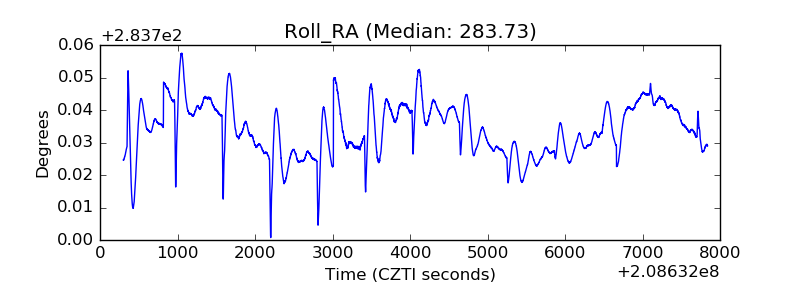 |
| Veto Counter | 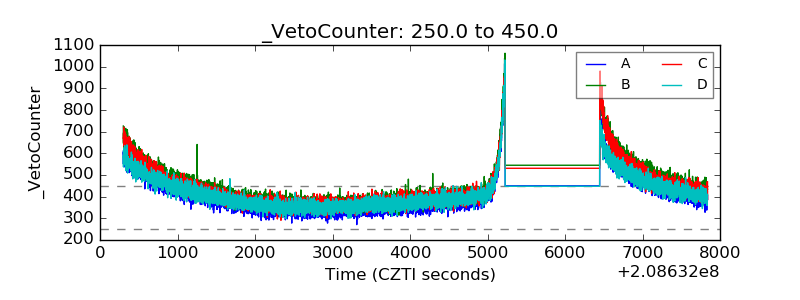 |