| Param | Original file | Final file |
|---|---|---|
| Filename | modeM0/AS1G05_227T01_9000000592_04721cztM0_level2.evt | modeM0/AS1G05_227T01_9000000592_04721cztM0_level2_quad_clean.evt |
| Size (bytes) | 525,487,680 | 74,329,920 |
| Size | 501.1 MB | 70.9 MB |
| Events in quadrant A | 3,161,956 | 449,476 |
| Events in quadrant B | 3,708,445 | 453,471 |
| Events in quadrant C | 2,980,615 | 462,021 |
| Events in quadrant D | 5,602,254 | 411,969 |
| Mode M0 | |||
|---|---|---|---|
| Quadrant | BADHDUFLAG | Total packets | Discarded packets |
| A | 0 | 14362 | 3 |
| B | 0 | 15703 | 2 |
| C | 0 | 13846 | 2 |
| D | 0 | 21233 | 2 |
| Mode M9 | |||
|---|---|---|---|
| Quadrant | BADHDUFLAG | Total packets | Discarded packets |
| A | 0 | 19 | 0 |
| B | 0 | 19 | 0 |
| C | 0 | 19 | 0 |
| D | 0 | 19 | 0 |
| Mode SS | |||
|---|---|---|---|
| Quadrant | BADHDUFLAG | Total packets | Discarded packets |
| A | 0 | 138 | 0 |
| B | 0 | 138 | 0 |
| C | 0 | 138 | 0 |
| D | 0 | 139 | 1 |
| Quadrant | Total seconds | Saturated seconds | Saturation percentage |
|---|---|---|---|
| A | 6794 | 96 | 1.413011% |
| B | 6794 | 82 | 1.206947% |
| C | 6794 | 24 | 0.353253% |
| D | 6794 | 756 | 11.127465% |
Noise dominated data is calculated using 1-second bins in cleaned event files. If a bin has >2000 counts, and if more than 50% of those come from <1% of pixels, then it is considered to be noise-dominated and hence unusable.
| Quadrant | # 1 sec bins | Bins with >0 counts | Bins with >2000 counts | High rate bins dominated by noise | Noise dominated (total time) | Noise dominated (detector-on time) | Marked lightcurve |
|---|---|---|---|---|---|---|---|
| A | 7610 | 6796 | 38 | 38 | 0.50% | 0.56% | 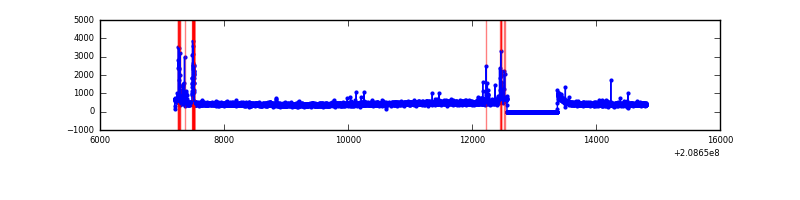 |
| B | 7610 | 6796 | 20 | 20 | 0.26% | 0.29% | 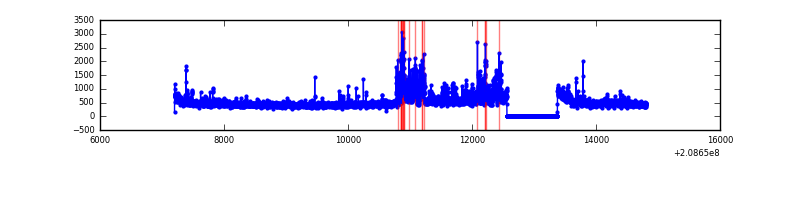 |
| C | 7610 | 6796 | 0 | 0 | 0.00% | 0.00% | 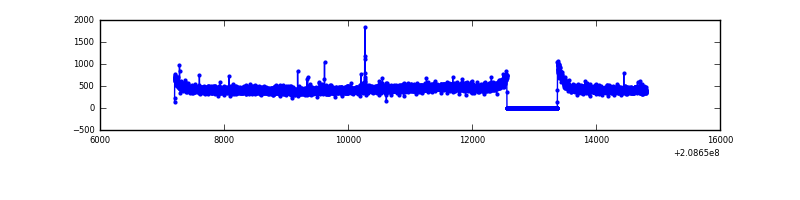 |
| D | 7610 | 6796 | 540 | 540 | 7.10% | 7.95% | 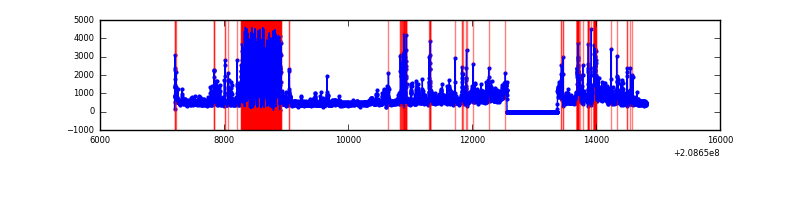 |
Top three noisy pixels from each quadrant. If the there are fewer than three noisy pixels in the level2.evt file, extra rows are filled as -1
| Pixel properties | Quadrant properties | ||||||
|---|---|---|---|---|---|---|---|
| Quadrant | DetID | PixID | Counts | Sigma | Mean | Median | Sigma |
| A | 0 | 118 | 156705 | 986.13 | 768 | 751 | 158.1 |
| A | 0 | 226 | 22498 | 137.51 | 768 | 751 | 158.1 |
| A | 15 | 254 | 16283 | 98.21 | 768 | 751 | 158.1 |
| B | 14 | 167 | 408502 | 2699.29 | 788 | 769 | 151.1 |
| B | 15 | 204 | 158329 | 1043.09 | 788 | 769 | 151.1 |
| B | 10 | 16 | 31055 | 200.5 | 788 | 769 | 151.1 |
| C | 9 | 247 | 13917 | 74.47 | 757 | 761 | 176.7 |
| C | 13 | 61 | 6320 | 31.47 | 757 | 761 | 176.7 |
| C | 8 | 128 | 5899 | 29.09 | 757 | 761 | 176.7 |
| D | 13 | 235 | 1677284 | 9691.51 | 707 | 683 | 173.0 |
| D | 2 | 63 | 739660 | 4271.62 | 707 | 683 | 173.0 |
| D | 2 | 136 | 171613 | 988.05 | 707 | 683 | 173.0 |
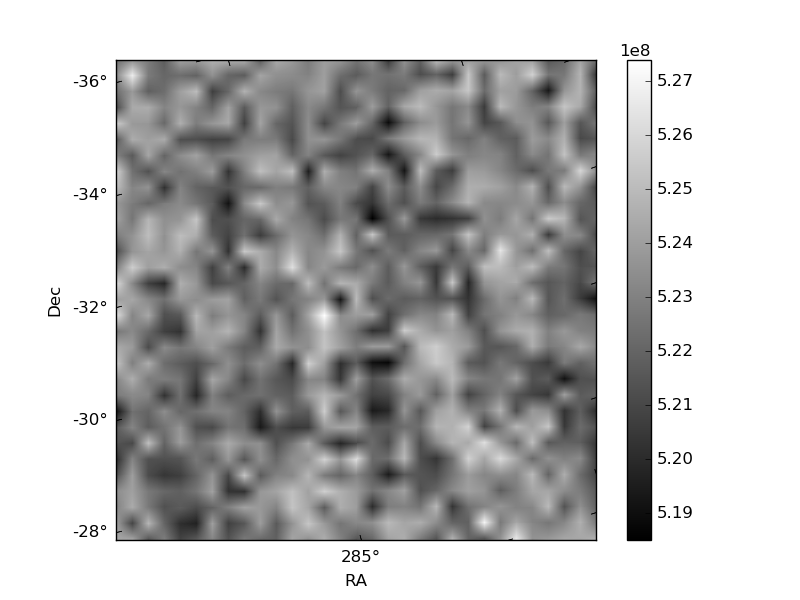
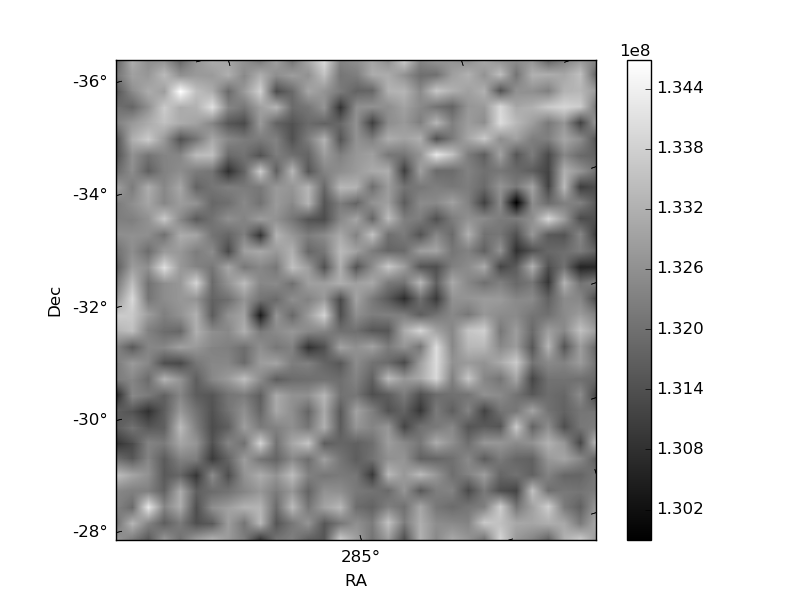
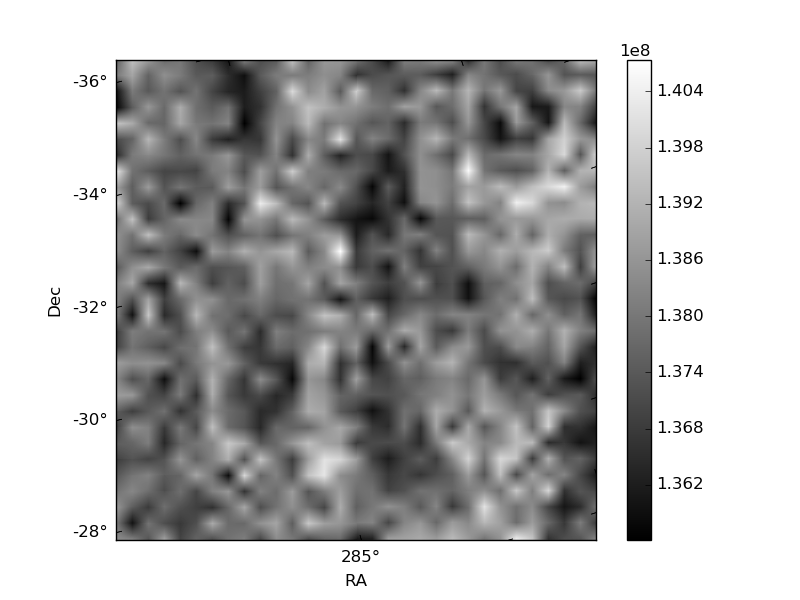
Histogram calculated using DETX and DETY for each event in the final _common_clean file
| Quadrant A | 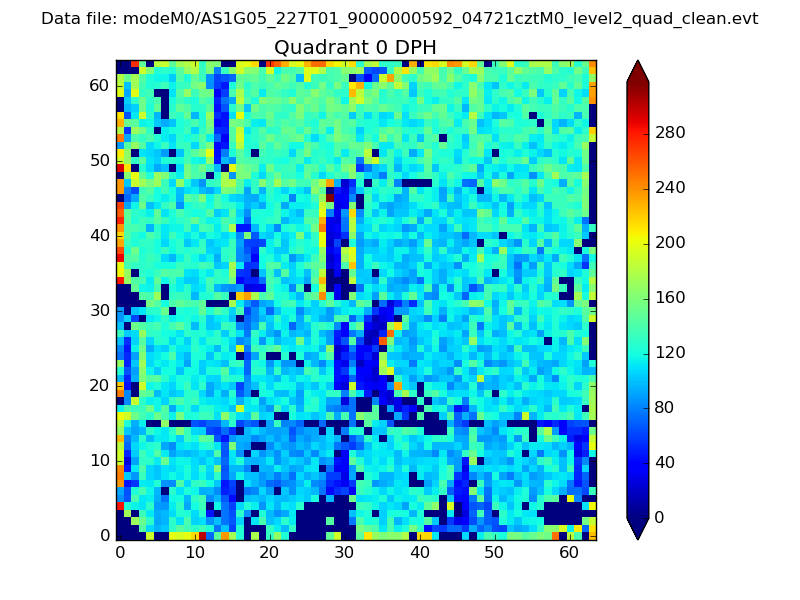 |
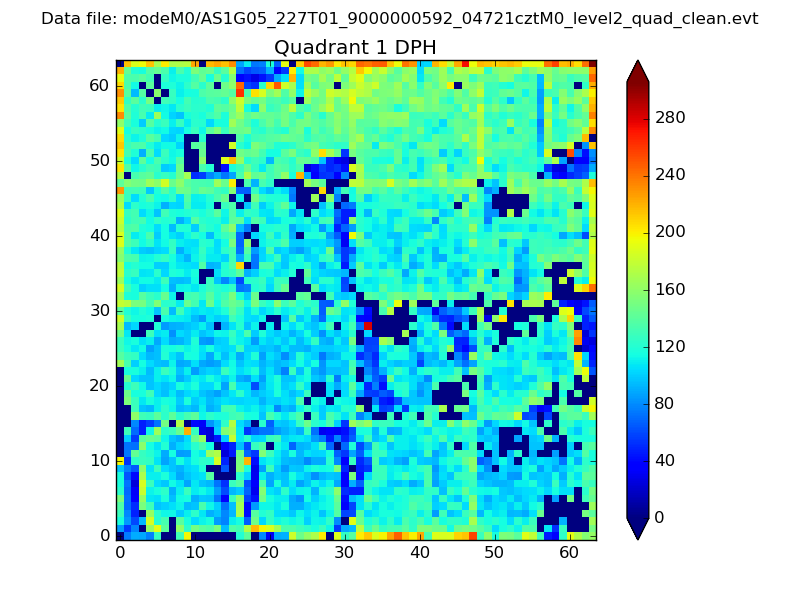 |
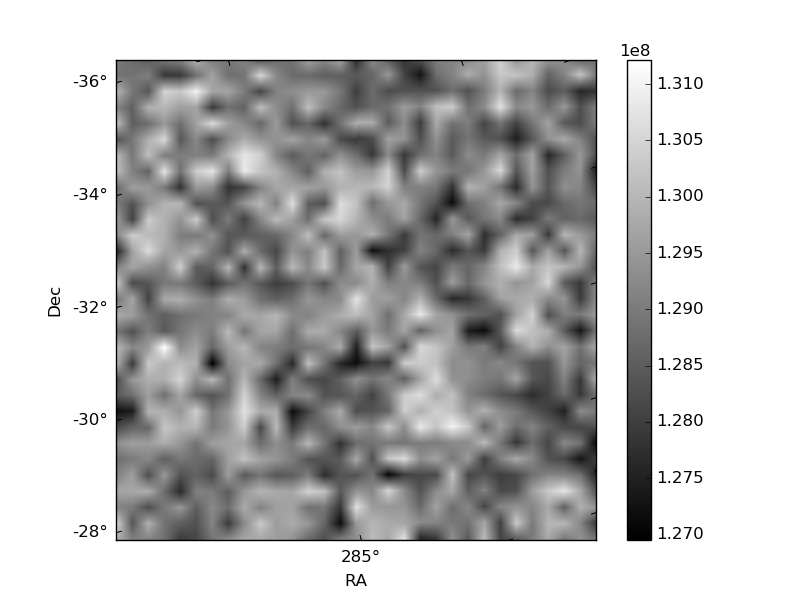
Quadrant B |
|---|---|---|---|
| Quadrant D | 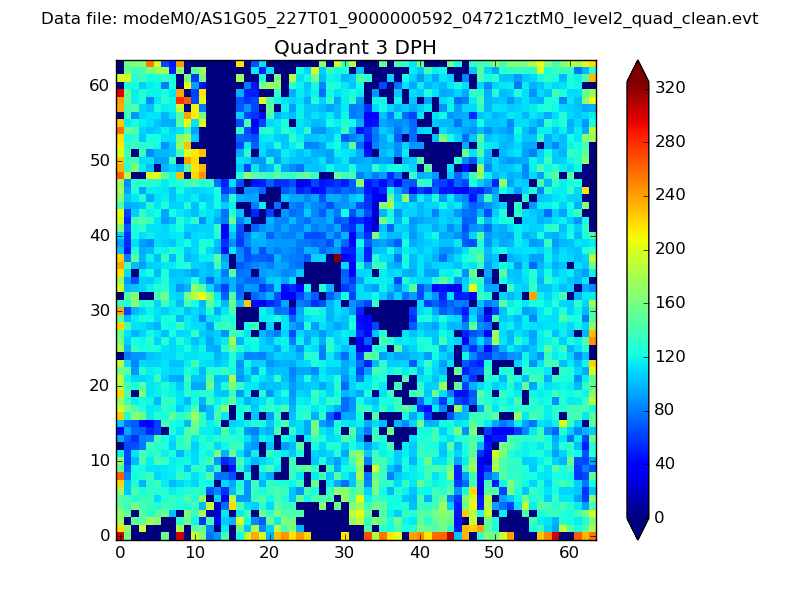 |
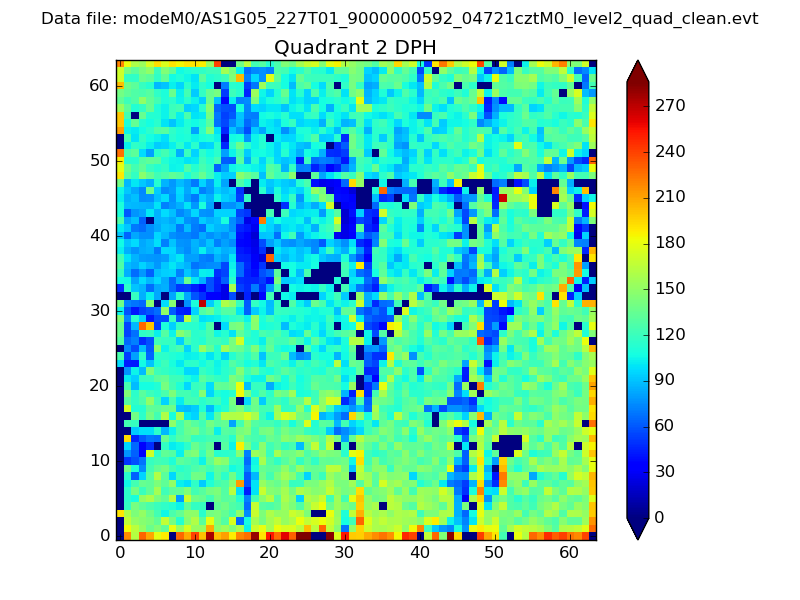 |
Quadrant C |
| Plot type | Count rate plots | Images |
|---|---|---|
| Comparison with Poisson distribution Blue bars denote a histogram of data divided into 1 sec bins. Red curve is a Poisson curve with rate = median count rate of data. |
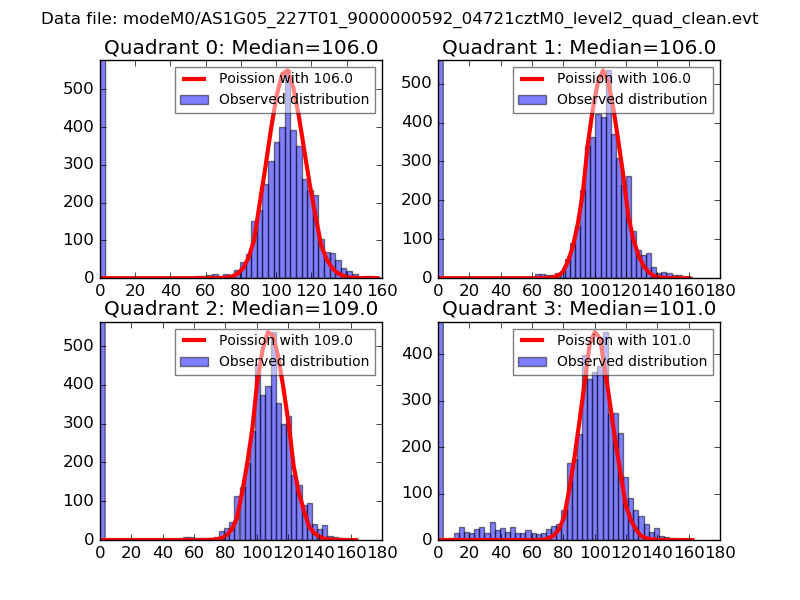 |
 |
| Quadrant-wise count rates Data is divided into 100 sec bins |
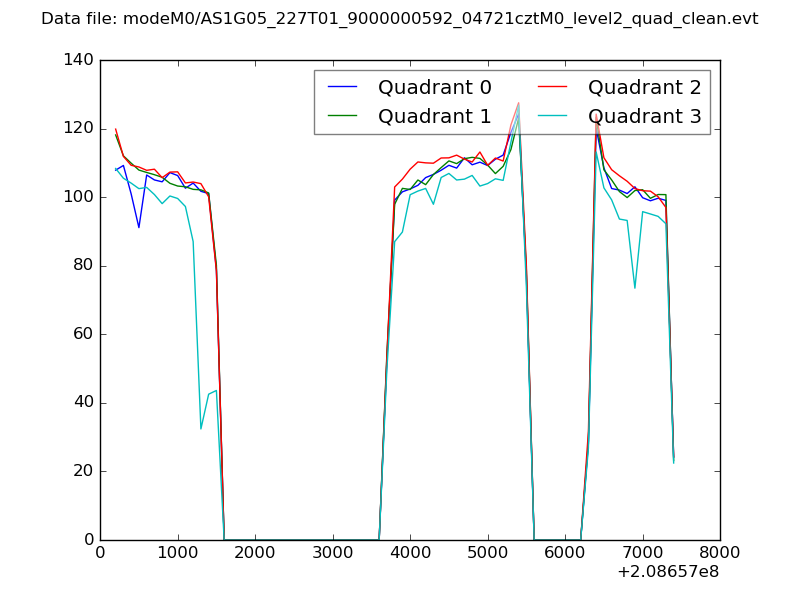 |
|
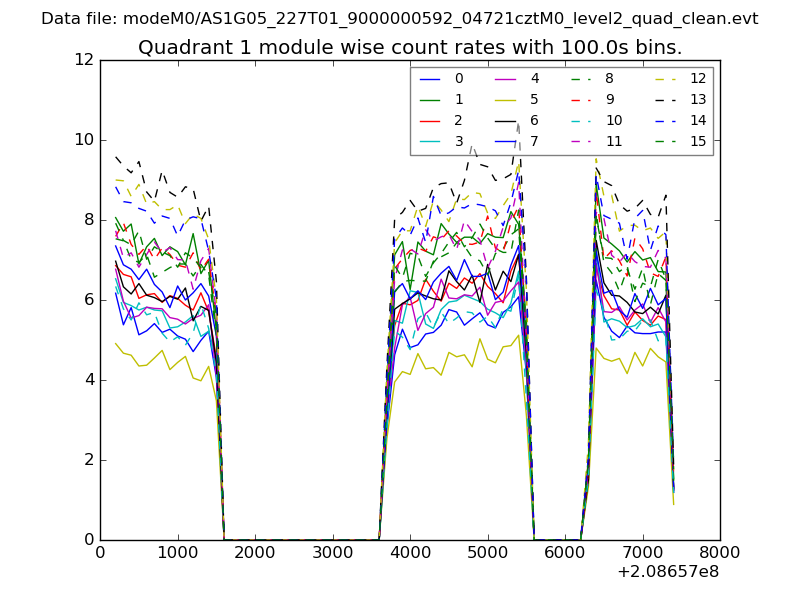
| Module-wise count rates for Quadrant A Data is divided into 100 sec bins |
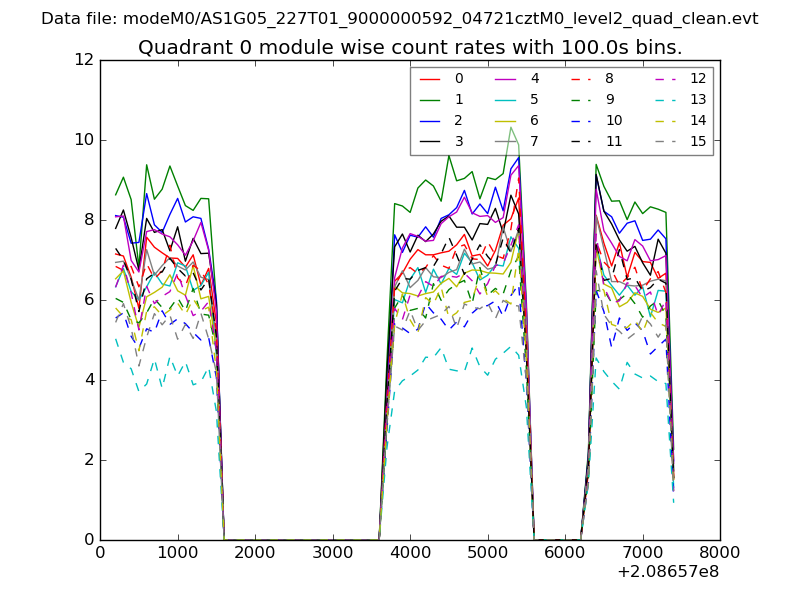 |
 |
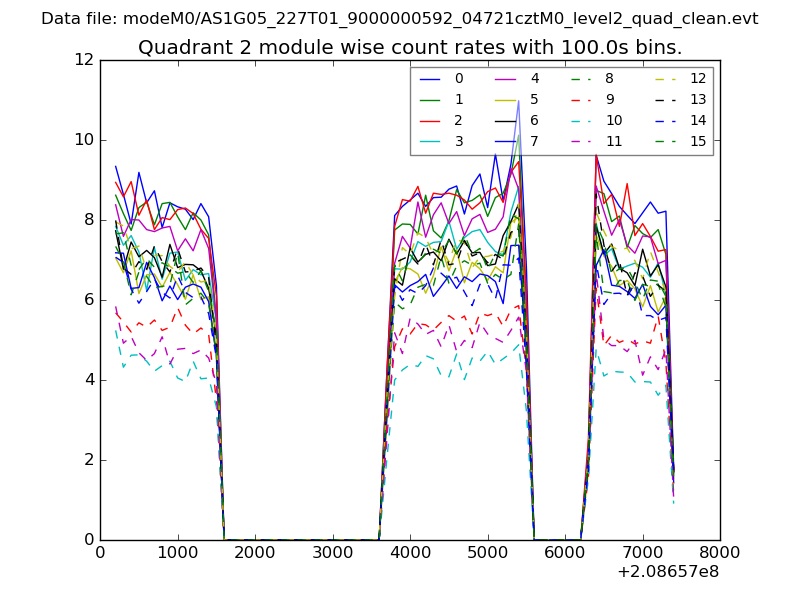
| Module-wise count rates for Quadrant B Data is divided into 100 sec bins |
 |
 |
| Module-wise count rates for Quadrant C Data is divided into 100 sec bins |
 |
 |
| Module-wise count rates for Quadrant D Data is divided into 100 sec bins |
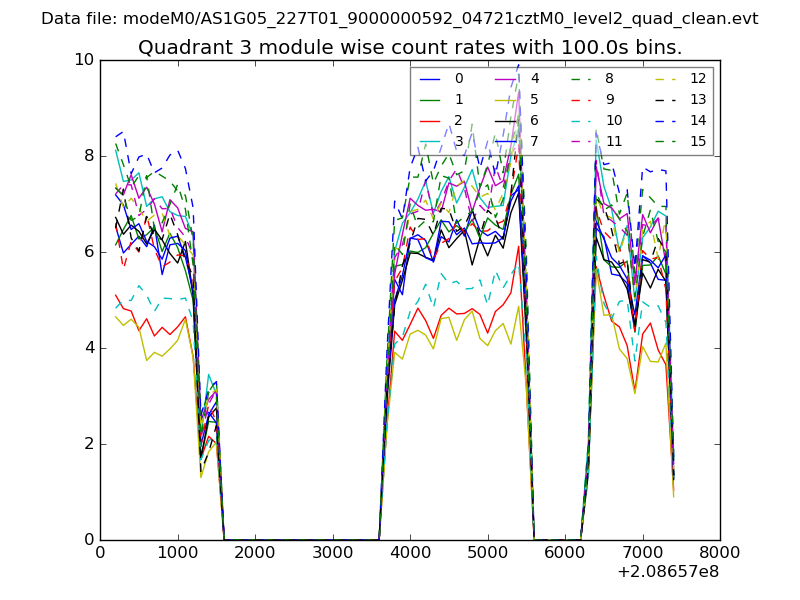 |
 |
| Parameter | Plot |
|---|---|
| CZT HV Monitor | 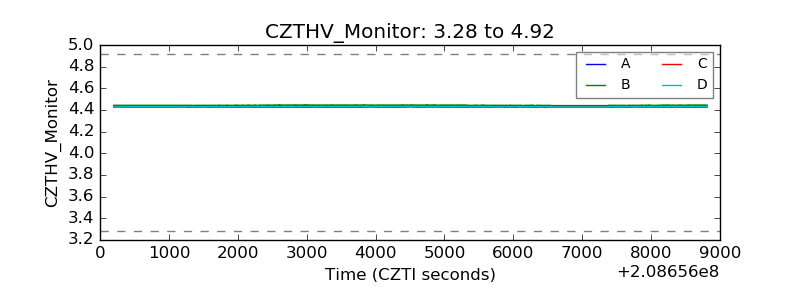 |
| D_VDD | 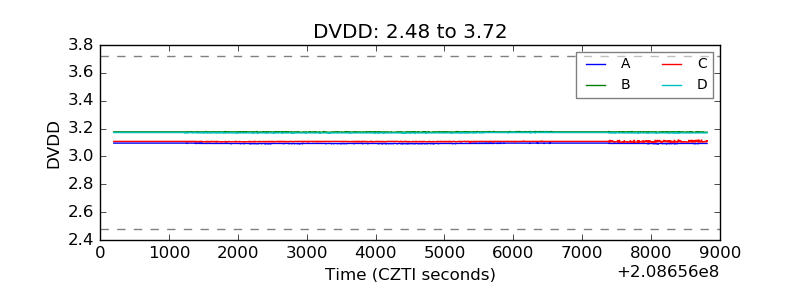 |
| Temperature 1 | 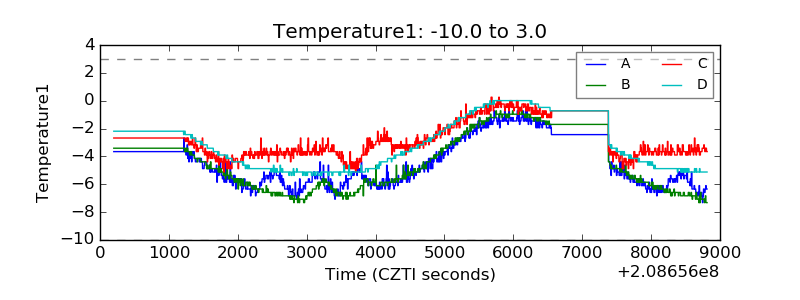 |
| Veto HV Monitor | 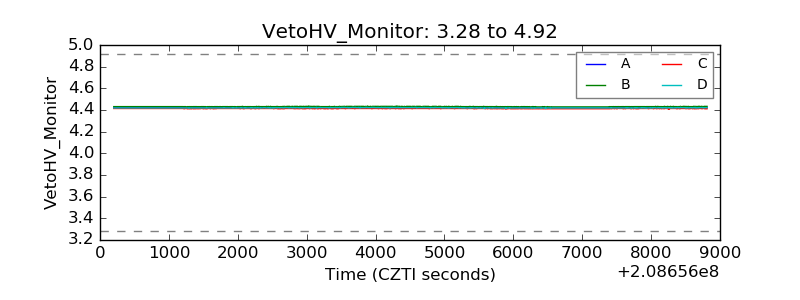 |
| Veto LLD | 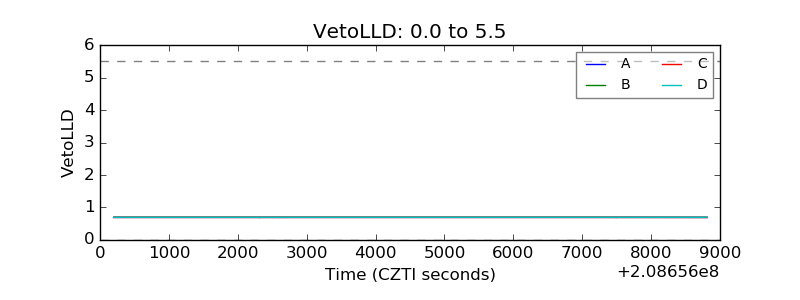 |
| Alpha Counter | 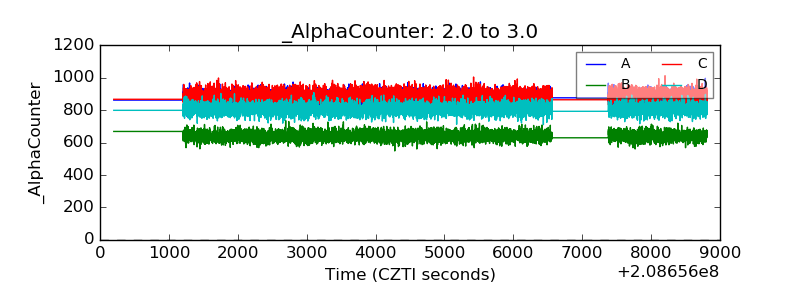 |
| _CPM_Rate | 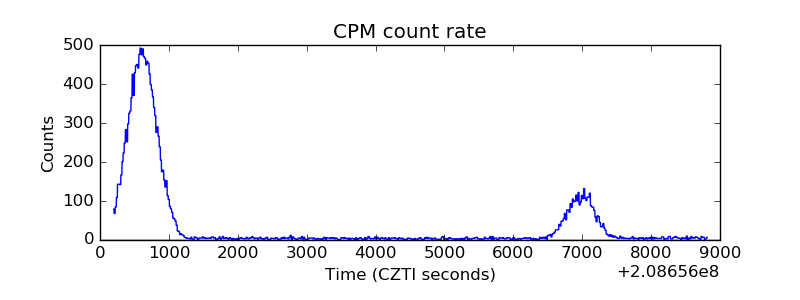 |
| CZT Counter | 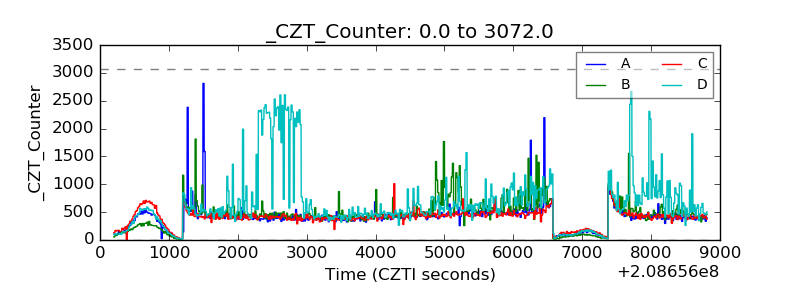 |
| +2.5 Volts monitor |  |
| +5 Volts monitor |  |
| _ROLL_ROT | 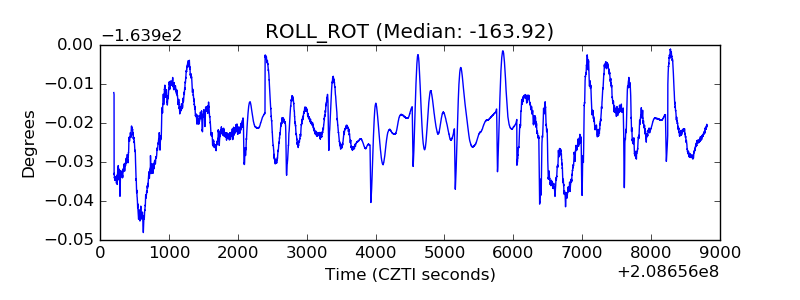 |
| _Roll_DEC | 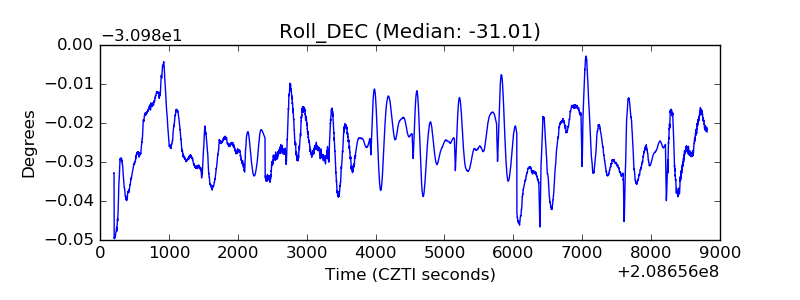 |
| _Roll_RA | 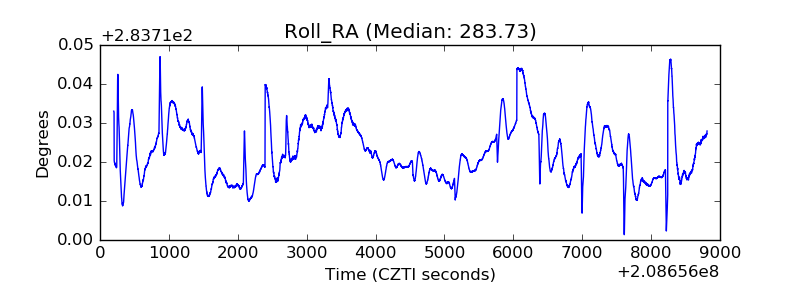 |
| Veto Counter | 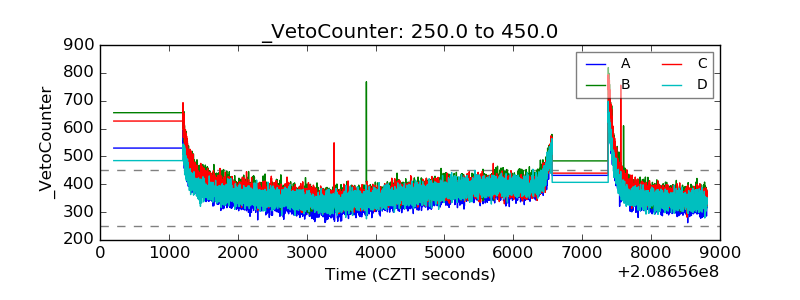 |