| Param | Original file | Final file |
|---|---|---|
| Filename | modeM0/AS1G05_227T01_9000000592_04722cztM0_level2.evt | modeM0/AS1G05_227T01_9000000592_04722cztM0_level2_quad_clean.evt |
| Size (bytes) | 540,521,280 | 75,885,120 |
| Size | 515.5 MB | 72.4 MB |
| Events in quadrant A | 3,390,213 | 445,506 |
| Events in quadrant B | 3,906,978 | 448,278 |
| Events in quadrant C | 3,313,855 | 456,987 |
| Events in quadrant D | 5,248,417 | 423,572 |
| Mode M0 | |||
|---|---|---|---|
| Quadrant | BADHDUFLAG | Total packets | Discarded packets |
| A | 0 | 15588 | 3 |
| B | 0 | 16740 | 2 |
| C | 0 | 15390 | 2 |
| D | 0 | 21038 | 2 |
| Mode M9 | |||
|---|---|---|---|
| Quadrant | BADHDUFLAG | Total packets | Discarded packets |
| A | 0 | 6 | 0 |
| B | 0 | 6 | 0 |
| C | 0 | 6 | 0 |
| D | 0 | 7 | 0 |
| Mode SS | |||
|---|---|---|---|
| Quadrant | BADHDUFLAG | Total packets | Discarded packets |
| A | 0 | 152 | 0 |
| B | 0 | 152 | 0 |
| C | 0 | 152 | 0 |
| D | 0 | 152 | 0 |
| Quadrant | Total seconds | Saturated seconds | Saturation percentage |
|---|---|---|---|
| A | 7522 | 47 | 0.624834% |
| B | 7522 | 64 | 0.850838% |
| C | 7522 | 37 | 0.491890% |
| D | 7522 | 175 | 2.326509% |
Noise dominated data is calculated using 1-second bins in cleaned event files. If a bin has >2000 counts, and if more than 50% of those come from <1% of pixels, then it is considered to be noise-dominated and hence unusable.
| Quadrant | # 1 sec bins | Bins with >0 counts | Bins with >2000 counts | High rate bins dominated by noise | Noise dominated (total time) | Noise dominated (detector-on time) | Marked lightcurve |
|---|---|---|---|---|---|---|---|
| A | 7982 | 7523 | 7 | 7 | 0.09% | 0.09% | 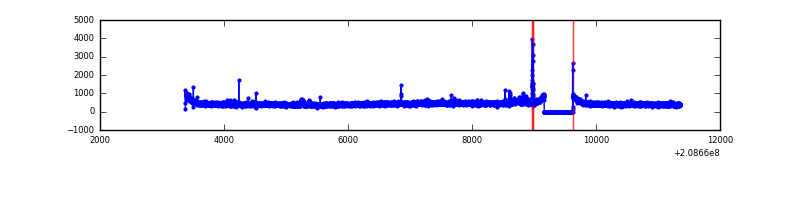 |
| B | 7982 | 7523 | 10 | 10 | 0.13% | 0.13% | 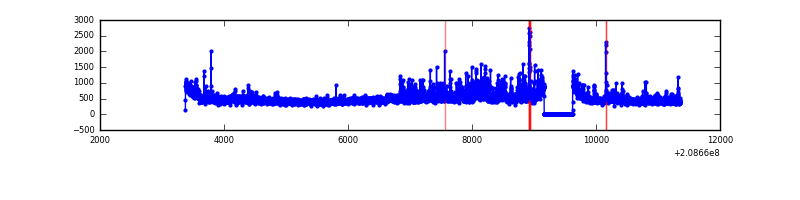 |
| C | 7982 | 7523 | 0 | 0 | 0.00% | 0.00% | 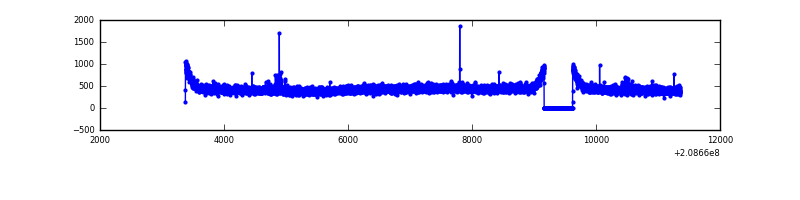 |
| D | 7982 | 7523 | 111 | 111 | 1.39% | 1.48% | 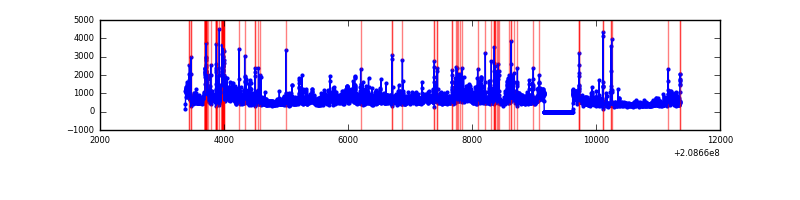 |
Top three noisy pixels from each quadrant. If the there are fewer than three noisy pixels in the level2.evt file, extra rows are filled as -1
| Pixel properties | Quadrant properties | ||||||
|---|---|---|---|---|---|---|---|
| Quadrant | DetID | PixID | Counts | Sigma | Mean | Median | Sigma |
| A | 0 | 118 | 64114 | 357.93 | 851 | 832 | 176.8 |
| A | 0 | 226 | 15007 | 80.18 | 851 | 832 | 176.8 |
| A | 5 | 158 | 14370 | 76.57 | 851 | 832 | 176.8 |
| B | 4 | 80 | 268654 | 1570.34 | 869 | 846 | 170.5 |
| B | 14 | 167 | 130711 | 761.49 | 869 | 846 | 170.5 |
| B | 15 | 204 | 60980 | 352.61 | 869 | 846 | 170.5 |
| C | 8 | 128 | 16312 | 79.27 | 835 | 840 | 195.2 |
| C | 9 | 221 | 13903 | 66.93 | 835 | 840 | 195.2 |
| C | 9 | 247 | 9360 | 43.65 | 835 | 840 | 195.2 |
| D | 2 | 63 | 1193502 | 5948.03 | 819 | 794 | 200.5 |
| D | 13 | 235 | 328889 | 1636.21 | 819 | 794 | 200.5 |
| D | 1 | 31 | 190435 | 945.74 | 819 | 794 | 200.5 |
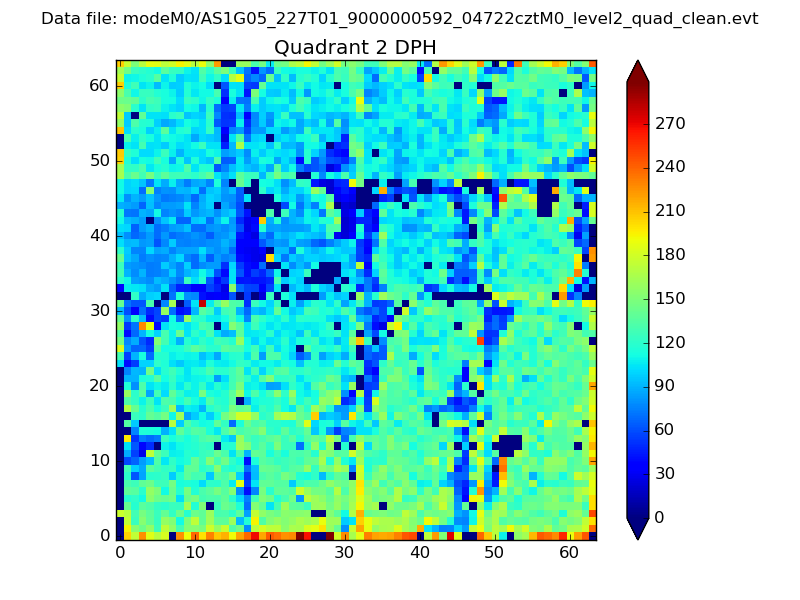
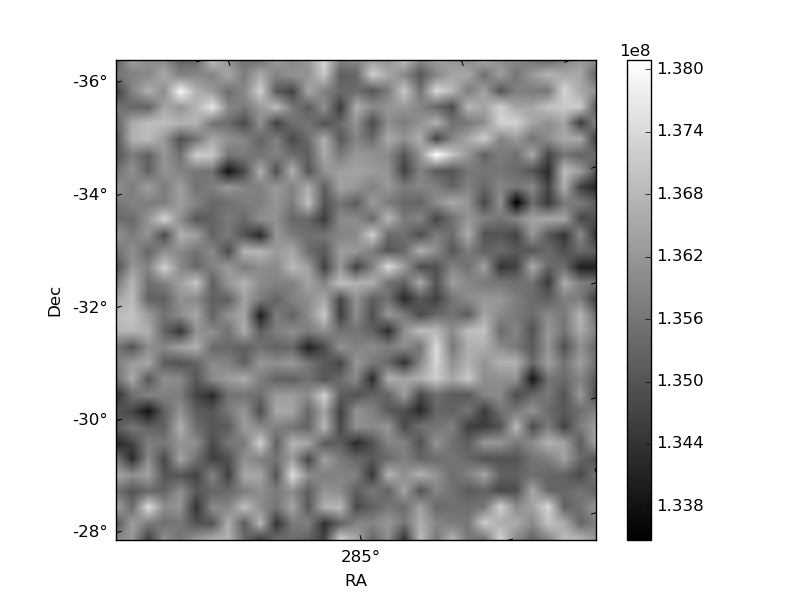
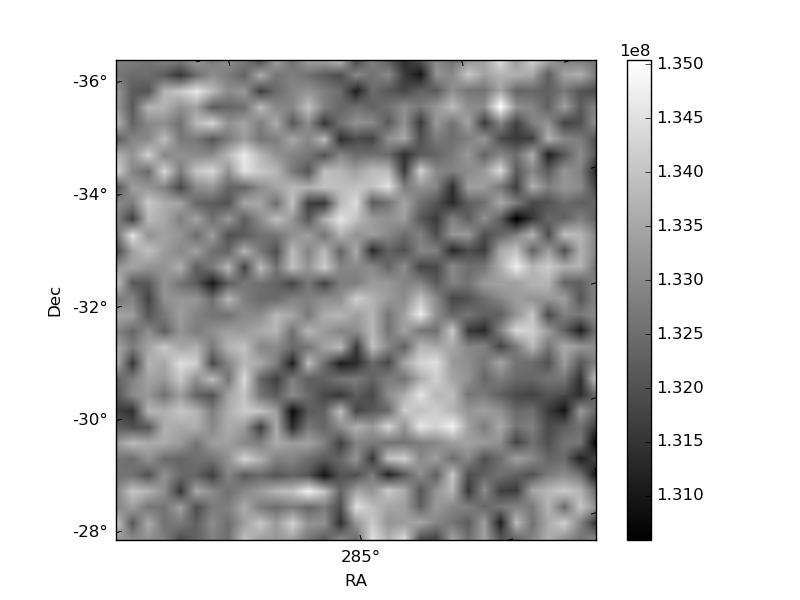
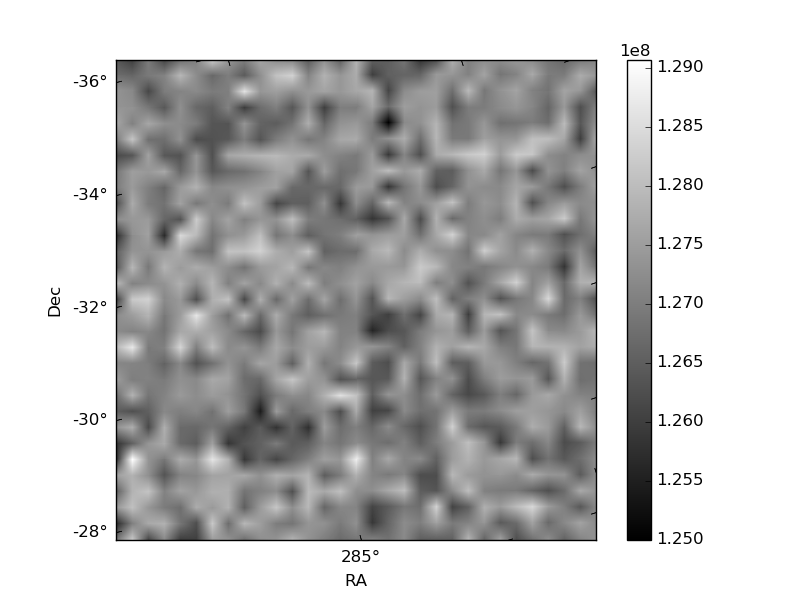
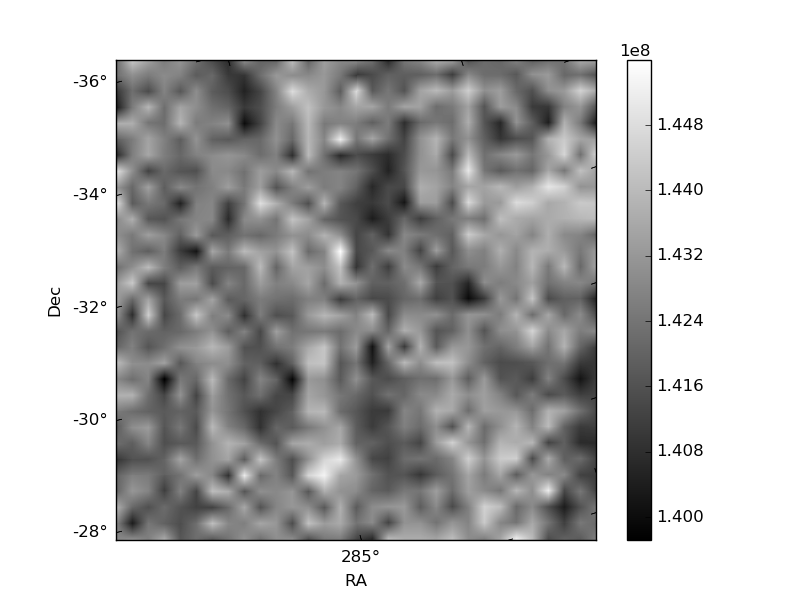
Histogram calculated using DETX and DETY for each event in the final _common_clean file
| Quadrant A | 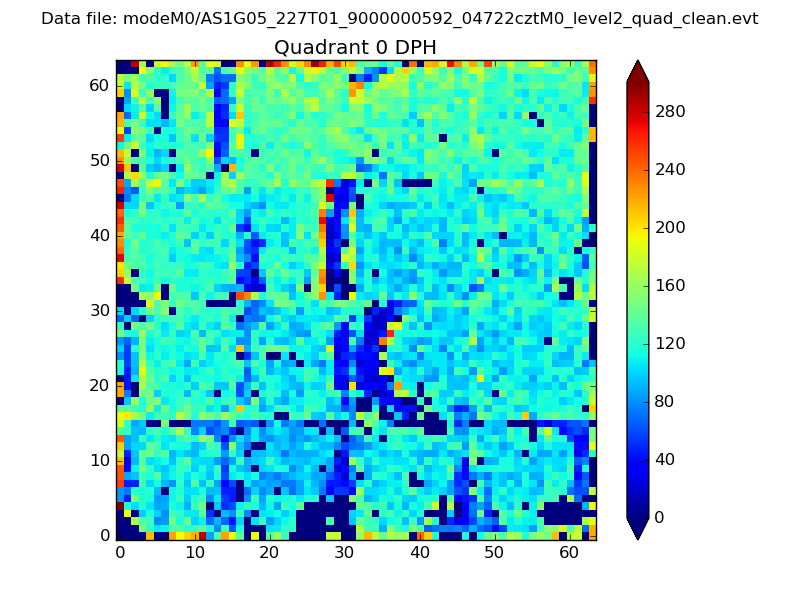 |
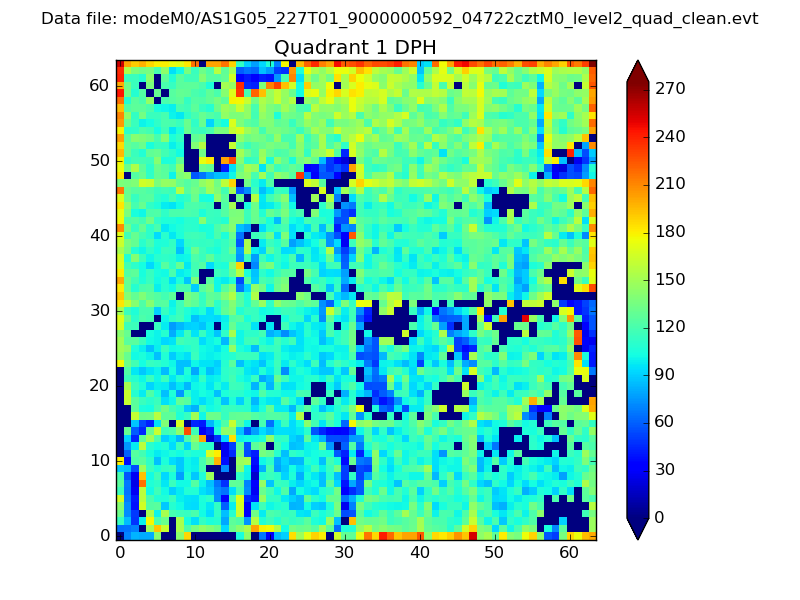 |
Quadrant B |
|---|---|---|---|
| Quadrant D | 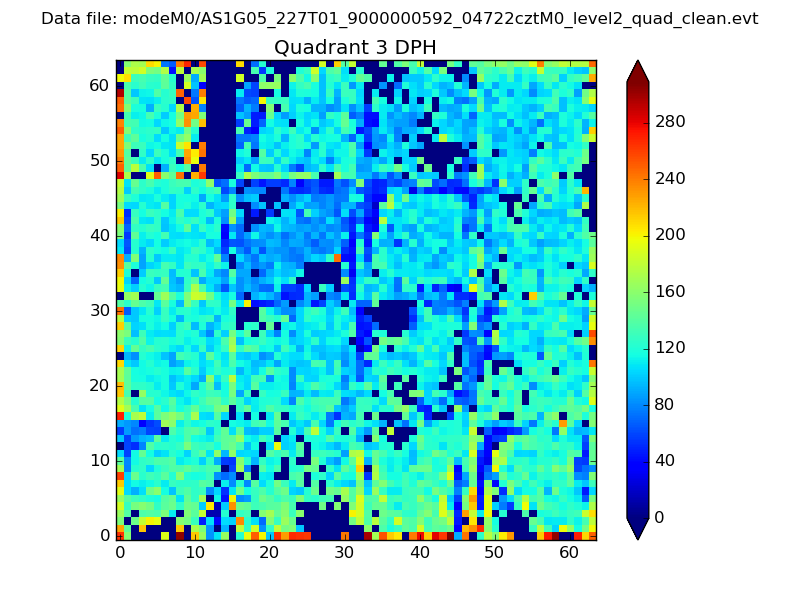 |
 |
Quadrant C |
| Plot type | Count rate plots | Images |
|---|---|---|
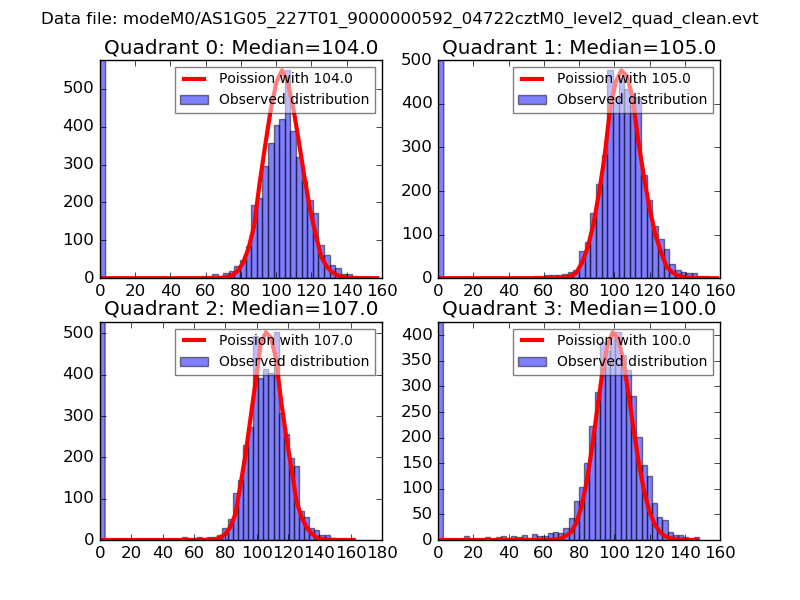
| Comparison with Poisson distribution Blue bars denote a histogram of data divided into 1 sec bins. Red curve is a Poisson curve with rate = median count rate of data. |
 |
 |
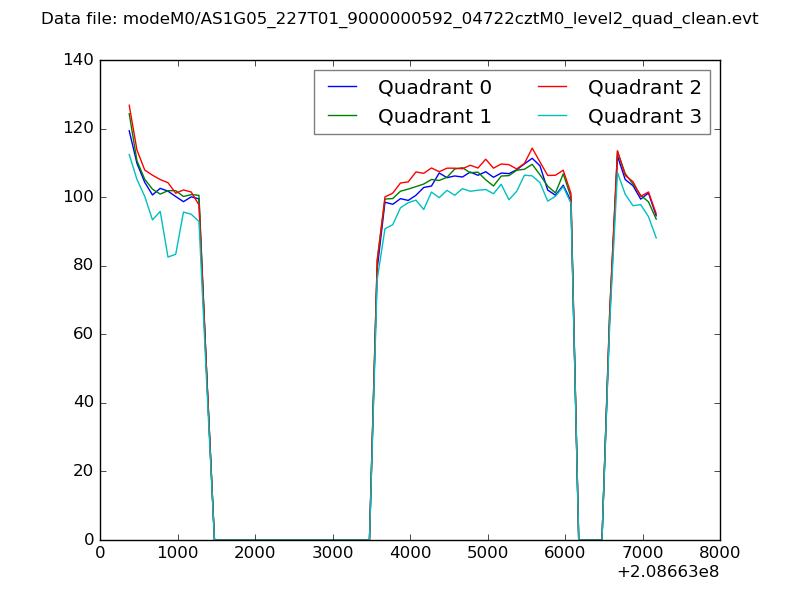
| Quadrant-wise count rates Data is divided into 100 sec bins |
 |
|
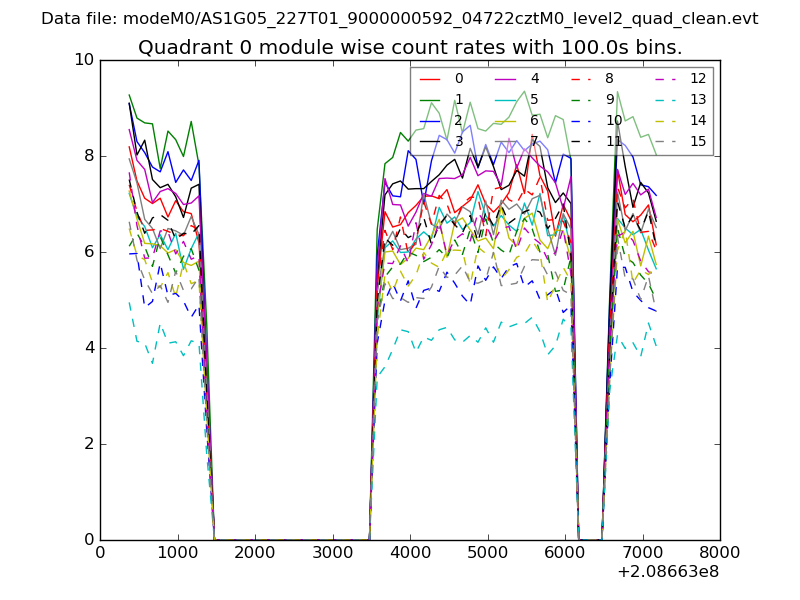
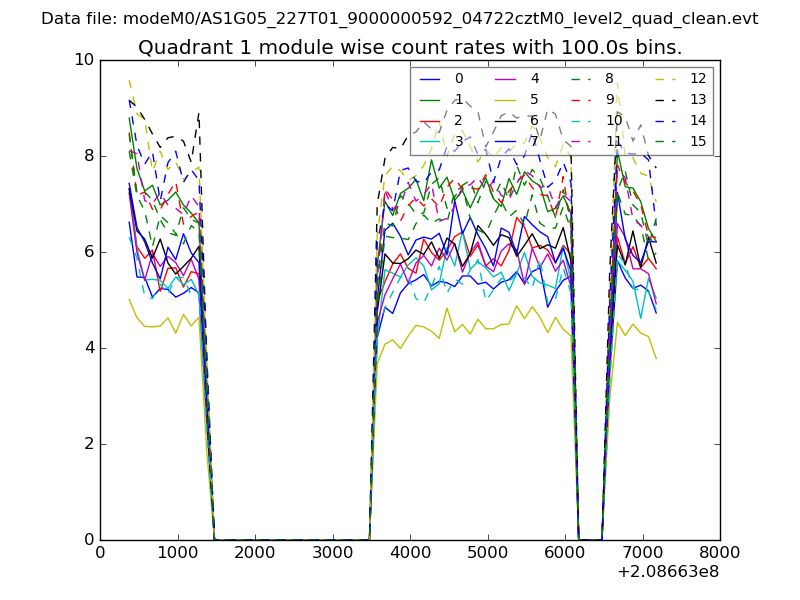
| Module-wise count rates for Quadrant A Data is divided into 100 sec bins |
 |
 |
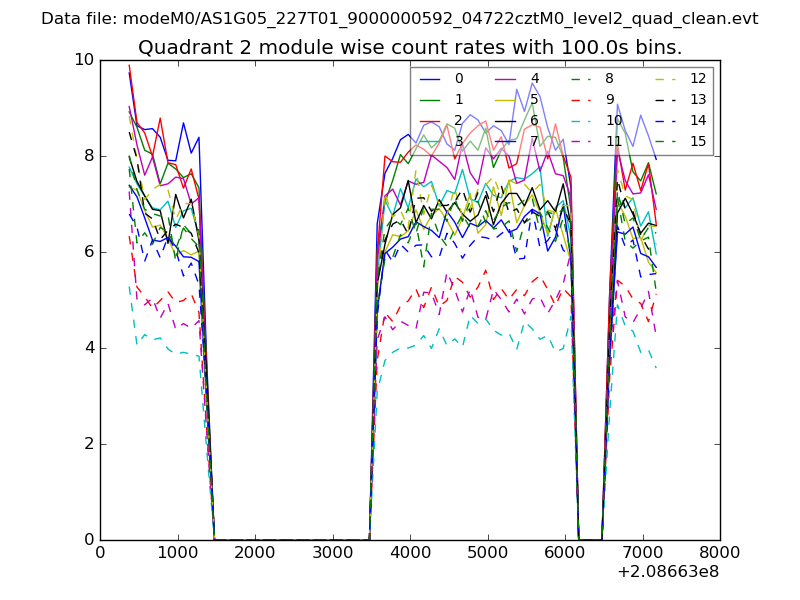
| Module-wise count rates for Quadrant B Data is divided into 100 sec bins |
 |
 |
| Module-wise count rates for Quadrant C Data is divided into 100 sec bins |
 |
 |
| Module-wise count rates for Quadrant D Data is divided into 100 sec bins |
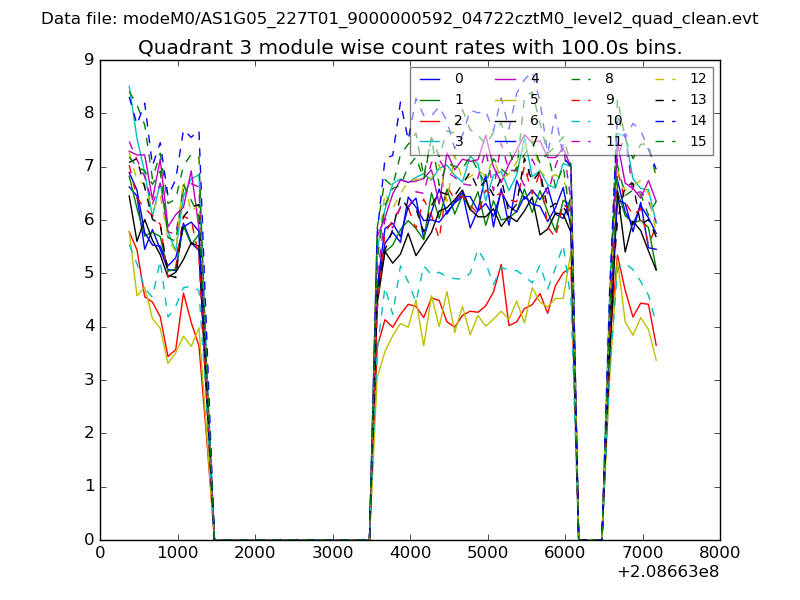 |
 |
| Parameter | Plot |
|---|---|
| CZT HV Monitor | 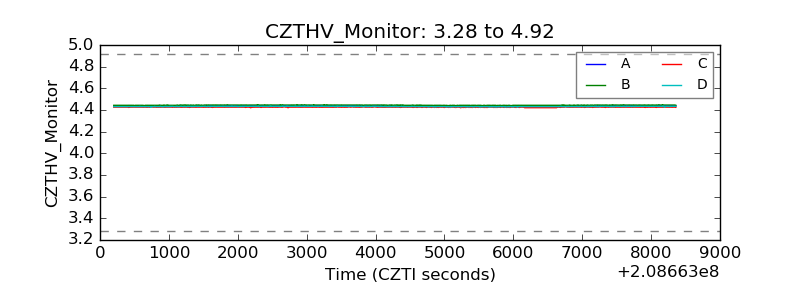 |
| D_VDD |  |
| Temperature 1 | 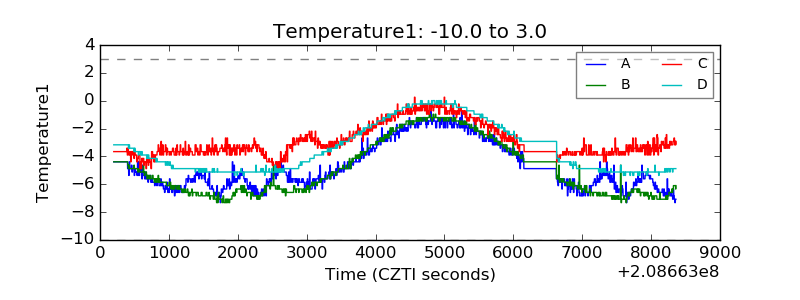 |
| Veto HV Monitor | 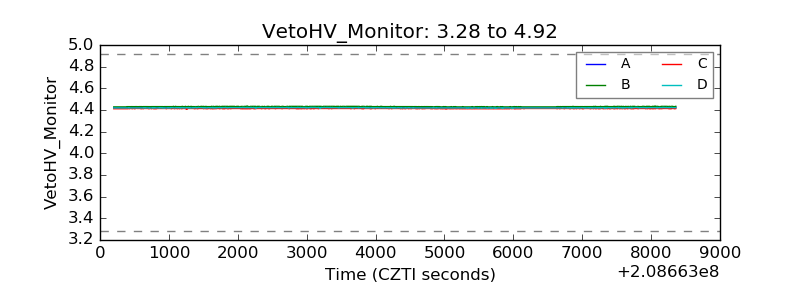 |
| Veto LLD | 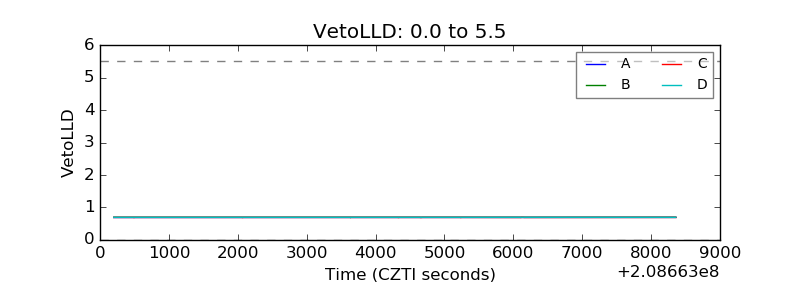 |
| Alpha Counter | 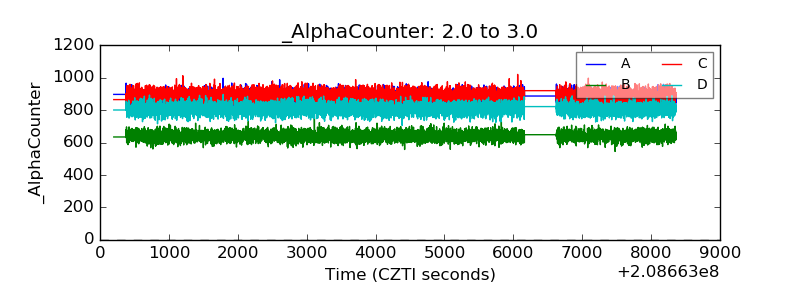 |
| _CPM_Rate | 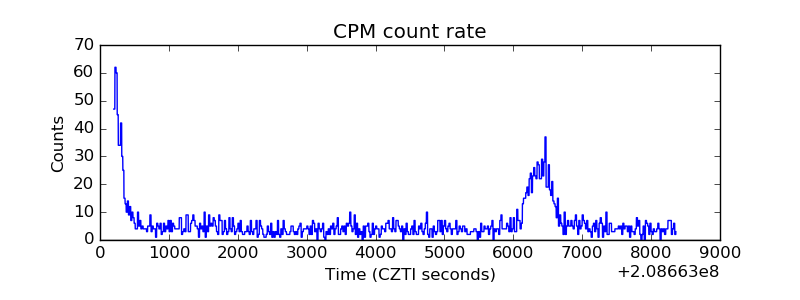 |
| CZT Counter | 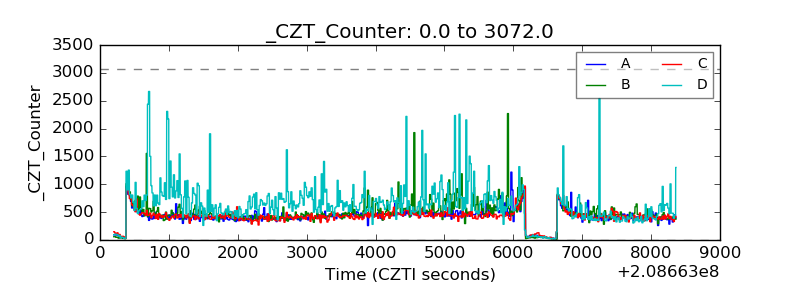 |
| +2.5 Volts monitor |  |
| +5 Volts monitor |  |
| _ROLL_ROT | 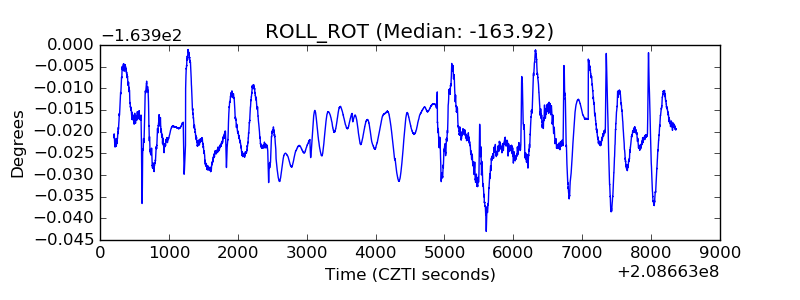 |
| _Roll_DEC | 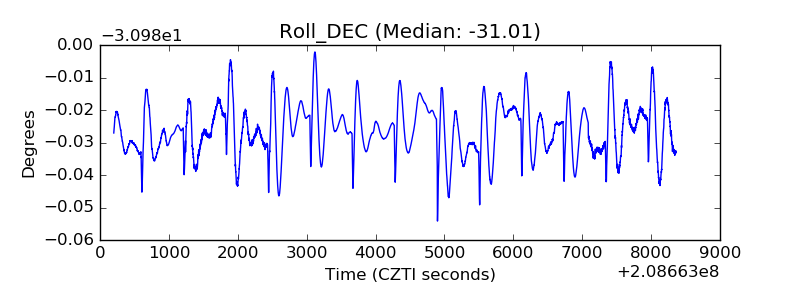 |
| _Roll_RA | 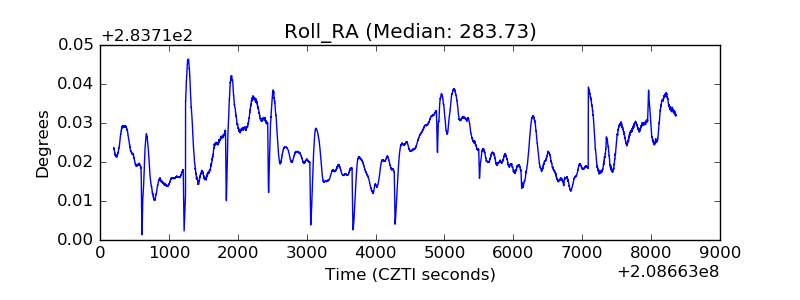 |
| Veto Counter | 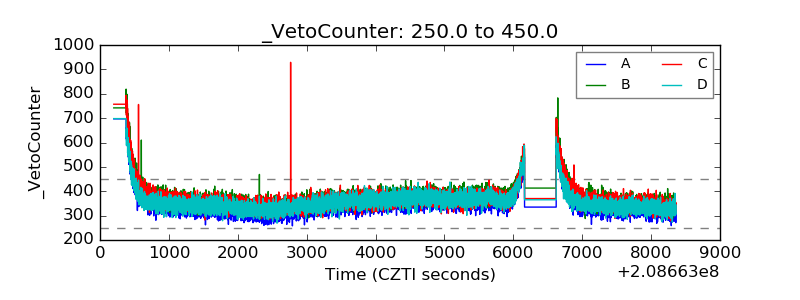 |