| Param | Original file | Final file |
|---|---|---|
| Filename | modeM0/AS1G05_227T01_9000000592_04727cztM0_level2.evt | modeM0/AS1G05_227T01_9000000592_04727cztM0_level2_quad_clean.evt |
| Size (bytes) | 606,663,360 | 85,800,960 |
| Size | 578.6 MB | 81.8 MB |
| Events in quadrant A | 3,089,453 | 533,942 |
| Events in quadrant B | 4,669,365 | 531,789 |
| Events in quadrant C | 6,296,685 | 533,740 |
| Events in quadrant D | 3,849,292 | 517,450 |
| Mode M0 | |||
|---|---|---|---|
| Quadrant | BADHDUFLAG | Total packets | Discarded packets |
| A | 0 | 14056 | 1 |
| B | 0 | 18380 | 1 |
| C | 0 | 23549 | 1 |
| D | 0 | 16420 | 1 |
| Mode M9 | |||
|---|---|---|---|
| Quadrant | BADHDUFLAG | Total packets | Discarded packets |
| A | 0 | 7 | 0 |
| B | 0 | 7 | 0 |
| C | 0 | 7 | 0 |
| D | 0 | 7 | 0 |
| Mode SS | |||
|---|---|---|---|
| Quadrant | BADHDUFLAG | Total packets | Discarded packets |
| A | 0 | 138 | 0 |
| B | 0 | 138 | 0 |
| C | 0 | 138 | 0 |
| D | 0 | 138 | 0 |
| Quadrant | Total seconds | Saturated seconds | Saturation percentage |
|---|---|---|---|
| A | 6914 | 83 | 1.200463% |
| B | 6914 | 572 | 8.273069% |
| C | 6914 | 881 | 12.742262% |
| D | 6914 | 199 | 2.878218% |
Noise dominated data is calculated using 1-second bins in cleaned event files. If a bin has >2000 counts, and if more than 50% of those come from <1% of pixels, then it is considered to be noise-dominated and hence unusable.
| Quadrant | # 1 sec bins | Bins with >0 counts | Bins with >2000 counts | High rate bins dominated by noise | Noise dominated (total time) | Noise dominated (detector-on time) | Marked lightcurve |
|---|---|---|---|---|---|---|---|
| A | 7529 | 6915 | 0 | 0 | 0.00% | 0.00% | 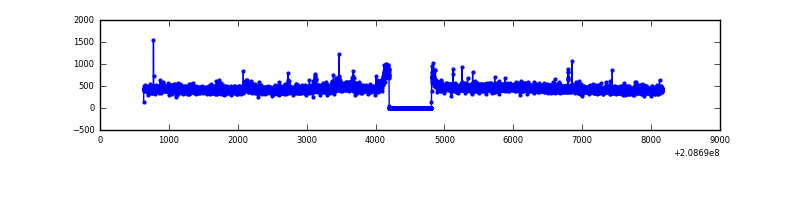 |
| B | 7529 | 6914 | 406 | 406 | 5.39% | 5.87% | 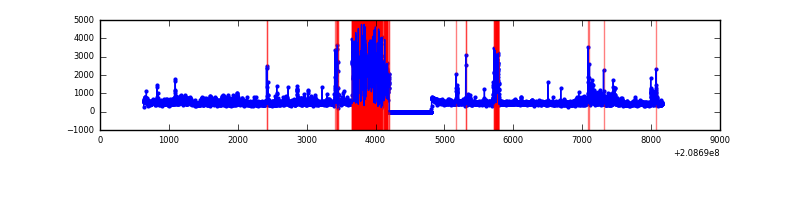 |
| C | 7529 | 6914 | 641 | 641 | 8.51% | 9.27% | 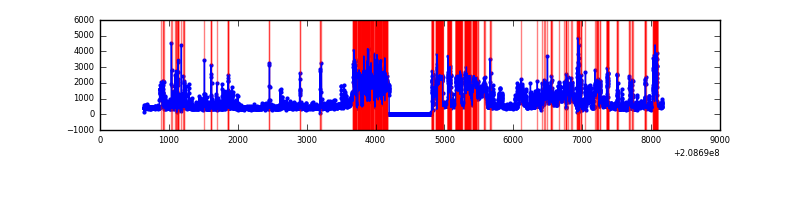 |
| D | 7529 | 6914 | 79 | 79 | 1.05% | 1.14% | 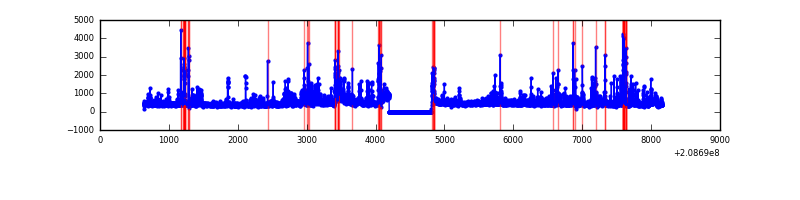 |
Top three noisy pixels from each quadrant. If the there are fewer than three noisy pixels in the level2.evt file, extra rows are filled as -1
| Pixel properties | Quadrant properties | ||||||
|---|---|---|---|---|---|---|---|
| Quadrant | DetID | PixID | Counts | Sigma | Mean | Median | Sigma |
| A | 8 | 15 | 28001 | 167.33 | 782 | 762 | 162.8 |
| A | 0 | 118 | 12429 | 71.67 | 782 | 762 | 162.8 |
| A | 0 | 149 | 11331 | 64.93 | 782 | 762 | 162.8 |
| B | 10 | 16 | 1313221 | 9057.84 | 744 | 727 | 144.9 |
| B | 15 | 204 | 228338 | 1570.8 | 744 | 727 | 144.9 |
| B | 14 | 167 | 182136 | 1251.95 | 744 | 727 | 144.9 |
| C | 14 | 48 | 3515469 | 21283.29 | 711 | 715 | 165.1 |
| C | 13 | 61 | 5801 | 30.8 | 711 | 715 | 165.1 |
| C | 8 | 208 | 5612 | 29.65 | 711 | 715 | 165.1 |
| D | 13 | 137 | 376549 | 2060.8 | 749 | 726 | 182.4 |
| D | 2 | 136 | 170781 | 932.48 | 749 | 726 | 182.4 |
| D | 13 | 235 | 140972 | 769.03 | 749 | 726 | 182.4 |
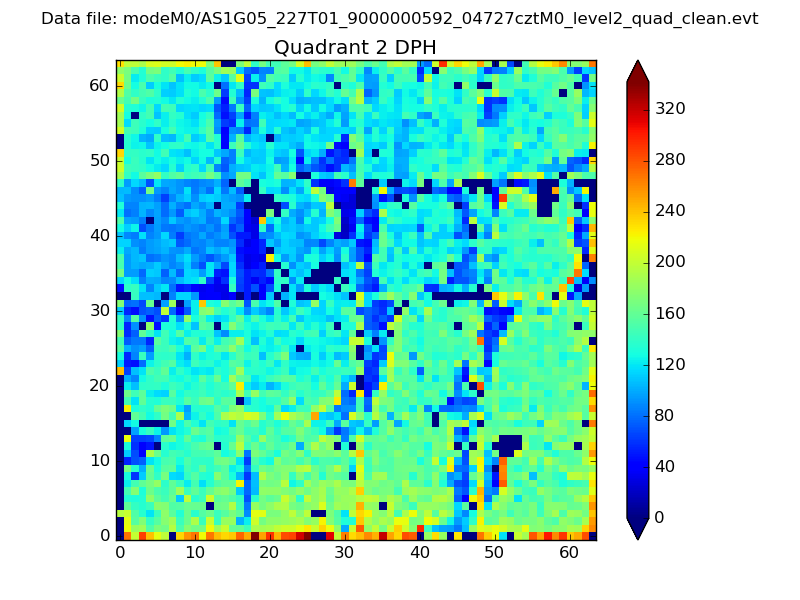
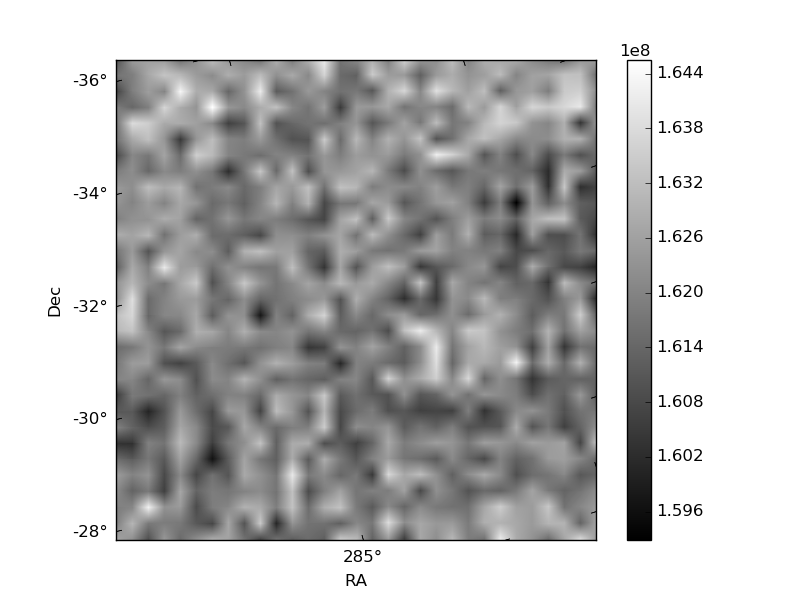
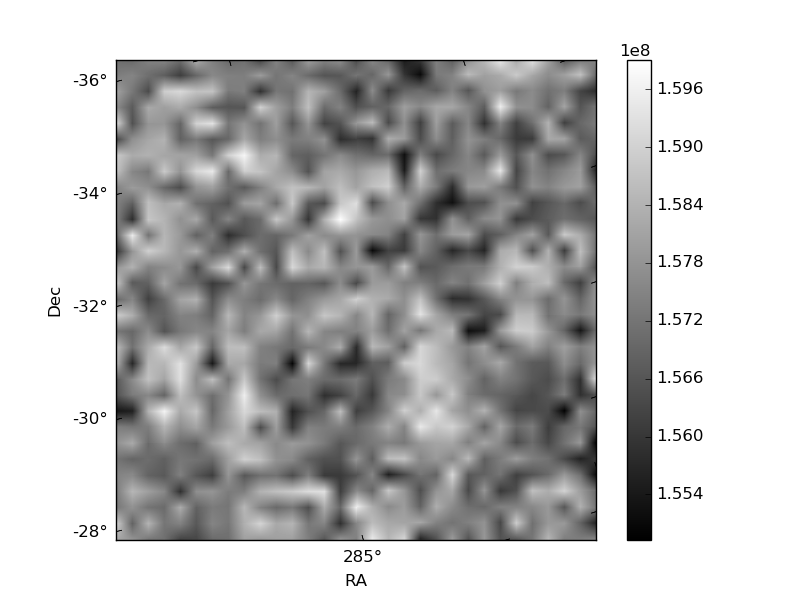
Histogram calculated using DETX and DETY for each event in the final _common_clean file
| Quadrant A | 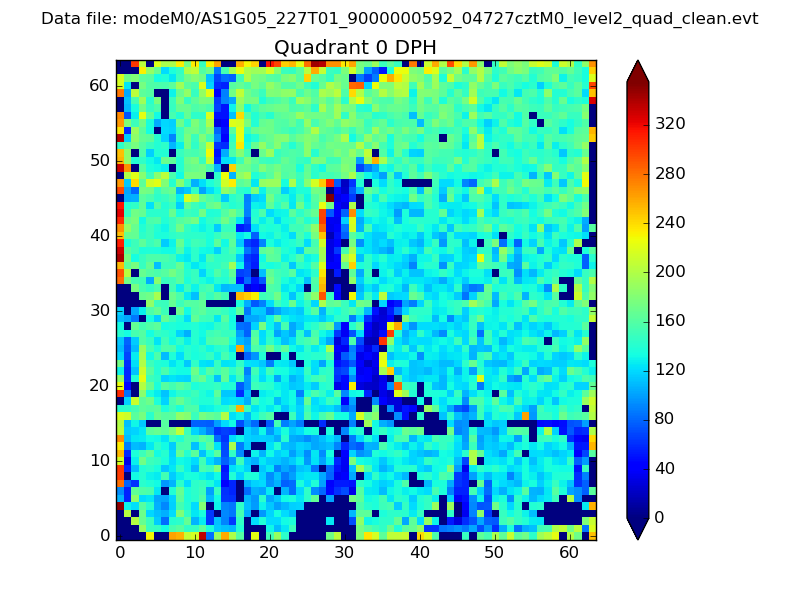 |
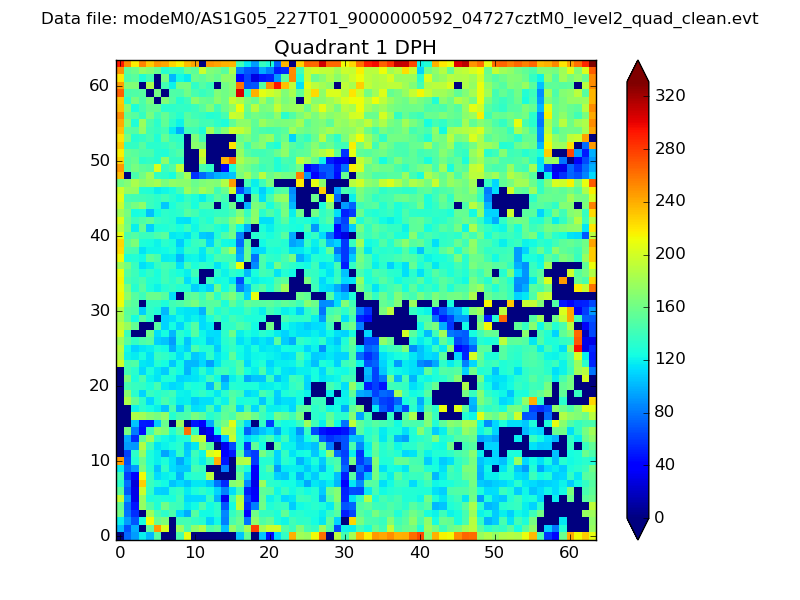 |
Quadrant B |
|---|---|---|---|
| Quadrant D | 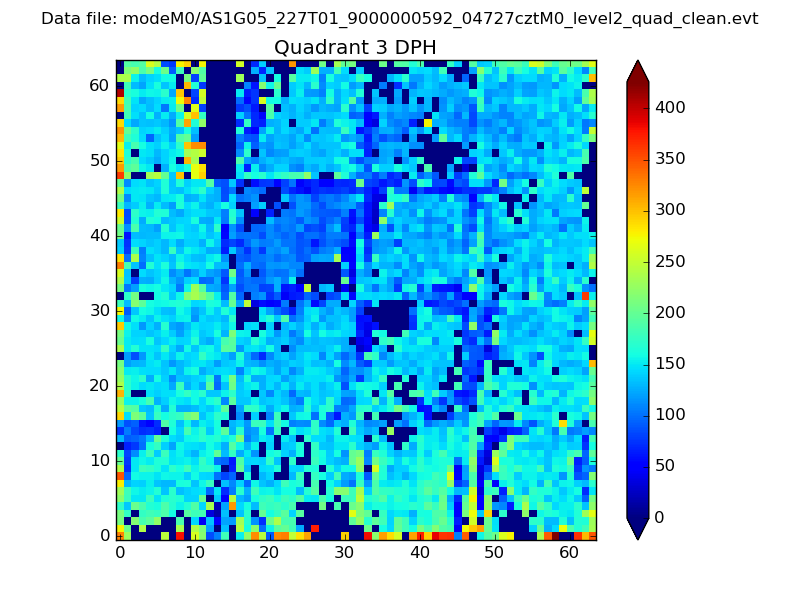 |
 |
Quadrant C |
| Plot type | Count rate plots | Images |
|---|---|---|
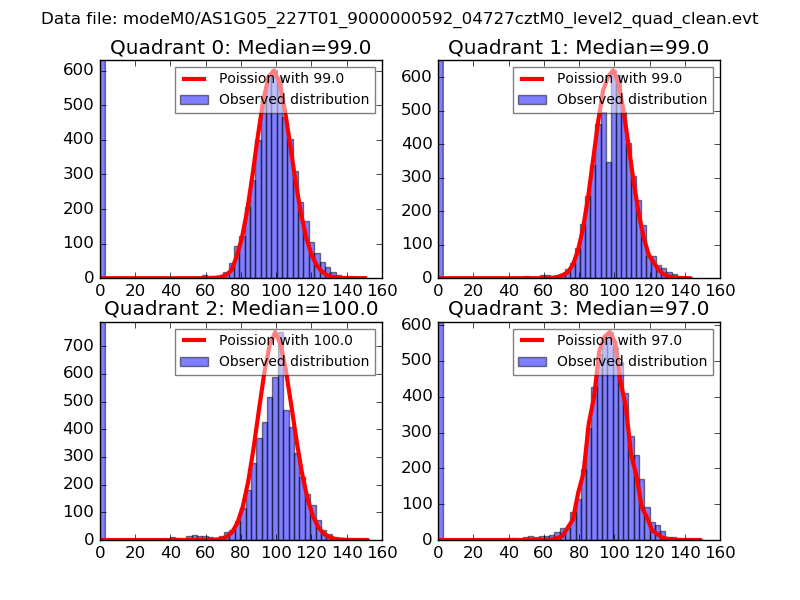
| Comparison with Poisson distribution Blue bars denote a histogram of data divided into 1 sec bins. Red curve is a Poisson curve with rate = median count rate of data. |
 |
 |
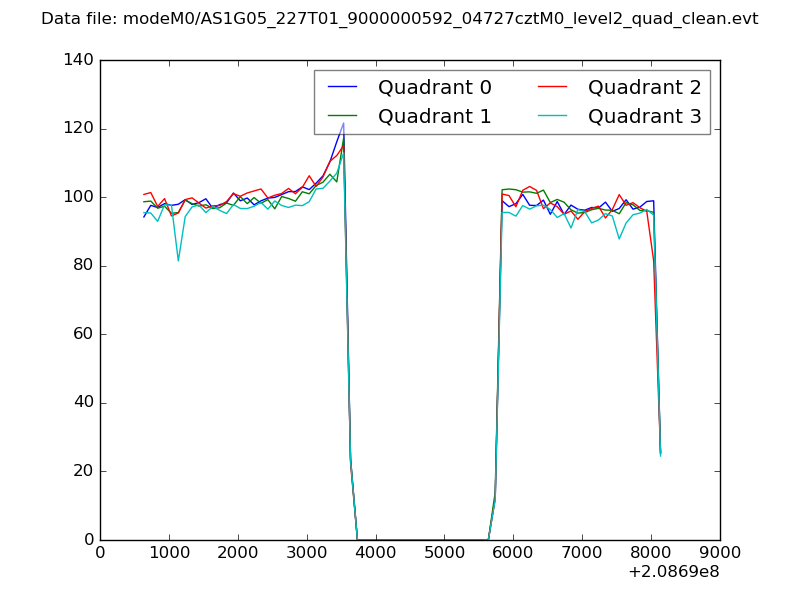
| Quadrant-wise count rates Data is divided into 100 sec bins |
 |
|
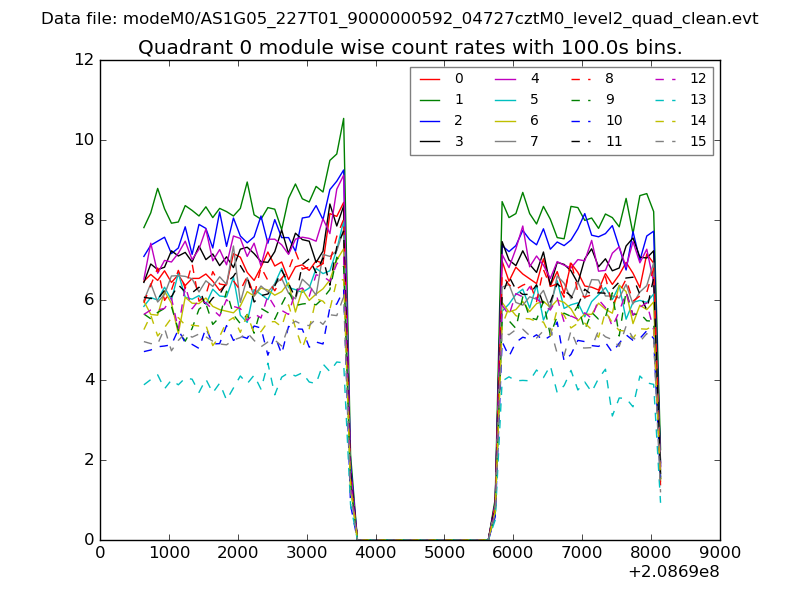
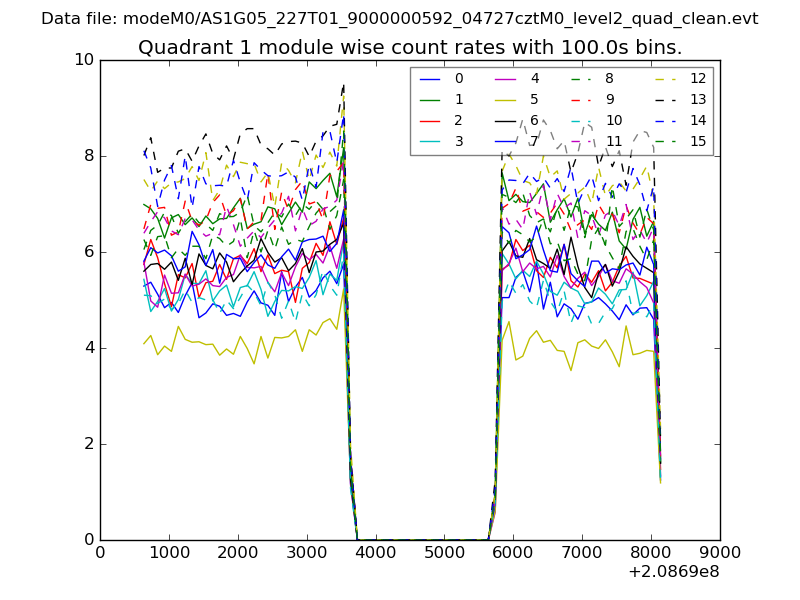
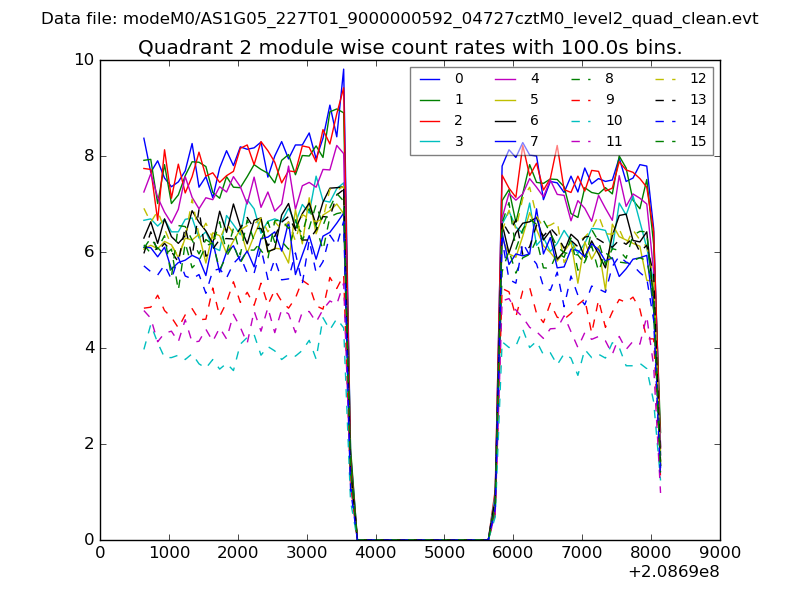
| Module-wise count rates for Quadrant A Data is divided into 100 sec bins |
 |
 |
| Module-wise count rates for Quadrant B Data is divided into 100 sec bins |
 |
 |
| Module-wise count rates for Quadrant C Data is divided into 100 sec bins |
 |
 |
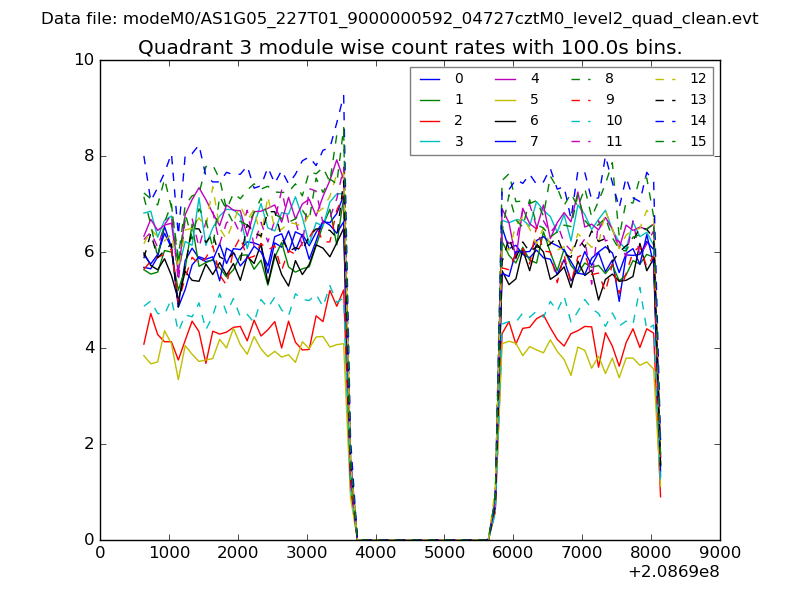
| Module-wise count rates for Quadrant D Data is divided into 100 sec bins |
 |
 |
| Parameter | Plot |
|---|---|
| CZT HV Monitor | 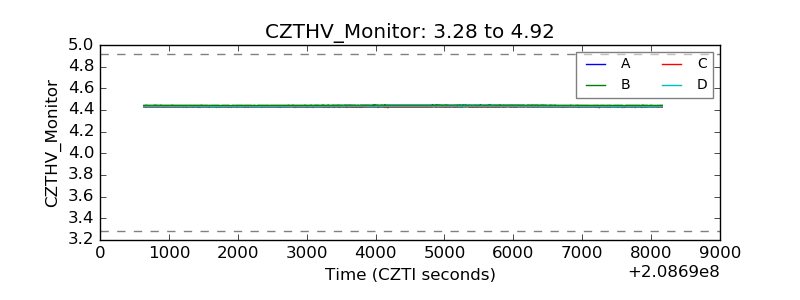 |
| D_VDD | 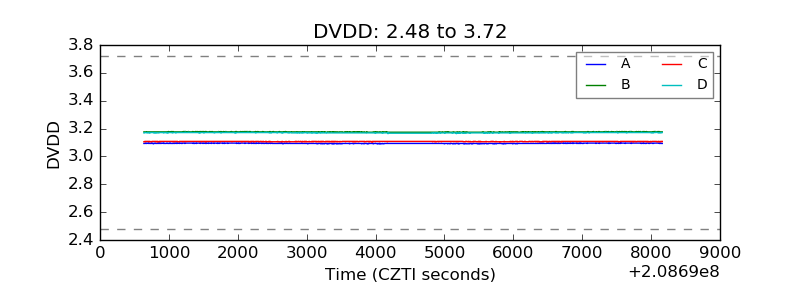 |
| Temperature 1 | 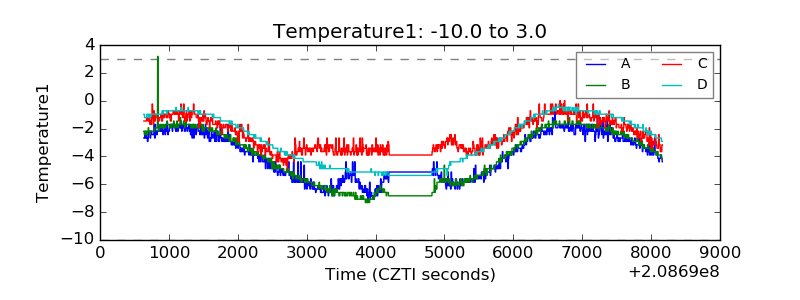 |
| Veto HV Monitor | 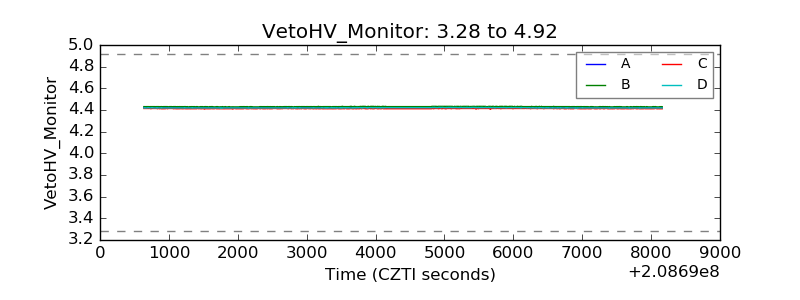 |
| Veto LLD | 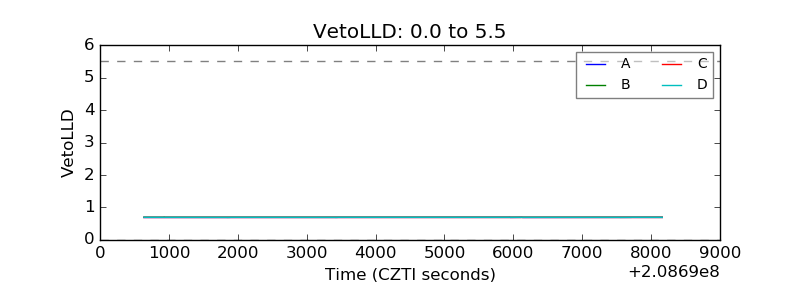 |
| Alpha Counter | 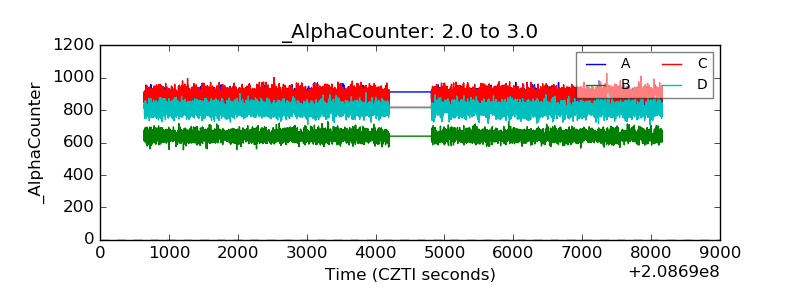 |
| _CPM_Rate | 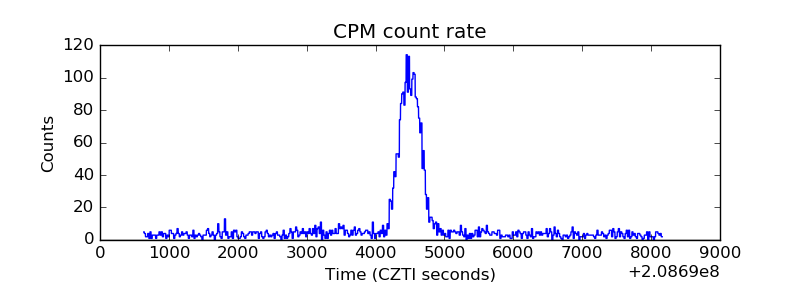 |
| CZT Counter | 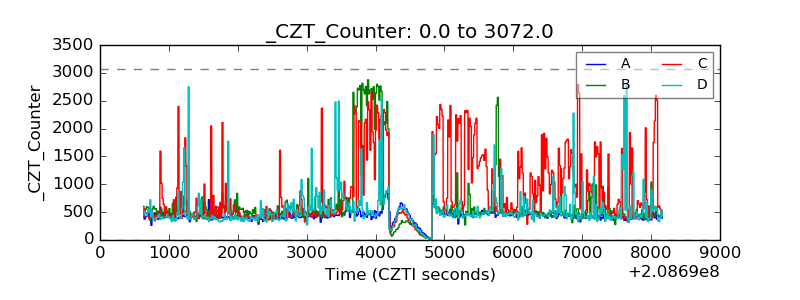 |
| +2.5 Volts monitor |  |
| +5 Volts monitor |  |
| _ROLL_ROT | 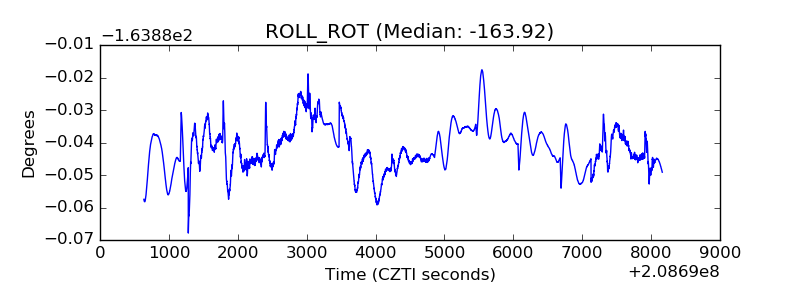 |
| _Roll_DEC | 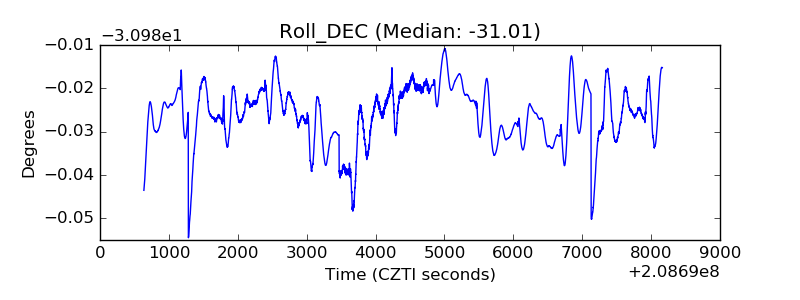 |
| _Roll_RA | 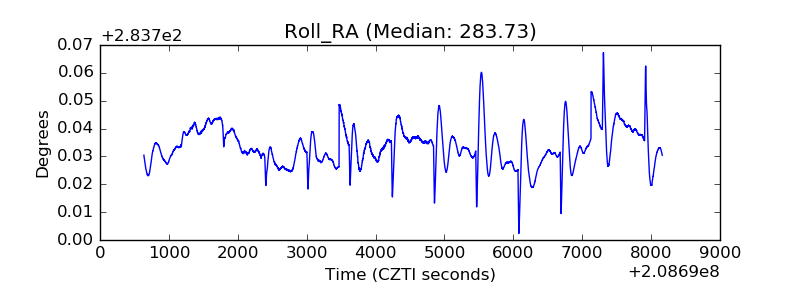 |
| Veto Counter | 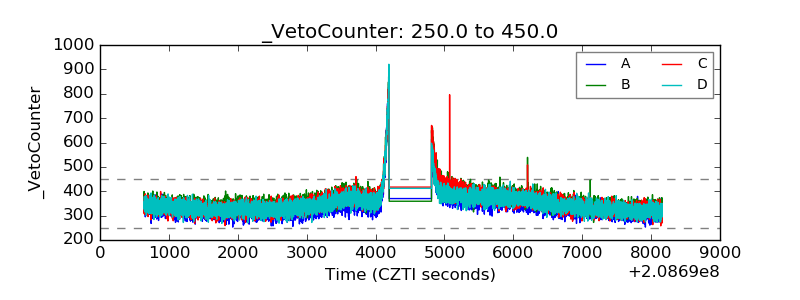 |