| Param | Original file | Final file |
|---|---|---|
| Filename | modeM0/AS1G05_192T01_9000000594cztM0_level2.fits | modeM0/AS1G05_192T01_9000000594cztM0_level2_quad_clean.evt |
| Size (bytes) | 558,498,240 | 303,563,520 |
| Size | 532.6 MB | 289.5 MB |
| Events in quadrant A | 3,167,521 | 1,683,032 |
| Events in quadrant B | 4,504,475 | 1,745,353 |
| Events in quadrant C | 2,154,327 | 1,068,137 |
| Events in quadrant D | 3,833,563 | 1,445,759 |
| Mode SS | |||
|---|---|---|---|
| Quadrant | BADHDUFLAG | Total packets | Discarded packets |
| A | 0 | 992 | 0 |
| B | 0 | 992 | 0 |
| C | 0 | 992 | 0 |
| D | 0 | 993 | 0 |
| Mode M9 | |||
|---|---|---|---|
| Quadrant | BADHDUFLAG | Total packets | Discarded packets |
| A | 0 | 93 | 0 |
| B | 0 | 93 | 0 |
| C | 0 | 93 | 0 |
| D | 0 | 94 | 0 |
| Mode M0 | |||
|---|---|---|---|
| Quadrant | BADHDUFLAG | Total packets | Discarded packets |
| A | 0 | 98415 | 0 |
| B | 0 | 102528 | 0 |
| C | 0 | 191830 | 0 |
| D | 0 | 142331 | 0 |
| Quadrant | Total seconds | Saturated seconds | Saturation percentage |
|---|---|---|---|
| A | 47395 | 538 | 1.135141% |
| B | 47397 | 767 | 1.618246% |
| C | 47188 | 11039 | 23.393659% |
| D | 47139 | 4867 | 10.324784% |
Noise dominated data is calculated using 1-second bins in cleaned event files. If a bin has >2000 counts, and if more than 50% of those come from <1% of pixels, then it is considered to be noise-dominated and hence unusable.
| Quadrant | # 1 sec bins | Bins with >0 counts | Bins with >2000 counts | High rate bins dominated by noise | Noise dominated (total time) | Noise dominated (detector-on time) | Marked lightcurve |
|---|---|---|---|---|---|---|---|
| A | 61647 | 25602 | 0 | 0 | 0.00% | 0.00% |  |
| B | 1047795 | 47289 | 0 | 0 | 0.00% | 0.00% | 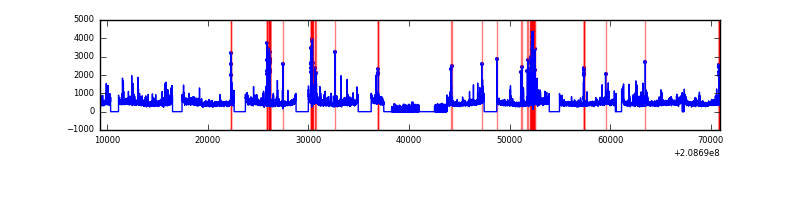 |
| C | 1046360 | 45925 | 0 | 0 | 0.00% | 0.00% | 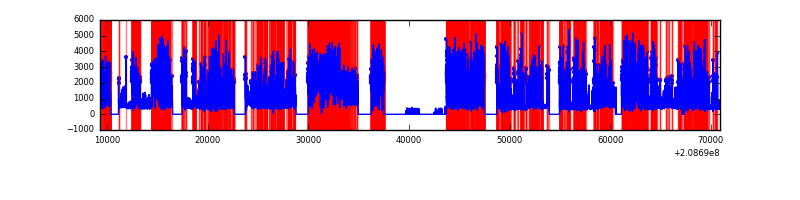 |
| D | 1047803 | 46709 | 0 | 0 | 0.00% | 0.00% | 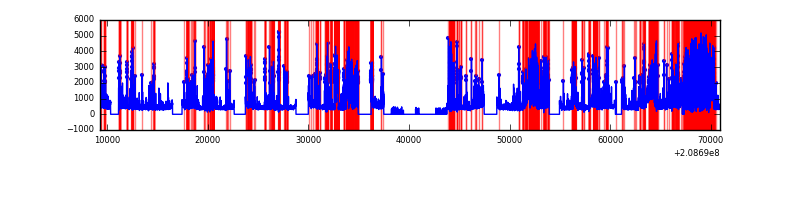 |
Top three noisy pixels from each quadrant. If the there are fewer than three noisy pixels in the level2.evt file, extra rows are filled as -1
| Pixel properties | Quadrant properties | ||||||
|---|---|---|---|---|---|---|---|
| Quadrant | DetID | PixID | Counts | Sigma | Mean | Median | Sigma |
| A | 15 | 47 | 1771 | 6.06 | 834 | 809 | 158.7 |
| A | 15 | 255 | 1720 | 5.74 | 834 | 809 | 158.7 |
| A | 15 | 63 | 1640 | 5.24 | 834 | 809 | 158.7 |
| B | 9 | 144 | 2829 | 6.62 | 1201 | 1151 | 253.6 |
| B | 12 | 144 | 2767 | 6.37 | 1201 | 1151 | 253.6 |
| B | 2 | 9 | 2530 | 5.44 | 1201 | 1151 | 253.6 |
| C | 1 | 80 | 1594 | 6.94 | 568 | 526 | 153.8 |
| C | 1 | 81 | 1567 | 6.77 | 568 | 526 | 153.8 |
| C | 12 | 241 | 1487 | 6.25 | 568 | 526 | 153.8 |
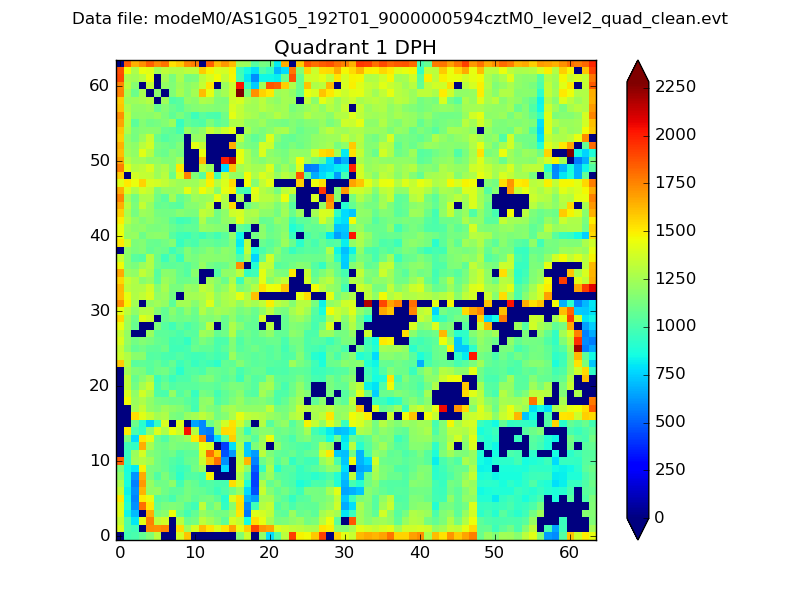
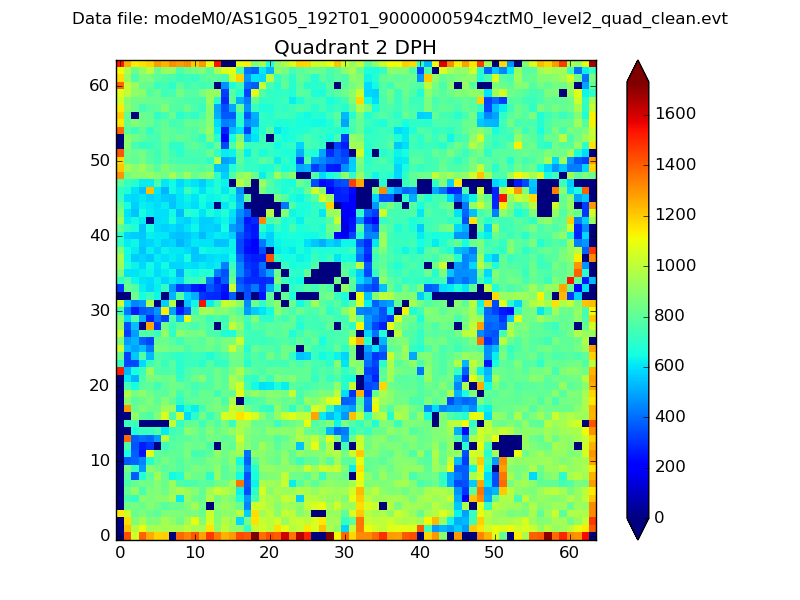
Histogram calculated using DETX and DETY for each event in the final _common_clean file
| Quadrant A | 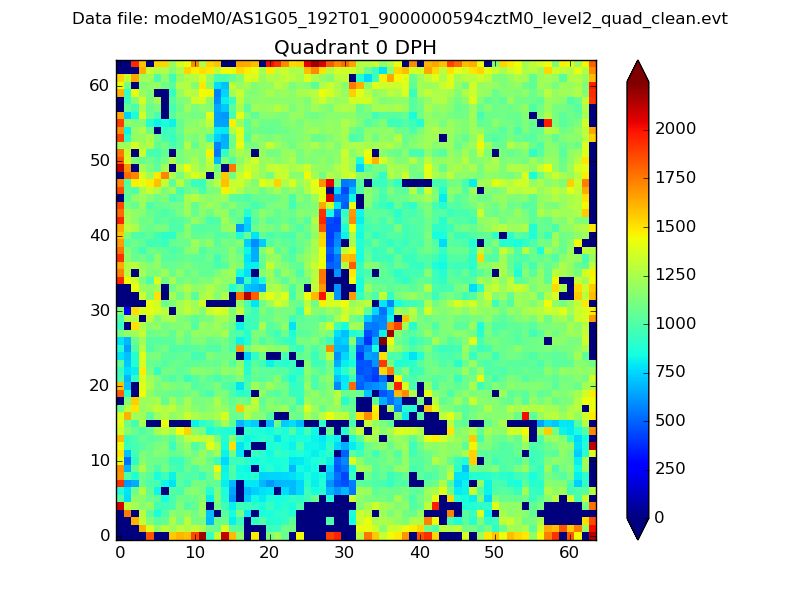 |
 |
Quadrant B |
|---|---|---|---|
| Quadrant D | 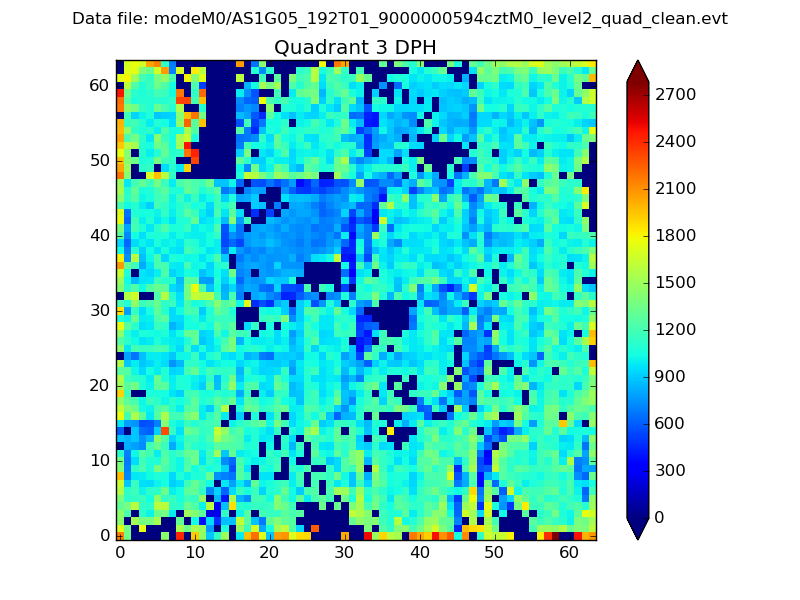 |
 |
Quadrant C |
| Plot type | Count rate plots | Images |
|---|---|---|
| Comparison with Poisson distribution Blue bars denote a histogram of data divided into 1 sec bins. Red curve is a Poisson curve with rate = median count rate of data. |
 |
 |
| Quadrant-wise count rates Data is divided into 100 sec bins |
 |
|
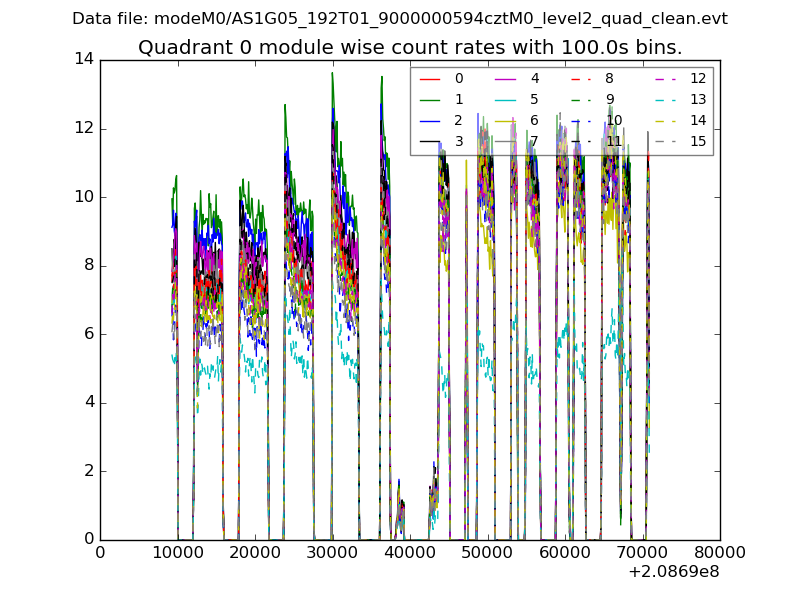
| Module-wise count rates for Quadrant A Data is divided into 100 sec bins |
 |
 |
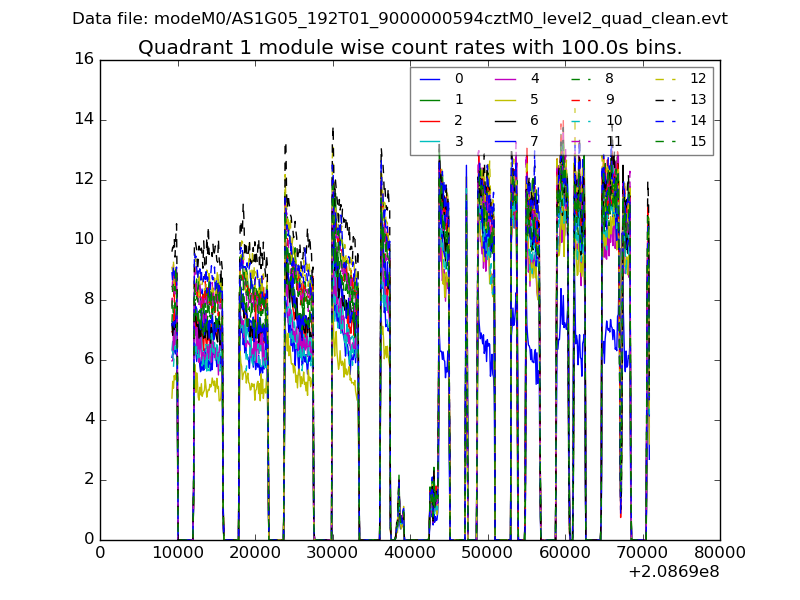
| Module-wise count rates for Quadrant B Data is divided into 100 sec bins |
 |
 |
| Module-wise count rates for Quadrant C Data is divided into 100 sec bins |
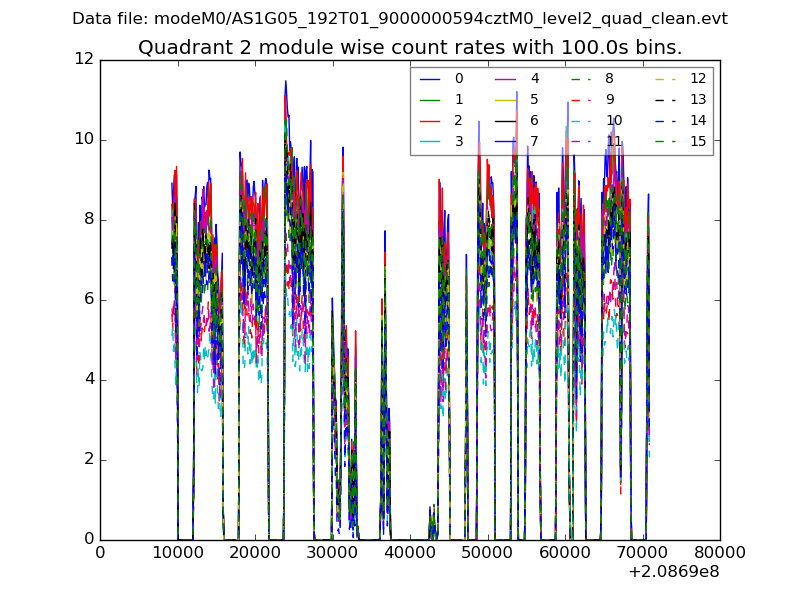 |
 |
| Module-wise count rates for Quadrant D Data is divided into 100 sec bins |
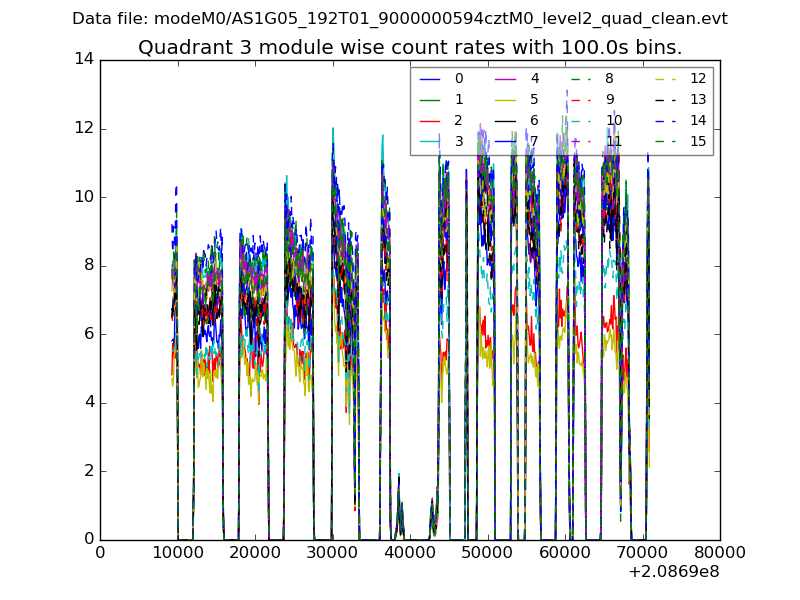 |
 |
| Parameter | Plot |
|---|---|
| CZT HV Monitor | 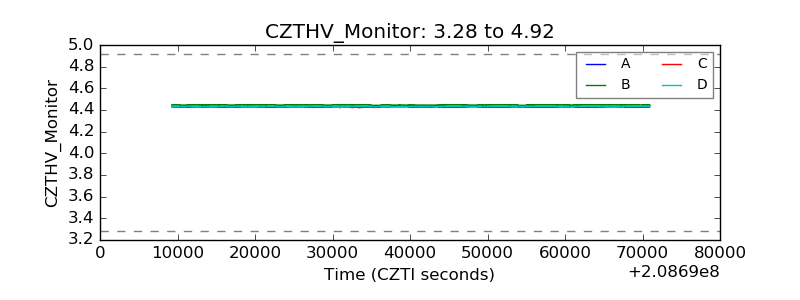 |
| D_VDD | 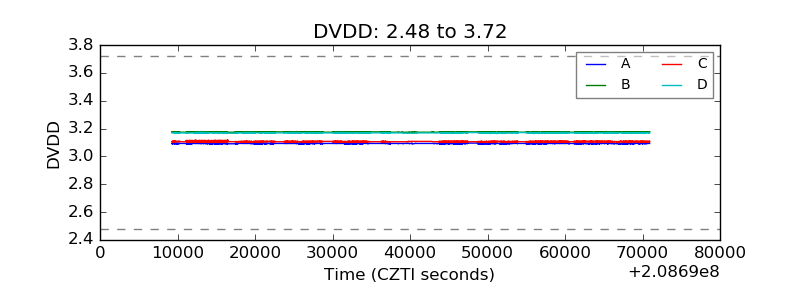 |
| Temperature 1 | 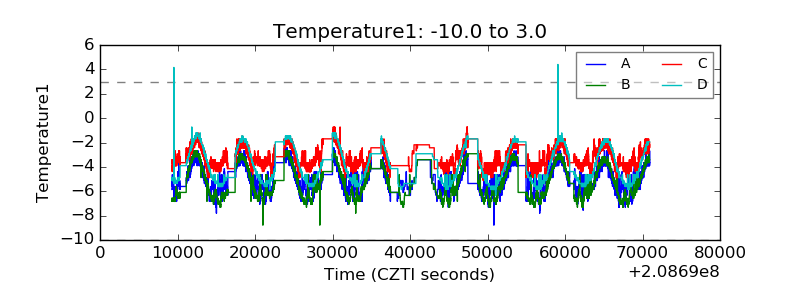 |
| Veto HV Monitor |  |
| Veto LLD | 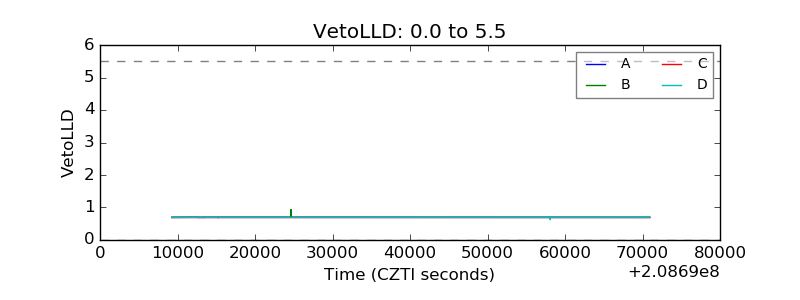 |
| Alpha Counter |  |
| _CPM_Rate | 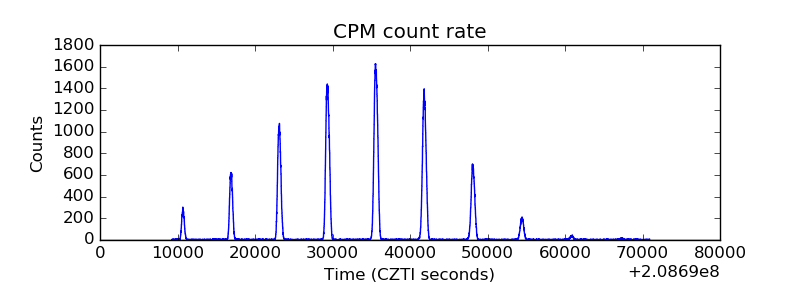 |
| CZT Counter | 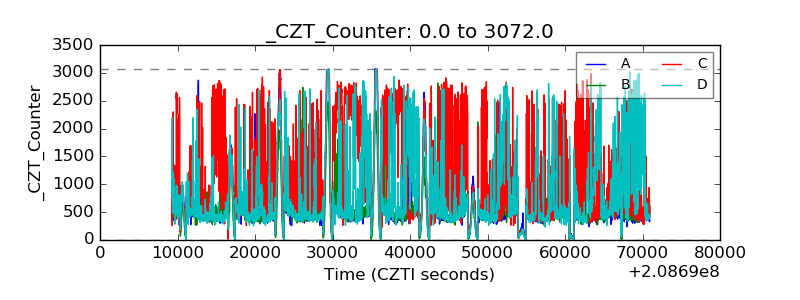 |
| +2.5 Volts monitor | 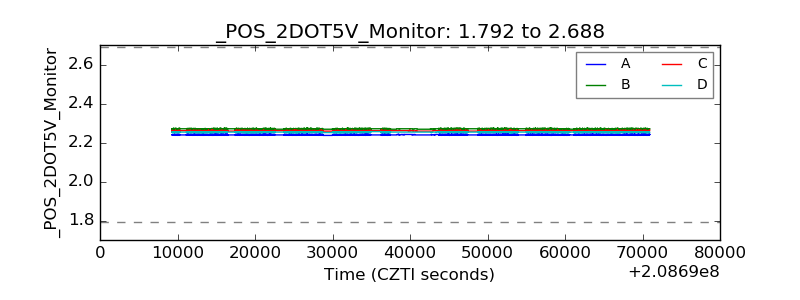 |
| +5 Volts monitor | 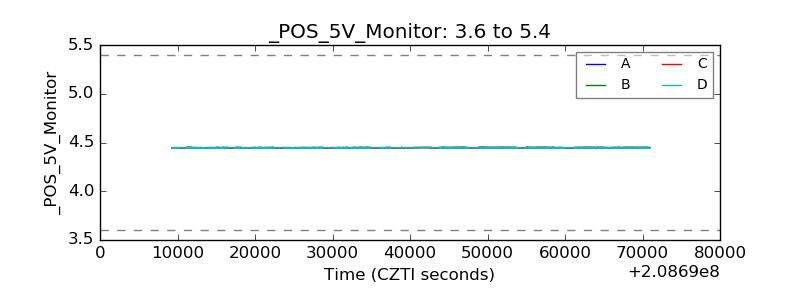 |
| _ROLL_ROT | 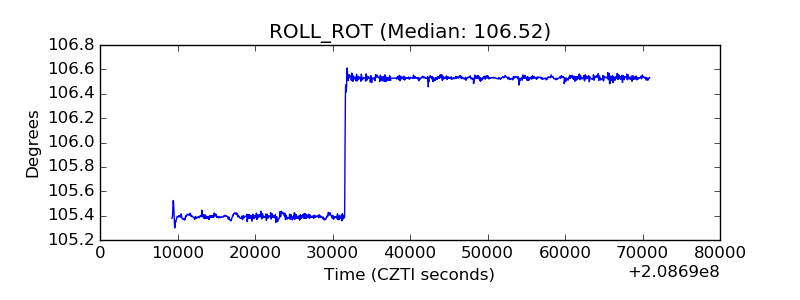 |
| _Roll_DEC | 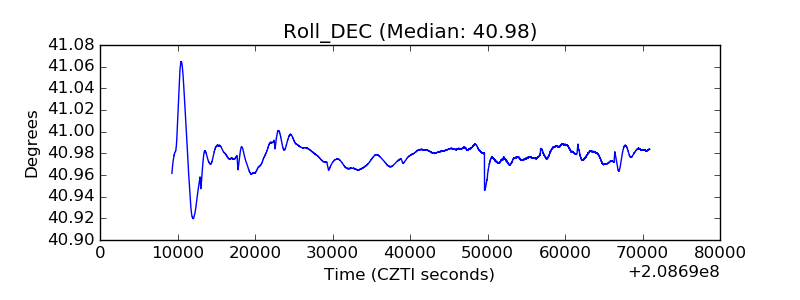 |
| _Roll_RA | 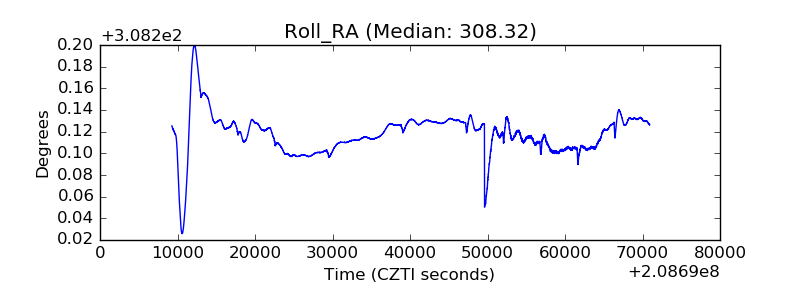 |
| Veto Counter | 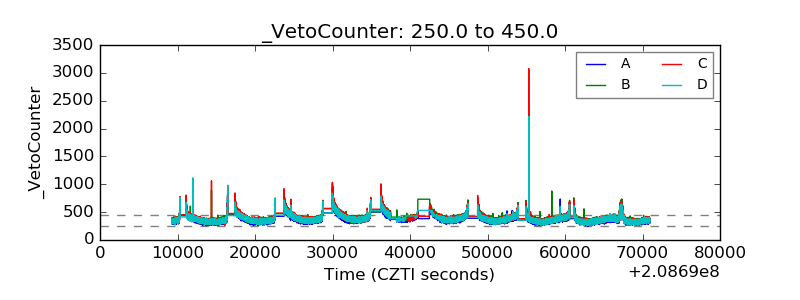 |