| Param | Original file | Final file |
|---|---|---|
| Filename | modeM0/AS1G05_192T01_9000000594_04727cztM0_level2.evt | modeM0/AS1G05_192T01_9000000594_04727cztM0_level2_quad_clean.evt |
| Size (bytes) | 233,919,360 | 23,135,040 |
| Size | 223.1 MB | 22.1 MB |
| Events in quadrant A | 1,281,551 | 133,896 |
| Events in quadrant B | 1,416,948 | 134,892 |
| Events in quadrant C | 2,486,322 | 120,137 |
| Events in quadrant D | 1,722,448 | 125,764 |
| Mode SS | |||
|---|---|---|---|
| Quadrant | BADHDUFLAG | Total packets | Discarded packets |
| A | 0 | 54 | 0 |
| B | 0 | 54 | 0 |
| C | 0 | 54 | 0 |
| D | 0 | 54 | 0 |
| Mode M9 | |||
|---|---|---|---|
| Quadrant | BADHDUFLAG | Total packets | Discarded packets |
| A | 0 | 8 | 0 |
| B | 0 | 8 | 0 |
| C | 0 | 8 | 0 |
| D | 0 | 8 | 0 |
| Mode M0 | |||
|---|---|---|---|
| Quadrant | BADHDUFLAG | Total packets | Discarded packets |
| A | 0 | 5419 | 2 |
| B | 0 | 5810 | 1 |
| C | 0 | 9165 | 1 |
| D | 0 | 6830 | 1 |
| Quadrant | Total seconds | Saturated seconds | Saturation percentage |
|---|---|---|---|
| A | 2579 | 76 | 2.946879% |
| B | 2579 | 73 | 2.830554% |
| C | 2579 | 376 | 14.579294% |
| D | 2579 | 142 | 5.506010% |
Noise dominated data is calculated using 1-second bins in cleaned event files. If a bin has >2000 counts, and if more than 50% of those come from <1% of pixels, then it is considered to be noise-dominated and hence unusable.
| Quadrant | # 1 sec bins | Bins with >0 counts | Bins with >2000 counts | High rate bins dominated by noise | Noise dominated (total time) | Noise dominated (detector-on time) | Marked lightcurve |
|---|---|---|---|---|---|---|---|
| A | 3369 | 2580 | 12 | 12 | 0.36% | 0.47% | 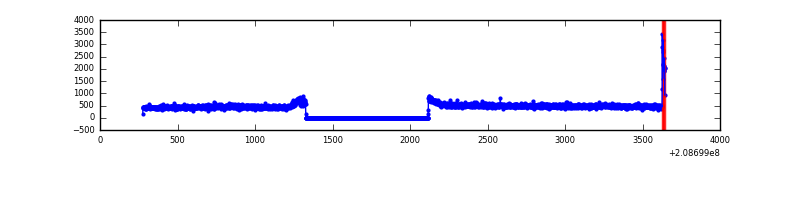 |
| B | 3369 | 2580 | 0 | 0 | 0.00% | 0.00% | 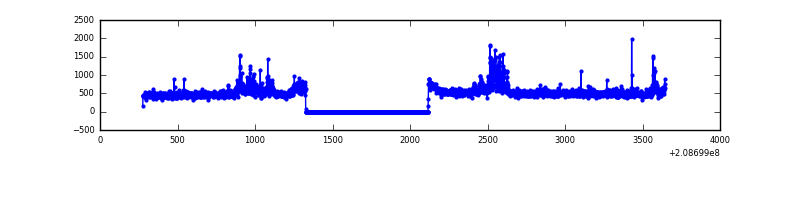 |
| C | 3369 | 2580 | 246 | 246 | 7.30% | 9.53% | 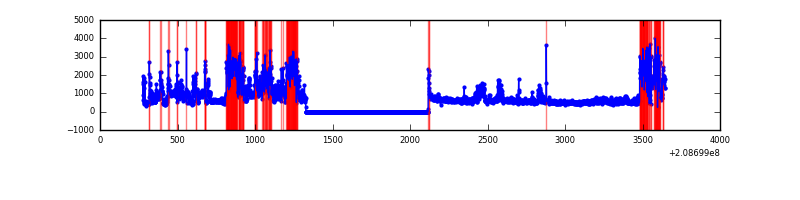 |
| D | 3369 | 2580 | 49 | 49 | 1.45% | 1.90% | 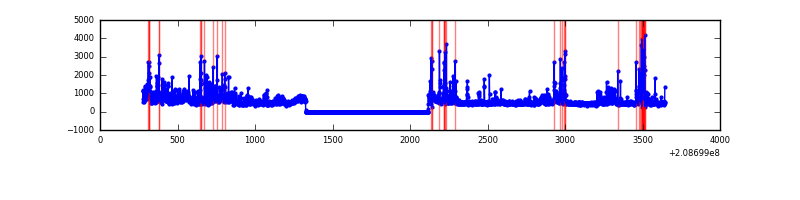 |
Top three noisy pixels from each quadrant. If the there are fewer than three noisy pixels in the level2.evt file, extra rows are filled as -1
| Pixel properties | Quadrant properties | ||||||
|---|---|---|---|---|---|---|---|
| Quadrant | DetID | PixID | Counts | Sigma | Mean | Median | Sigma |
| A | 0 | 118 | 31431 | 453.59 | 322 | 314 | 68.6 |
| A | 0 | 226 | 5872 | 81.02 | 322 | 314 | 68.6 |
| A | 8 | 15 | 4713 | 64.12 | 322 | 314 | 68.6 |
| B | 4 | 80 | 94204 | 1425.44 | 325 | 317 | 65.9 |
| B | 14 | 167 | 36875 | 555.04 | 325 | 317 | 65.9 |
| B | 15 | 204 | 12632 | 186.97 | 325 | 317 | 65.9 |
| C | 14 | 48 | 1317697 | 18610.42 | 295 | 295 | 70.8 |
| C | 8 | 128 | 6373 | 85.86 | 295 | 295 | 70.8 |
| C | 8 | 208 | 3234 | 41.52 | 295 | 295 | 70.8 |
| D | 13 | 235 | 368226 | 4925.32 | 303 | 292 | 74.7 |
| D | 13 | 137 | 82195 | 1096.39 | 303 | 292 | 74.7 |
| D | 2 | 136 | 80764 | 1077.23 | 303 | 292 | 74.7 |
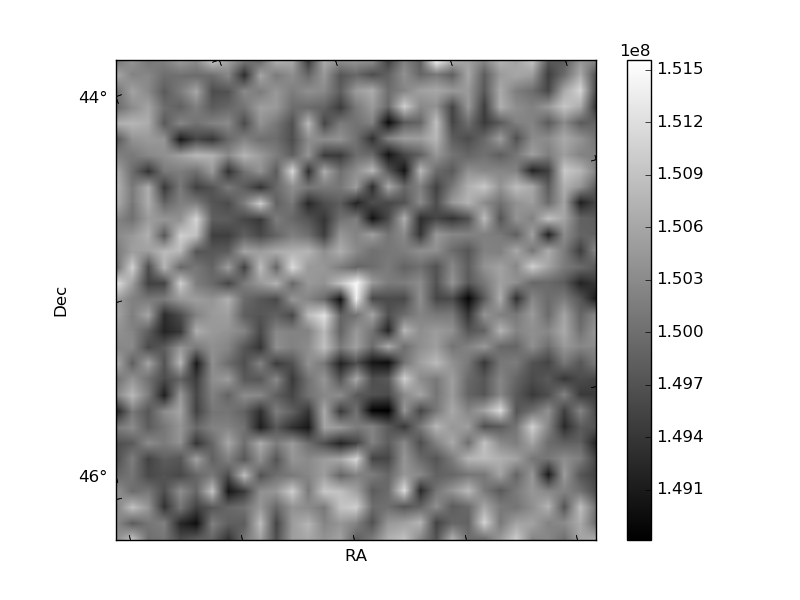
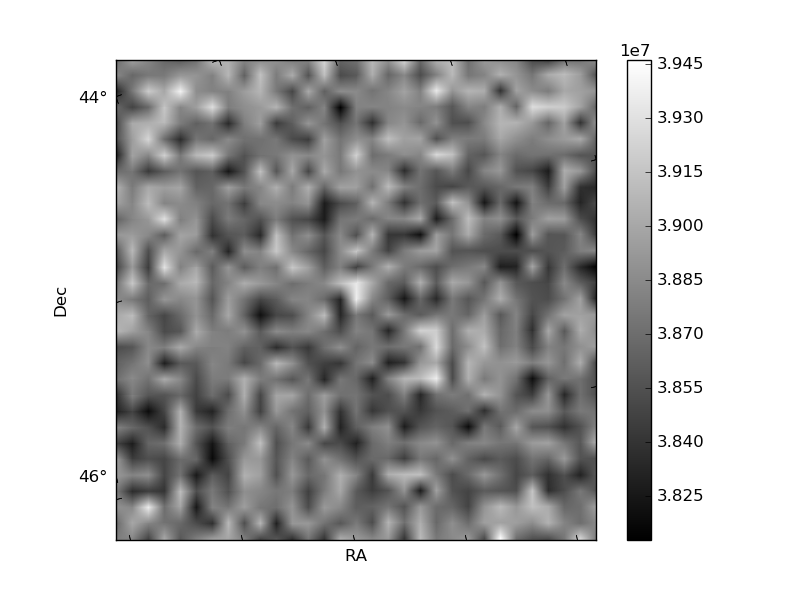
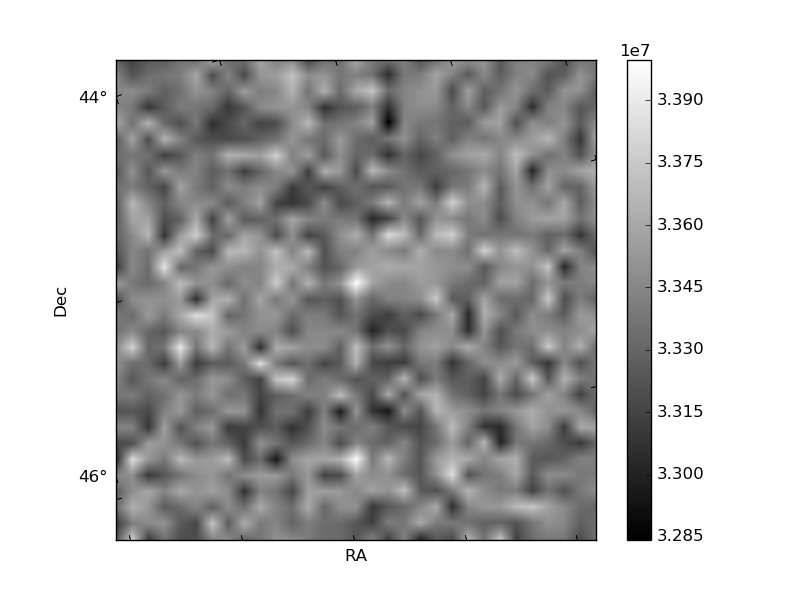
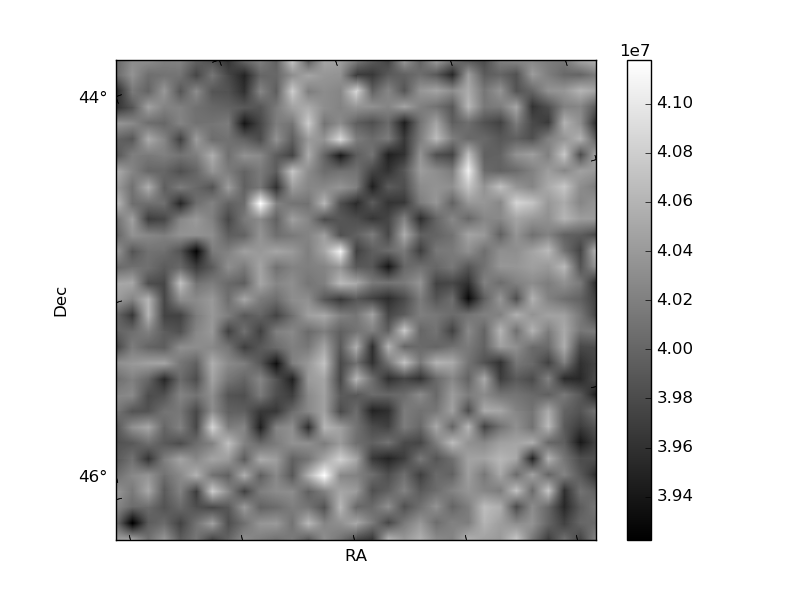
Histogram calculated using DETX and DETY for each event in the final _common_clean file
| Quadrant A | 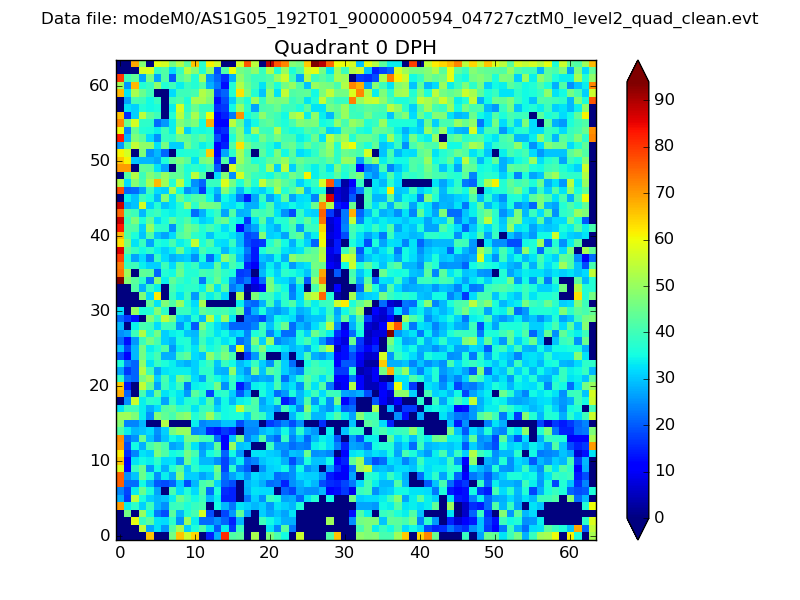 |
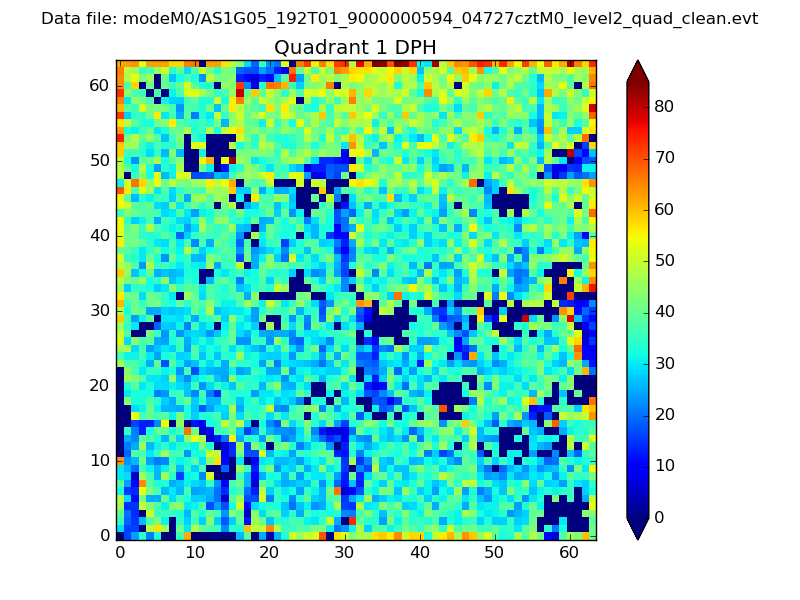 |
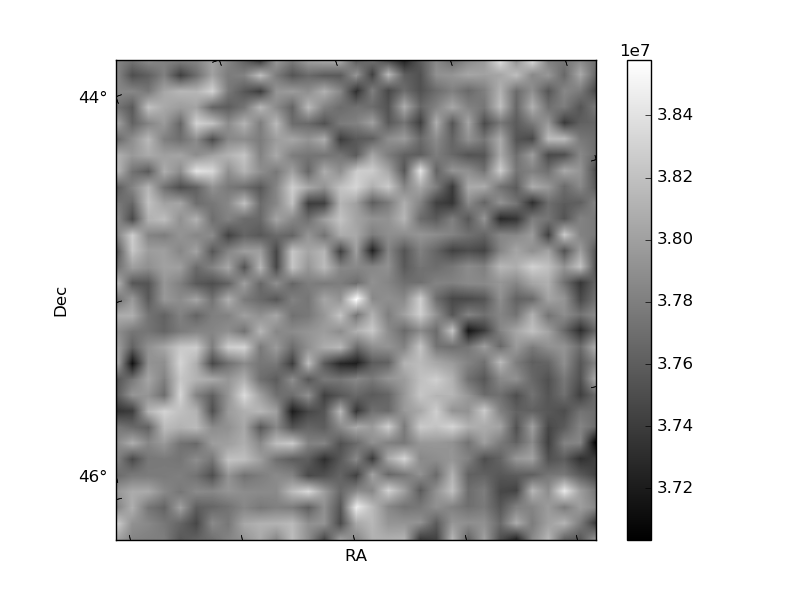
Quadrant B |
|---|---|---|---|
| Quadrant D | 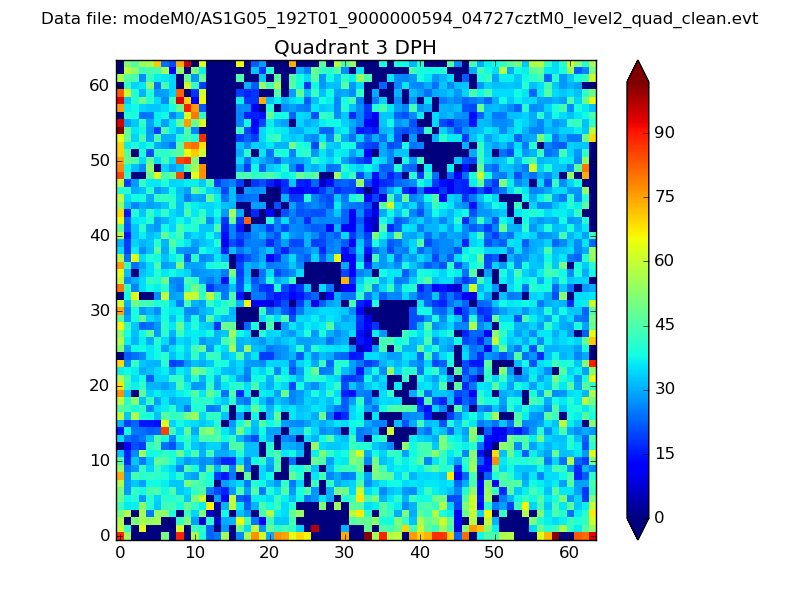 |
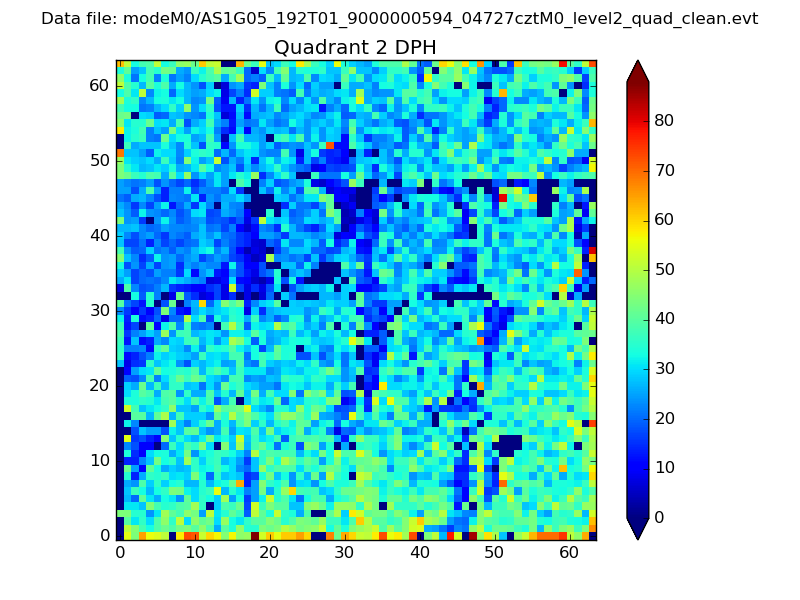 |
Quadrant C |
| Plot type | Count rate plots | Images |
|---|---|---|
| Comparison with Poisson distribution Blue bars denote a histogram of data divided into 1 sec bins. Red curve is a Poisson curve with rate = median count rate of data. |
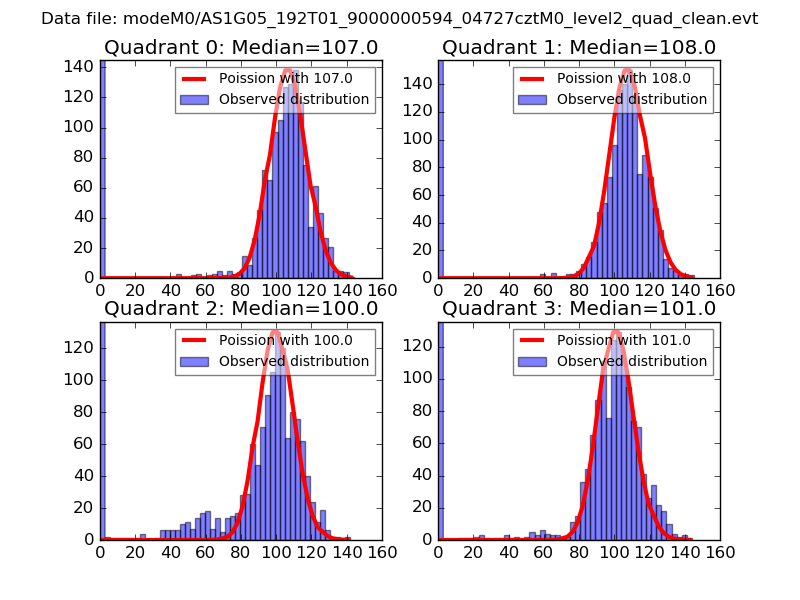 |
 |
| Quadrant-wise count rates Data is divided into 100 sec bins |
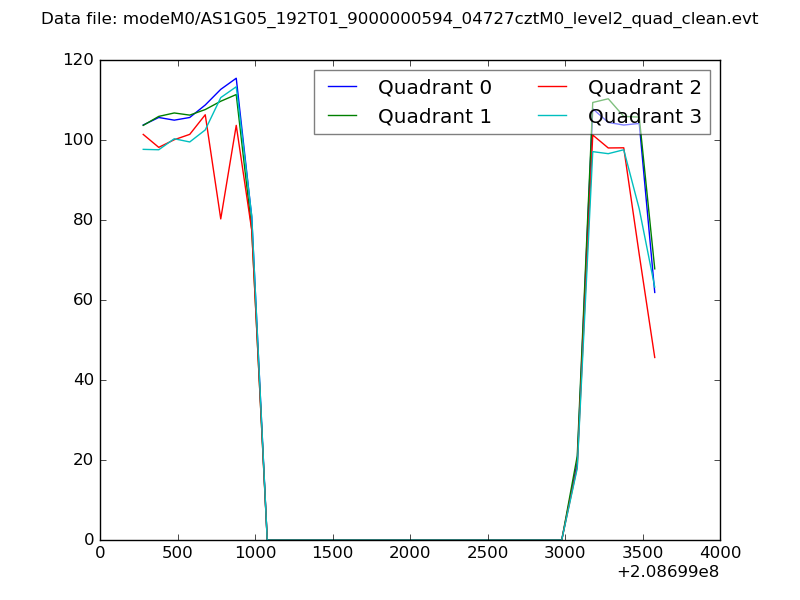 |
|
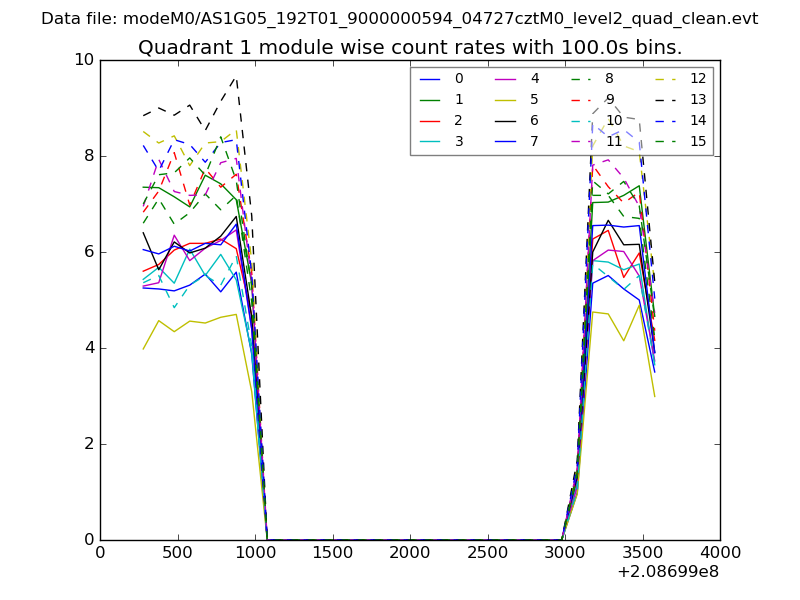
| Module-wise count rates for Quadrant A Data is divided into 100 sec bins |
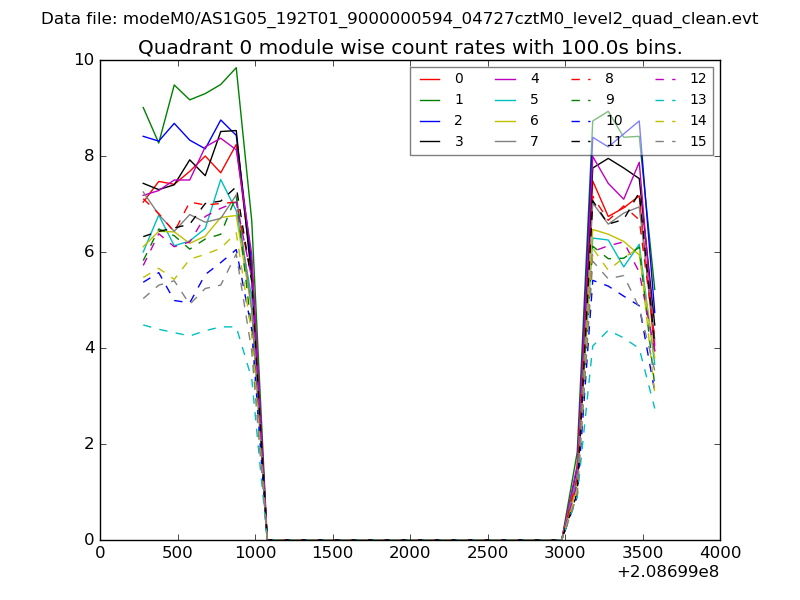 |
 |
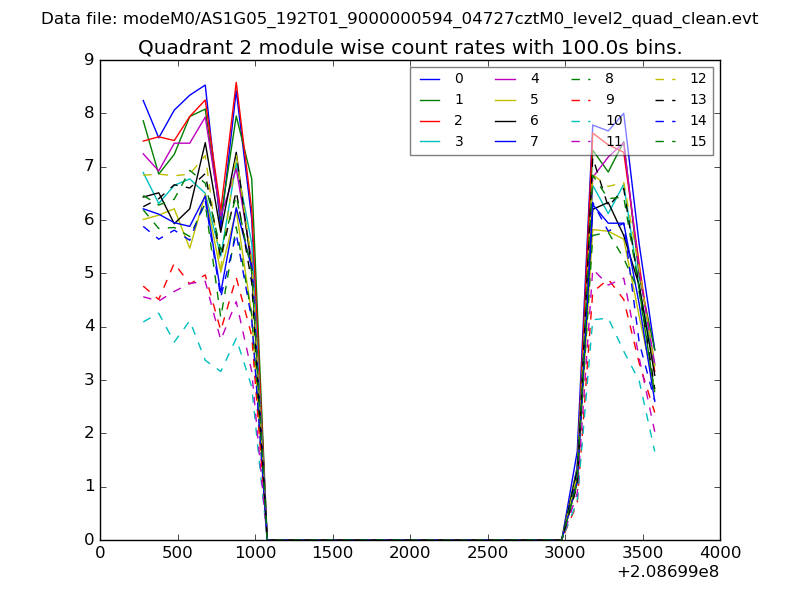
| Module-wise count rates for Quadrant B Data is divided into 100 sec bins |
 |
 |
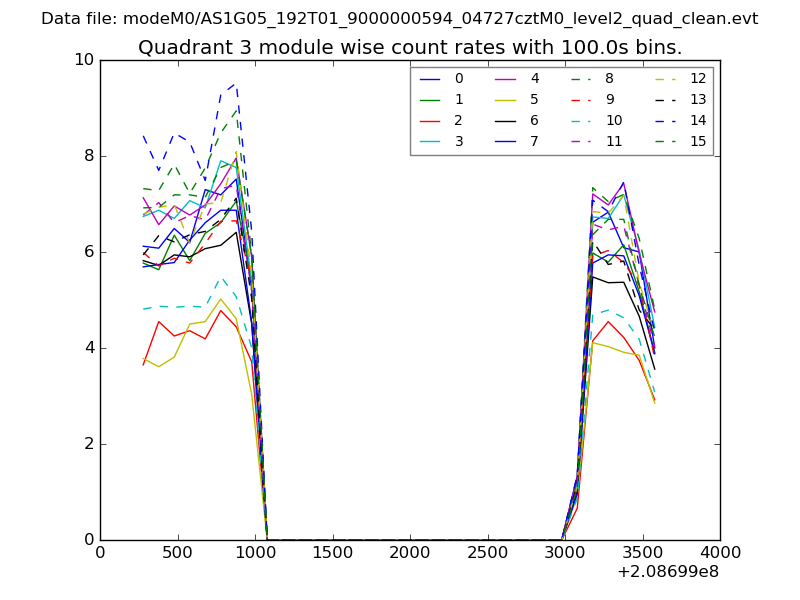
| Module-wise count rates for Quadrant C Data is divided into 100 sec bins |
 |
 |
| Module-wise count rates for Quadrant D Data is divided into 100 sec bins |
 |
 |
| Parameter | Plot |
|---|---|
| CZT HV Monitor | 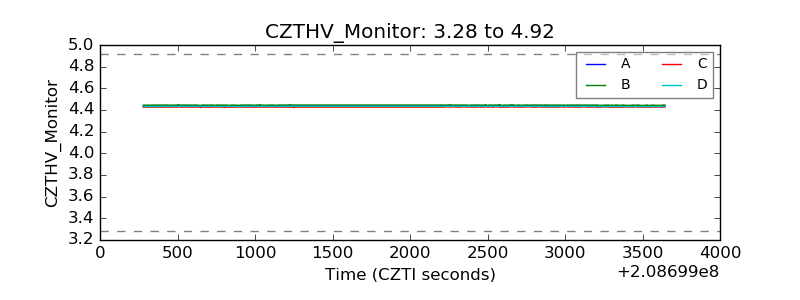 |
| D_VDD | 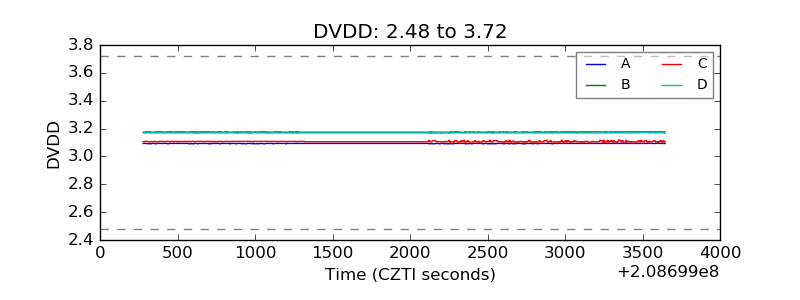 |
| Temperature 1 | 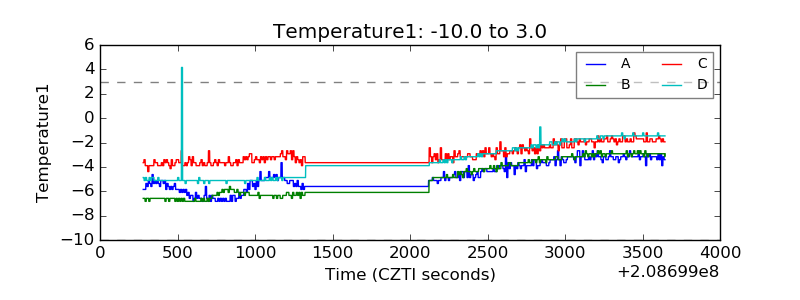 |
| Veto HV Monitor | 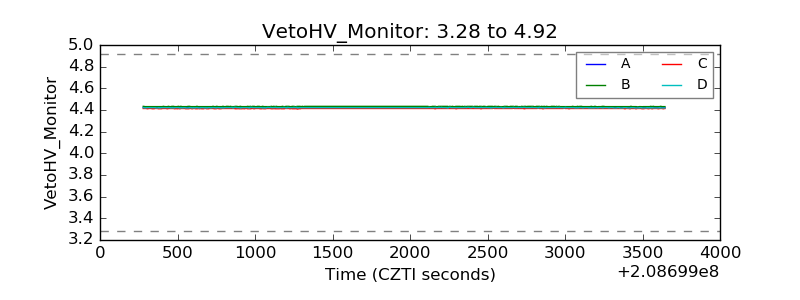 |
| Veto LLD | 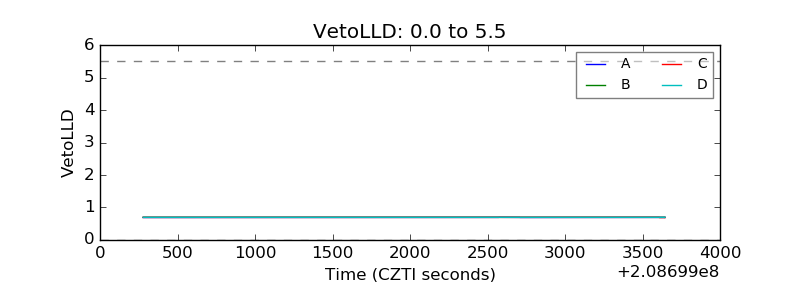 |
| Alpha Counter | 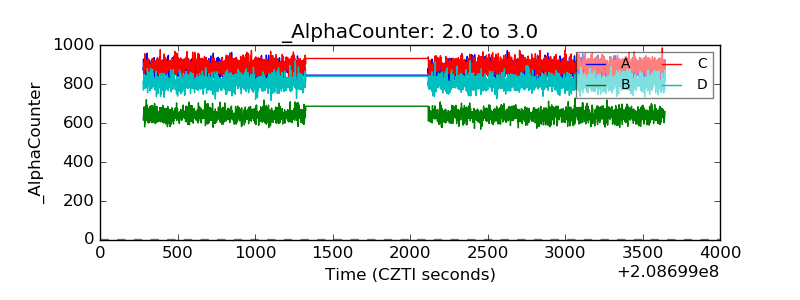 |
| _CPM_Rate | 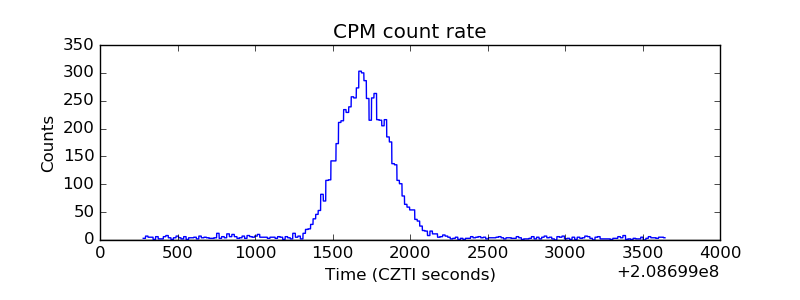 |
| CZT Counter | 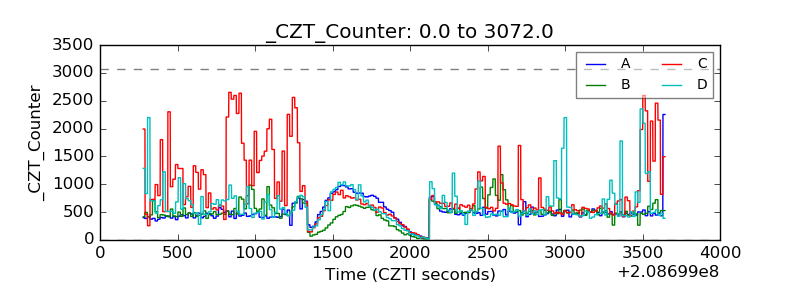 |
| +2.5 Volts monitor |  |
| +5 Volts monitor |  |
| _ROLL_ROT | 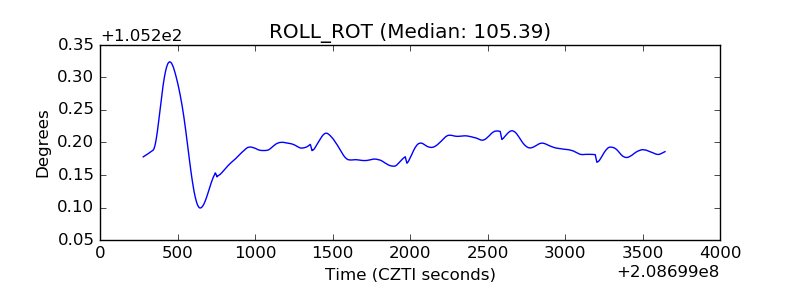 |
| _Roll_DEC | 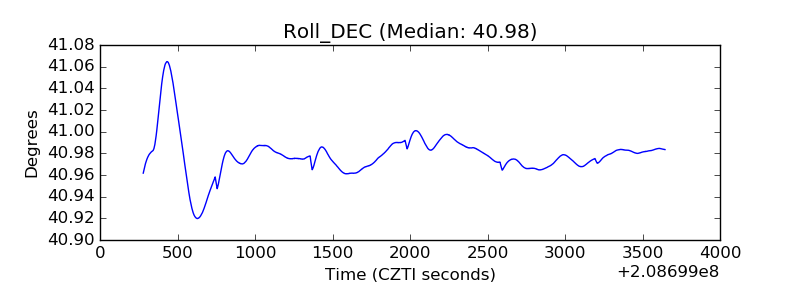 |
| _Roll_RA | 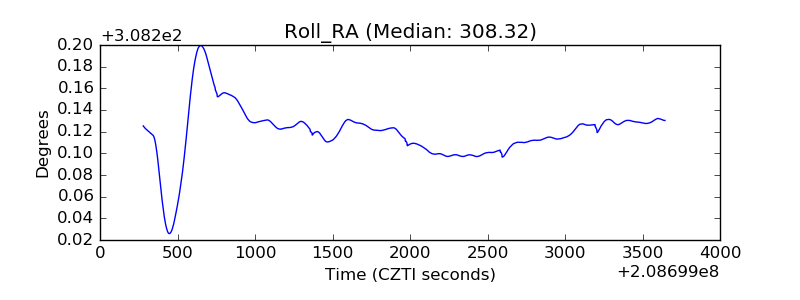 |
| Veto Counter | 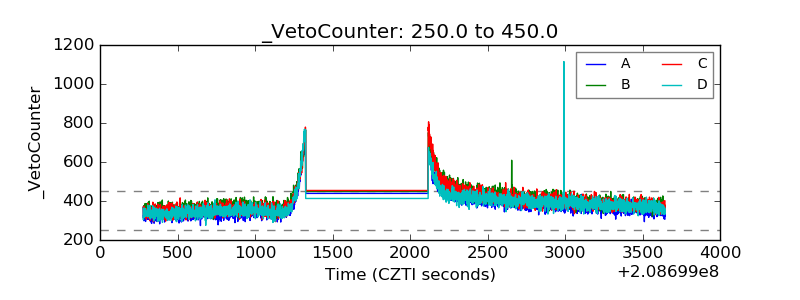 |