| Param | Original file | Final file |
|---|---|---|
| Filename | modeM0/AS1G05_192T01_9000000594_04728cztM0_level2.evt | modeM0/AS1G05_192T01_9000000594_04728cztM0_level2_quad_clean.evt |
| Size (bytes) | 579,078,720 | 73,258,560 |
| Size | 552.3 MB | 69.9 MB |
| Events in quadrant A | 3,160,195 | 460,598 |
| Events in quadrant B | 3,301,684 | 468,102 |
| Events in quadrant C | 7,215,309 | 401,912 |
| Events in quadrant D | 3,421,222 | 435,542 |
| Mode SS | |||
|---|---|---|---|
| Quadrant | BADHDUFLAG | Total packets | Discarded packets |
| A | 0 | 130 | 0 |
| B | 0 | 130 | 0 |
| C | 0 | 130 | 0 |
| D | 0 | 130 | 0 |
| Mode M9 | |||
|---|---|---|---|
| Quadrant | BADHDUFLAG | Total packets | Discarded packets |
| A | 0 | 10 | 0 |
| B | 0 | 10 | 0 |
| C | 0 | 10 | 0 |
| D | 0 | 10 | 0 |
| Mode M0 | |||
|---|---|---|---|
| Quadrant | BADHDUFLAG | Total packets | Discarded packets |
| A | 0 | 13770 | 2 |
| B | 0 | 14040 | 1 |
| C | 0 | 25765 | 1 |
| D | 0 | 14804 | 1 |
| Quadrant | Total seconds | Saturated seconds | Saturation percentage |
|---|---|---|---|
| A | 6479 | 142 | 2.191696% |
| B | 6479 | 82 | 1.265627% |
| C | 6479 | 1238 | 19.107887% |
| D | 6479 | 166 | 2.562124% |
Noise dominated data is calculated using 1-second bins in cleaned event files. If a bin has >2000 counts, and if more than 50% of those come from <1% of pixels, then it is considered to be noise-dominated and hence unusable.
| Quadrant | # 1 sec bins | Bins with >0 counts | Bins with >2000 counts | High rate bins dominated by noise | Noise dominated (total time) | Noise dominated (detector-on time) | Marked lightcurve |
|---|---|---|---|---|---|---|---|
| A | 7429 | 6479 | 67 | 67 | 0.90% | 1.03% | 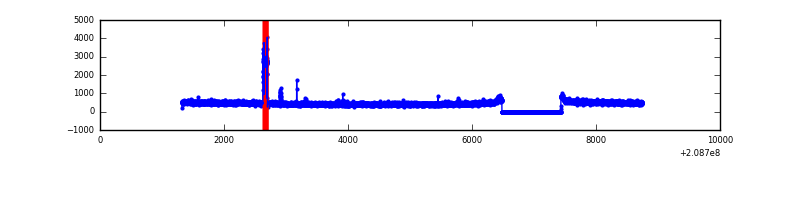 |
| B | 7429 | 6479 | 0 | 0 | 0.00% | 0.00% | 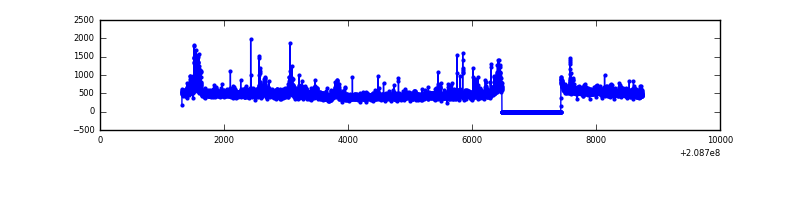 |
| C | 7429 | 6479 | 1030 | 1030 | 13.86% | 15.90% | 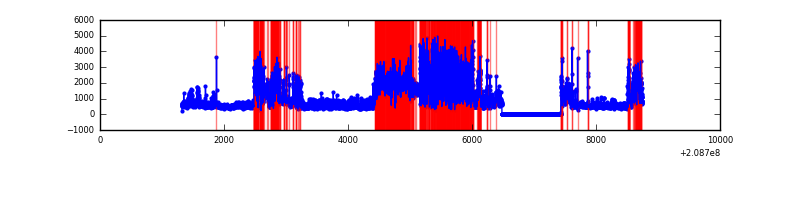 |
| D | 7429 | 6480 | 67 | 67 | 0.90% | 1.03% | 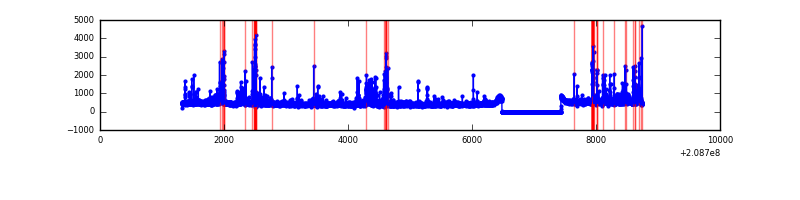 |
Top three noisy pixels from each quadrant. If the there are fewer than three noisy pixels in the level2.evt file, extra rows are filled as -1
| Pixel properties | Quadrant properties | ||||||
|---|---|---|---|---|---|---|---|
| Quadrant | DetID | PixID | Counts | Sigma | Mean | Median | Sigma |
| A | 0 | 118 | 173795 | 1113.37 | 756 | 739 | 155.4 |
| A | 8 | 15 | 36368 | 229.22 | 756 | 739 | 155.4 |
| A | 0 | 226 | 22382 | 139.24 | 756 | 739 | 155.4 |
| B | 15 | 204 | 117132 | 782.24 | 766 | 747 | 148.8 |
| B | 14 | 167 | 80900 | 538.72 | 766 | 747 | 148.8 |
| B | 4 | 80 | 67761 | 450.41 | 766 | 747 | 148.8 |
| C | 14 | 48 | 3573715 | 22224.07 | 692 | 694 | 160.8 |
| C | 8 | 208 | 909443 | 5652.39 | 692 | 694 | 160.8 |
| C | 8 | 128 | 16844 | 100.45 | 692 | 694 | 160.8 |
| D | 13 | 235 | 233786 | 1309.9 | 732 | 709 | 177.9 |
| D | 2 | 136 | 158004 | 884.01 | 732 | 709 | 177.9 |
| D | 13 | 137 | 152687 | 854.12 | 732 | 709 | 177.9 |
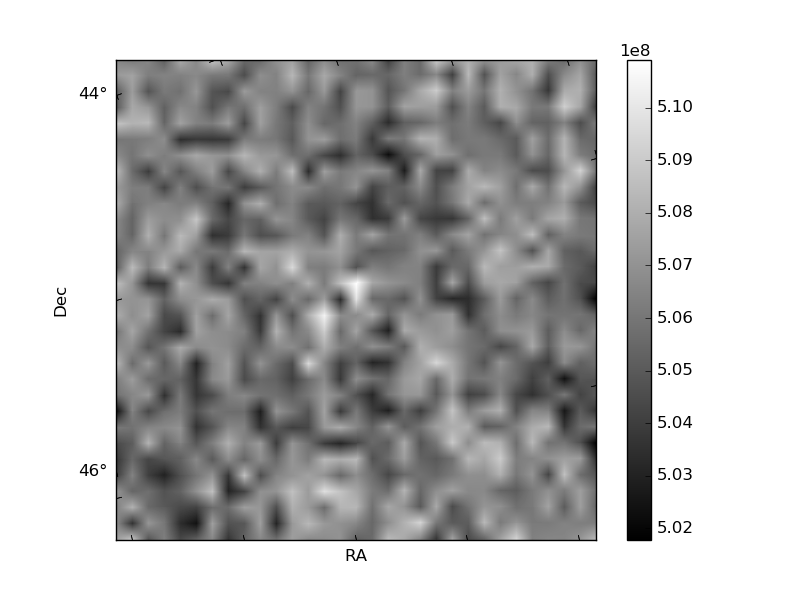
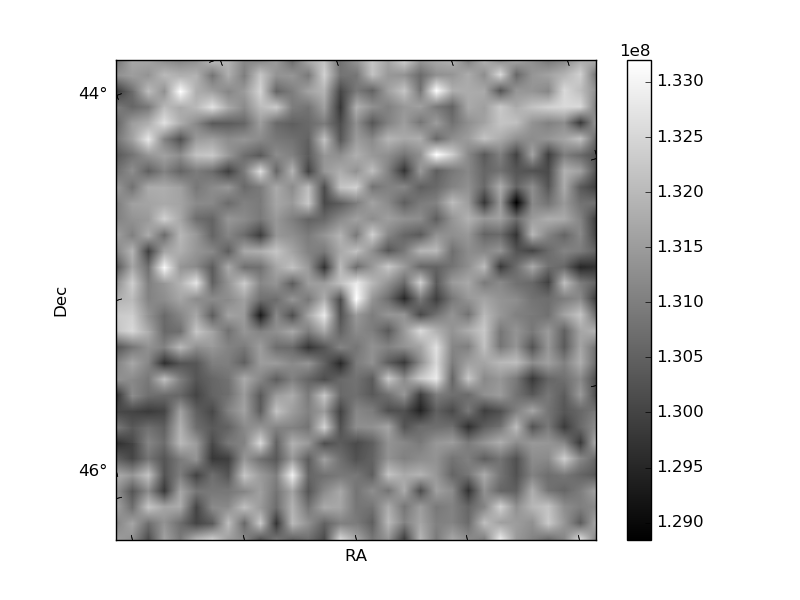
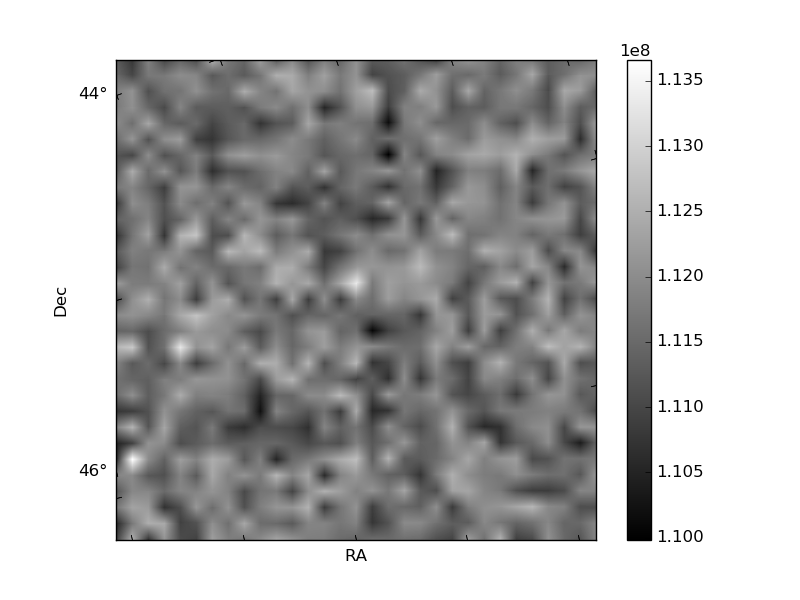
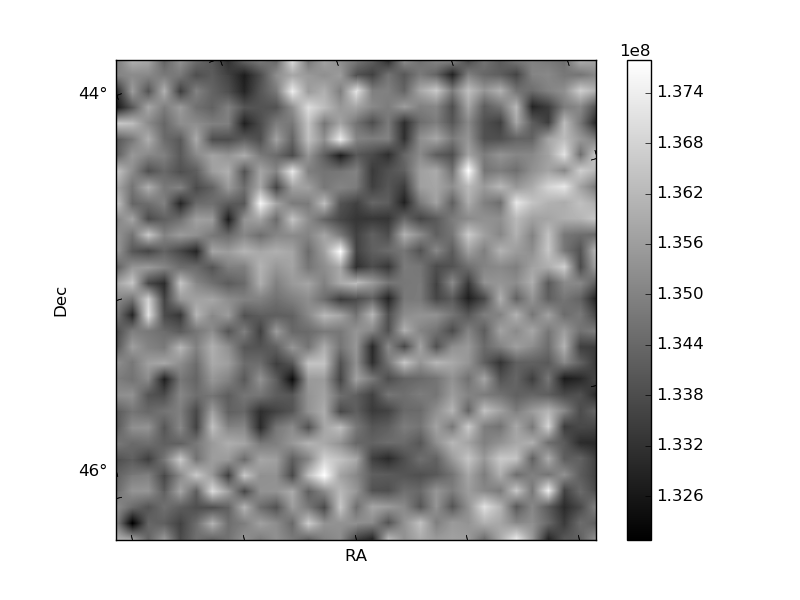
Histogram calculated using DETX and DETY for each event in the final _common_clean file
| Quadrant A | 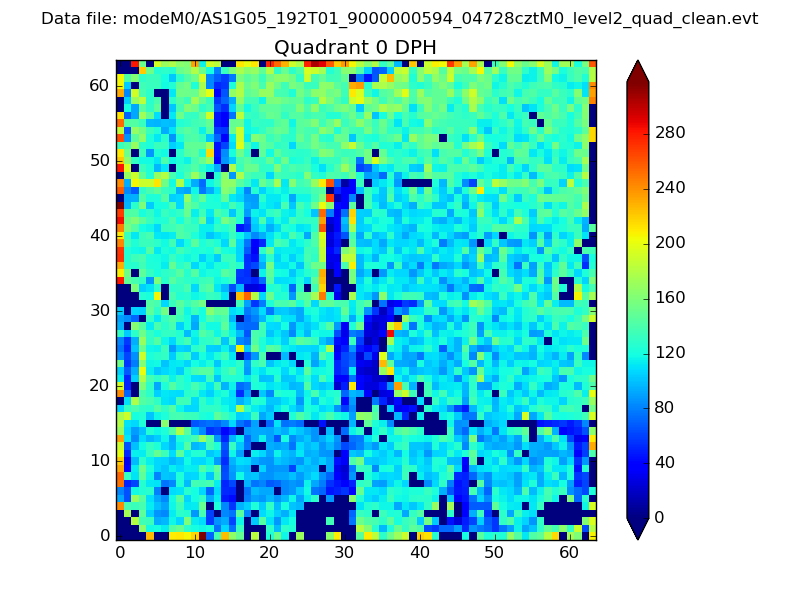 |
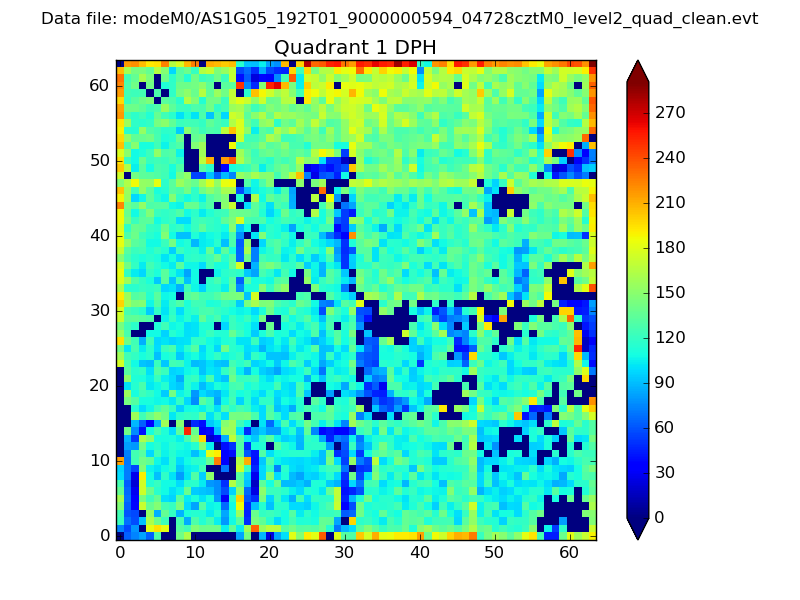 |
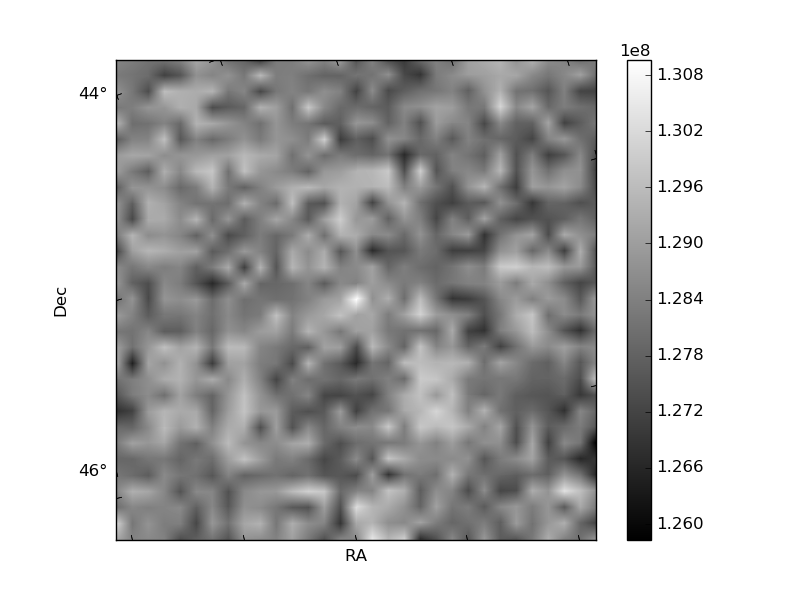
Quadrant B |
|---|---|---|---|
| Quadrant D | 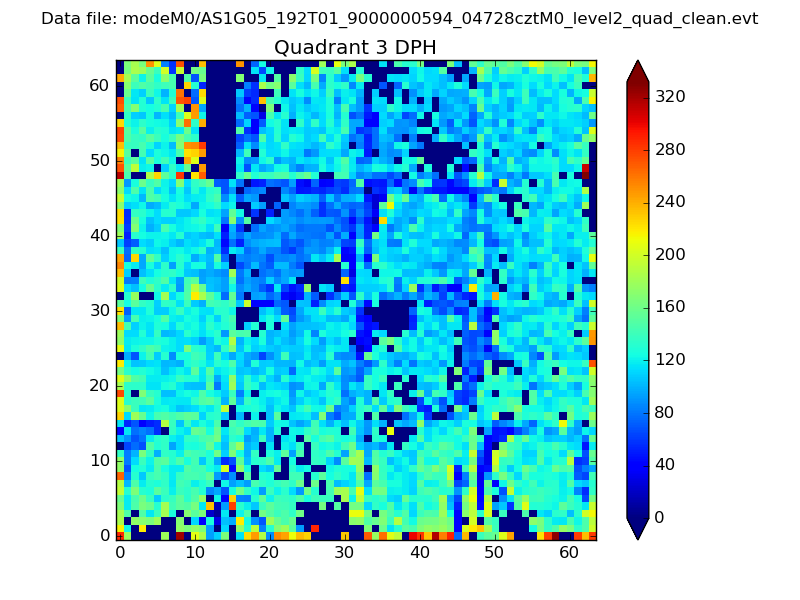 |
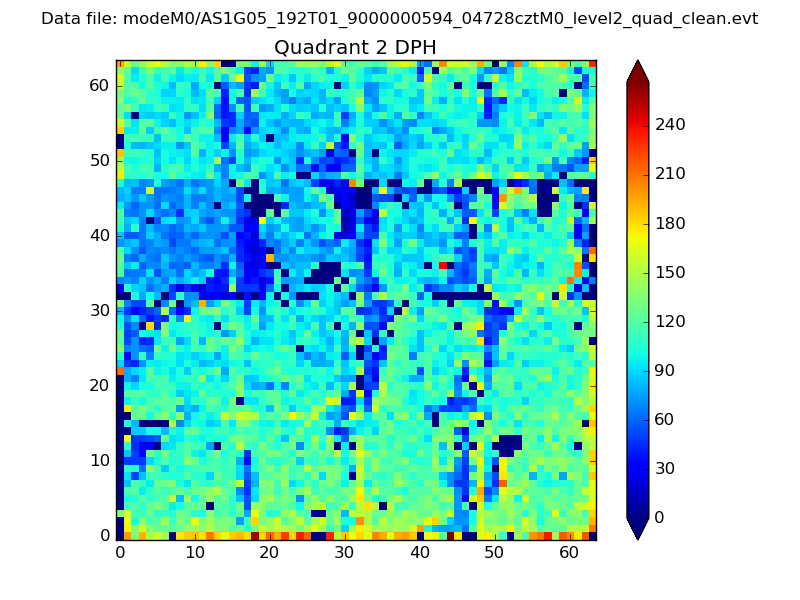 |
Quadrant C |
| Plot type | Count rate plots | Images |
|---|---|---|
| Comparison with Poisson distribution Blue bars denote a histogram of data divided into 1 sec bins. Red curve is a Poisson curve with rate = median count rate of data. |
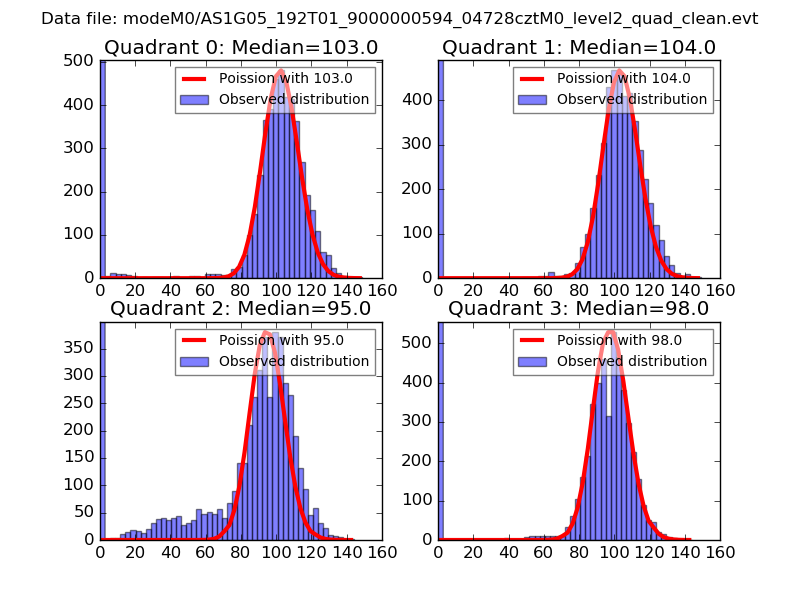 |
 |
| Quadrant-wise count rates Data is divided into 100 sec bins |
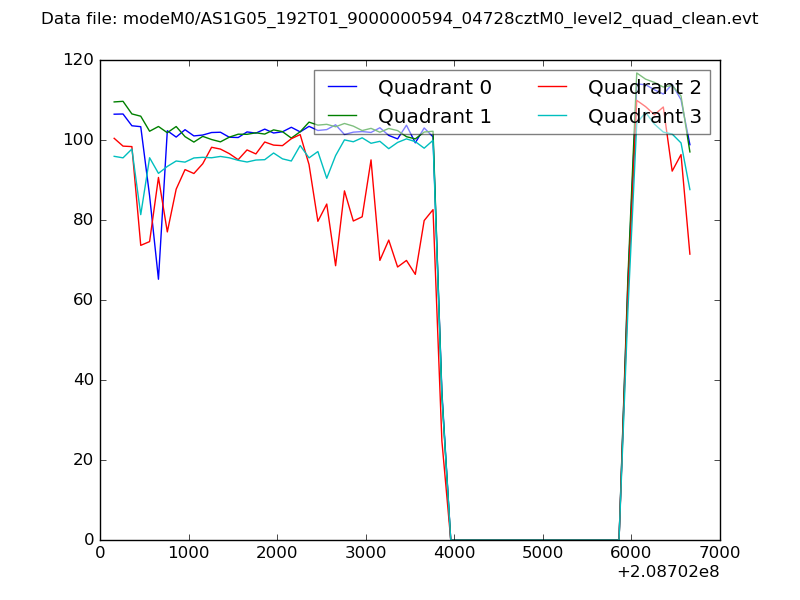 |
|
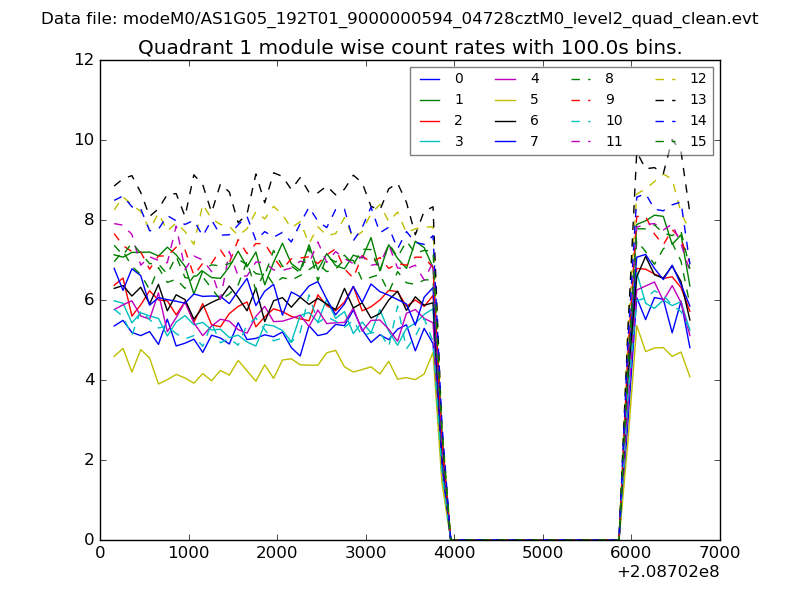
| Module-wise count rates for Quadrant A Data is divided into 100 sec bins |
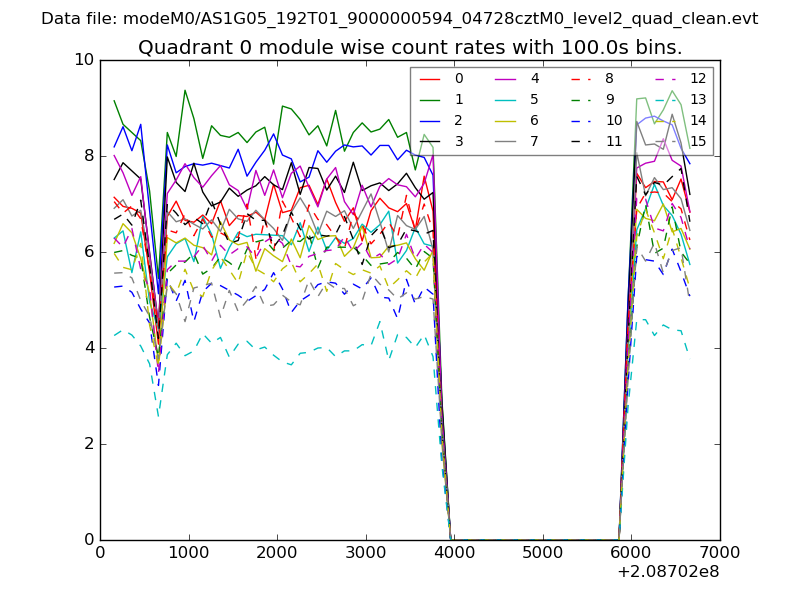 |
 |
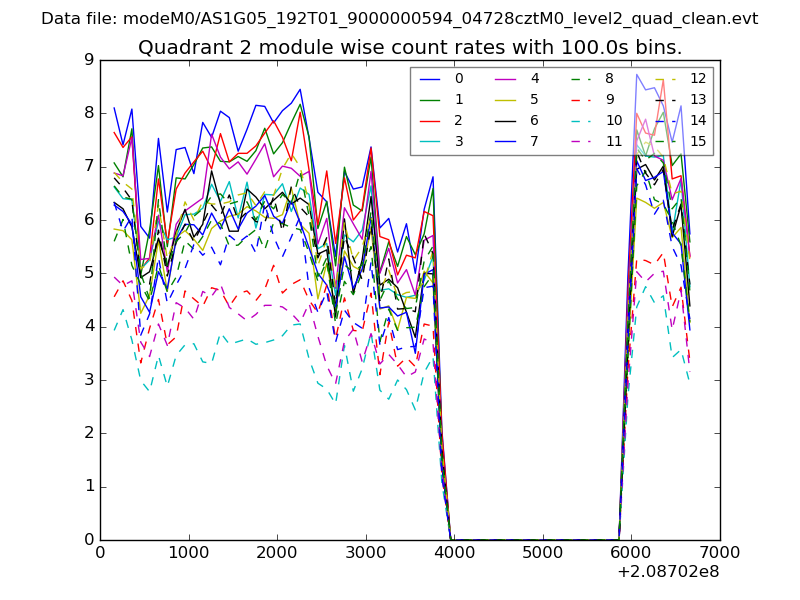
| Module-wise count rates for Quadrant B Data is divided into 100 sec bins |
 |
 |
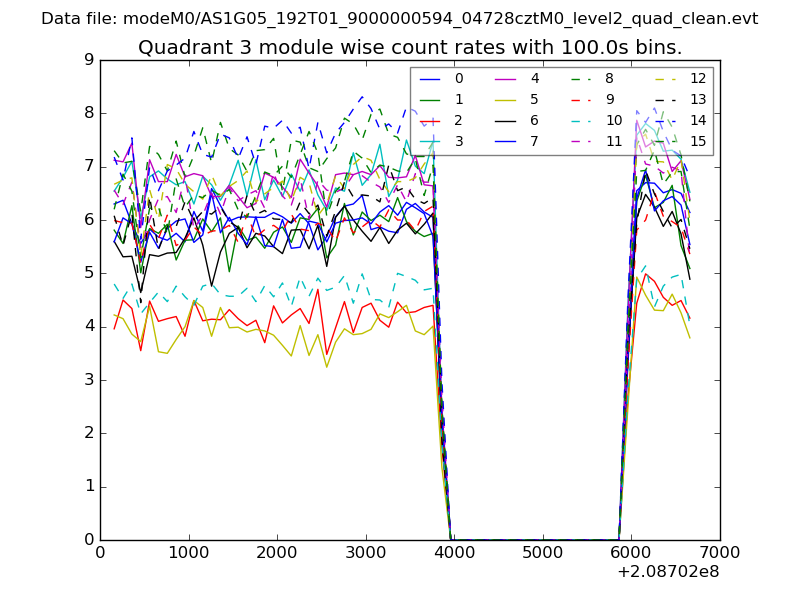
| Module-wise count rates for Quadrant C Data is divided into 100 sec bins |
 |
 |
| Module-wise count rates for Quadrant D Data is divided into 100 sec bins |
 |
 |
| Parameter | Plot |
|---|---|
| CZT HV Monitor | 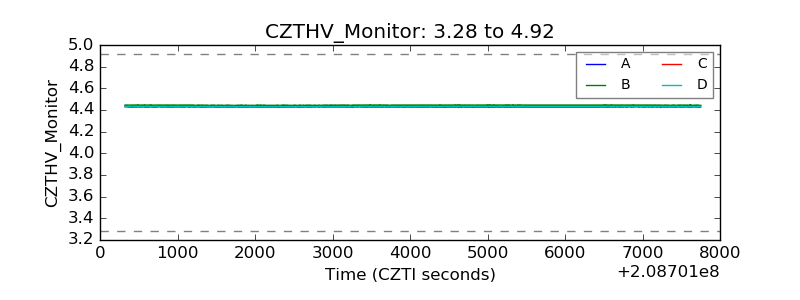 |
| D_VDD | 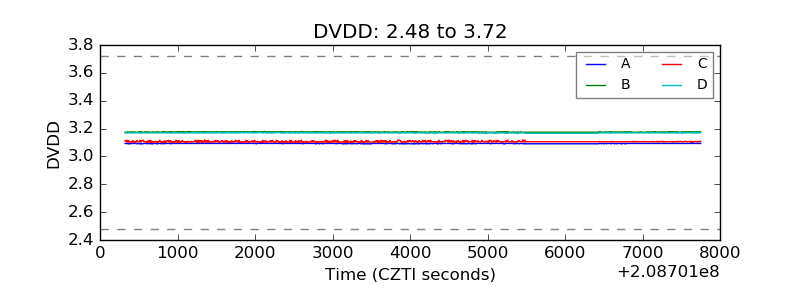 |
| Temperature 1 | 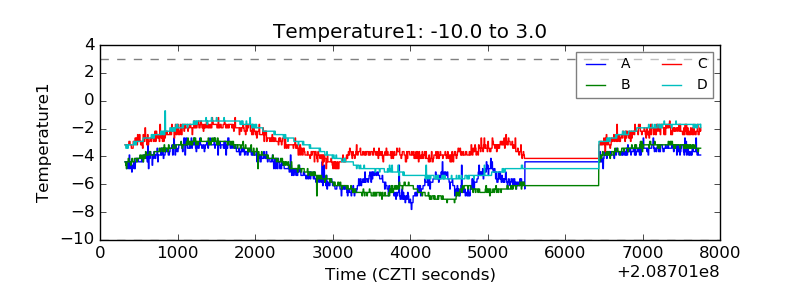 |
| Veto HV Monitor | 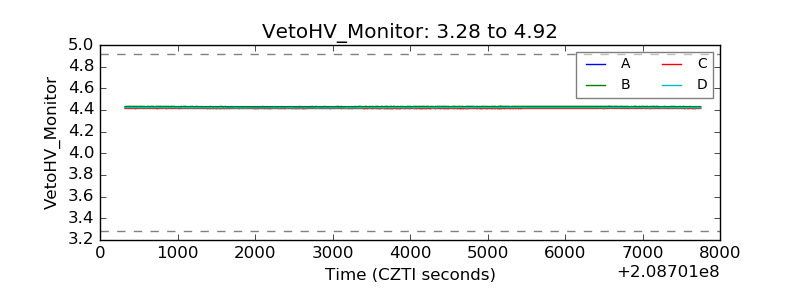 |
| Veto LLD | 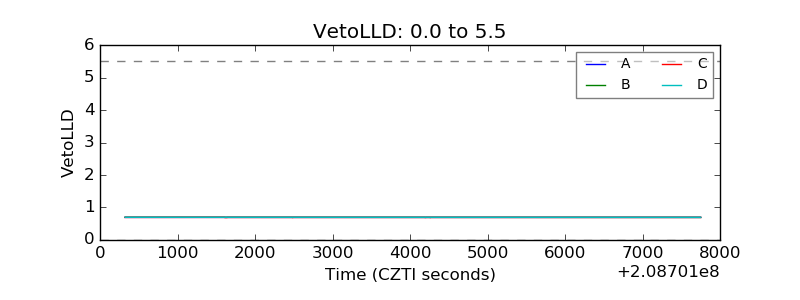 |
| Alpha Counter | 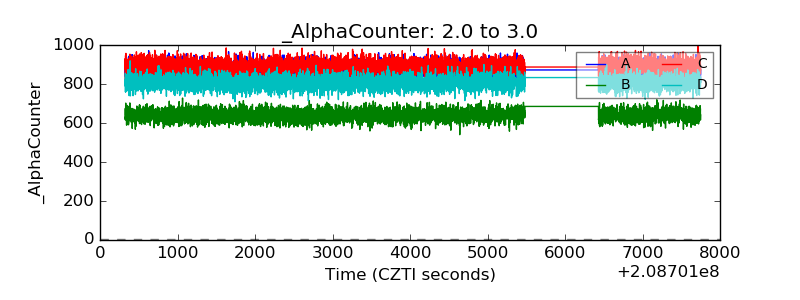 |
| _CPM_Rate | 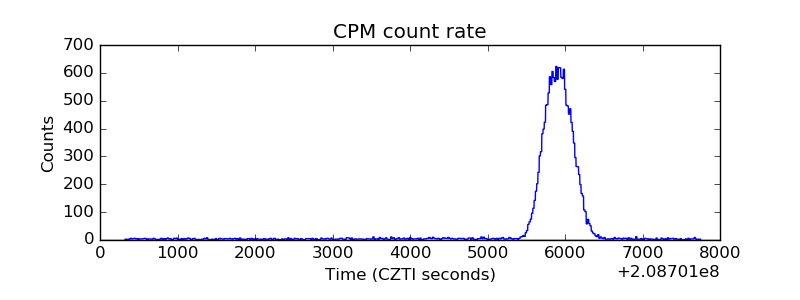 |
| CZT Counter | 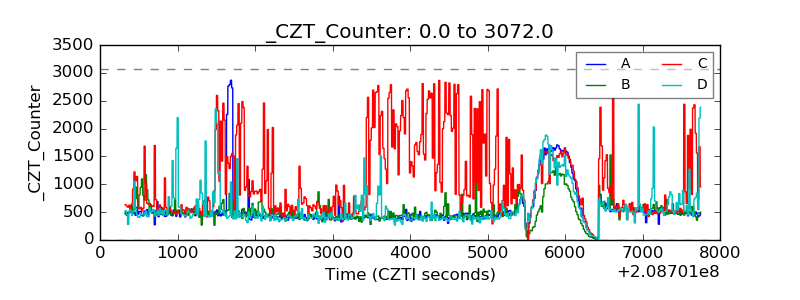 |
| +2.5 Volts monitor |  |
| +5 Volts monitor |  |
| _ROLL_ROT | 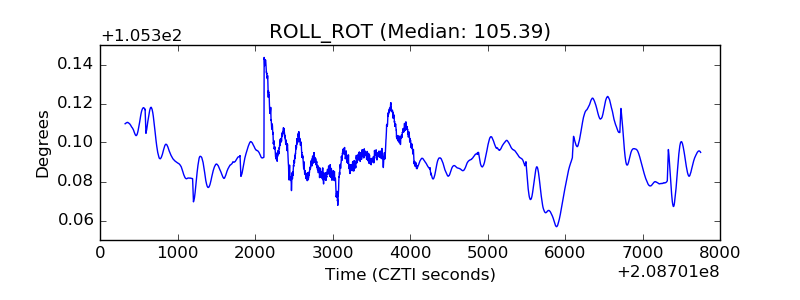 |
| _Roll_DEC | 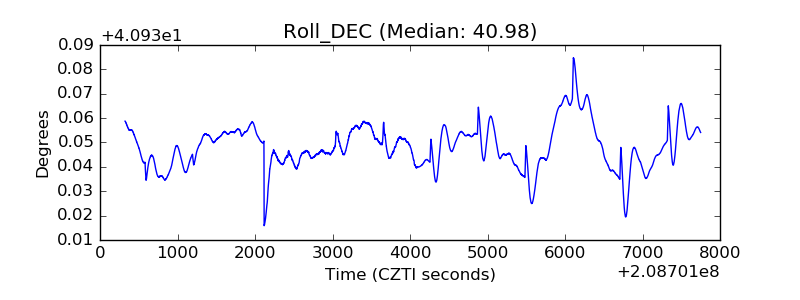 |
| _Roll_RA | 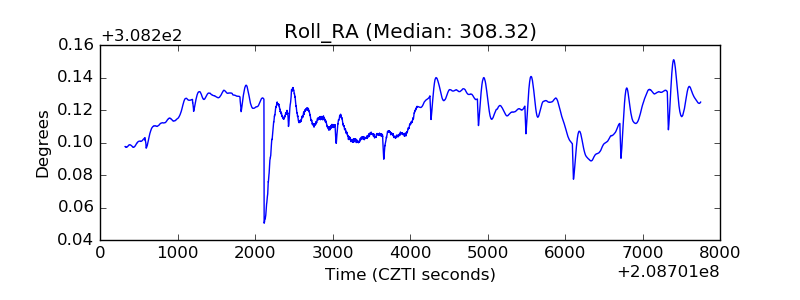 |
| Veto Counter | 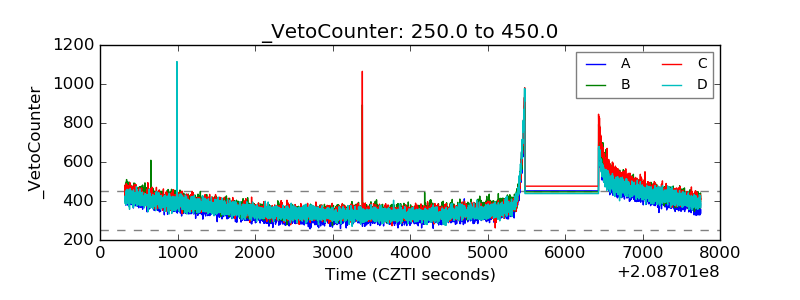 |