| Param | Original file | Final file |
|---|---|---|
| Filename | modeM0/AS1G05_192T01_9000000594_04731cztM0_level2.evt | modeM0/AS1G05_192T01_9000000594_04731cztM0_level2_quad_clean.evt |
| Size (bytes) | 594,426,240 | 84,381,120 |
| Size | 566.9 MB | 80.5 MB |
| Events in quadrant A | 2,884,557 | 576,368 |
| Events in quadrant B | 3,226,177 | 579,775 |
| Events in quadrant C | 7,823,716 | 429,779 |
| Events in quadrant D | 3,649,319 | 537,575 |
| Mode SS | |||
|---|---|---|---|
| Quadrant | BADHDUFLAG | Total packets | Discarded packets |
| A | 0 | 126 | 0 |
| B | 0 | 126 | 0 |
| C | 0 | 126 | 0 |
| D | 0 | 126 | 0 |
| Mode M9 | |||
|---|---|---|---|
| Quadrant | BADHDUFLAG | Total packets | Discarded packets |
| A | 0 | 12 | 0 |
| B | 0 | 12 | 0 |
| C | 0 | 12 | 0 |
| D | 0 | 12 | 0 |
| Mode M0 | |||
|---|---|---|---|
| Quadrant | BADHDUFLAG | Total packets | Discarded packets |
| A | 0 | 12786 | 2 |
| B | 0 | 13797 | 1 |
| C | 0 | 27463 | 1 |
| D | 0 | 15263 | 1 |
| Quadrant | Total seconds | Saturated seconds | Saturation percentage |
|---|---|---|---|
| A | 6170 | 27 | 0.437601% |
| B | 6170 | 90 | 1.458671% |
| C | 6170 | 1811 | 29.351702% |
| D | 6170 | 209 | 3.387358% |
Noise dominated data is calculated using 1-second bins in cleaned event files. If a bin has >2000 counts, and if more than 50% of those come from <1% of pixels, then it is considered to be noise-dominated and hence unusable.
| Quadrant | # 1 sec bins | Bins with >0 counts | Bins with >2000 counts | High rate bins dominated by noise | Noise dominated (total time) | Noise dominated (detector-on time) | Marked lightcurve |
|---|---|---|---|---|---|---|---|
| A | 7395 | 6171 | 0 | 0 | 0.00% | 0.00% |  |
| B | 7395 | 6171 | 42 | 42 | 0.57% | 0.68% |  |
| C | 7395 | 6171 | 1552 | 1552 | 20.99% | 25.15% |  |
| D | 7395 | 6171 | 159 | 159 | 2.15% | 2.58% |  |
Top three noisy pixels from each quadrant. If the there are fewer than three noisy pixels in the level2.evt file, extra rows are filled as -1
| Pixel properties | Quadrant properties | ||||||
|---|---|---|---|---|---|---|---|
| Quadrant | DetID | PixID | Counts | Sigma | Mean | Median | Sigma |
| A | 8 | 15 | 44396 | 292.42 | 735 | 719 | 149.4 |
| A | 0 | 226 | 7736 | 46.98 | 735 | 719 | 149.4 |
| A | 12 | 194 | 7315 | 44.16 | 735 | 719 | 149.4 |
| B | 10 | 16 | 214493 | 1527.99 | 740 | 725 | 139.9 |
| B | 14 | 167 | 95093 | 674.53 | 740 | 725 | 139.9 |
| B | 15 | 54 | 19568 | 134.69 | 740 | 725 | 139.9 |
| C | 14 | 48 | 5518689 | 40649.21 | 588 | 590 | 135.7 |
| C | 12 | 4 | 5385 | 35.32 | 588 | 590 | 135.7 |
| C | 13 | 61 | 4708 | 30.34 | 588 | 590 | 135.7 |
| D | 13 | 235 | 580997 | 3394.65 | 708 | 686 | 170.9 |
| D | 2 | 234 | 181603 | 1058.31 | 708 | 686 | 170.9 |
| D | 13 | 239 | 95490 | 554.58 | 708 | 686 | 170.9 |
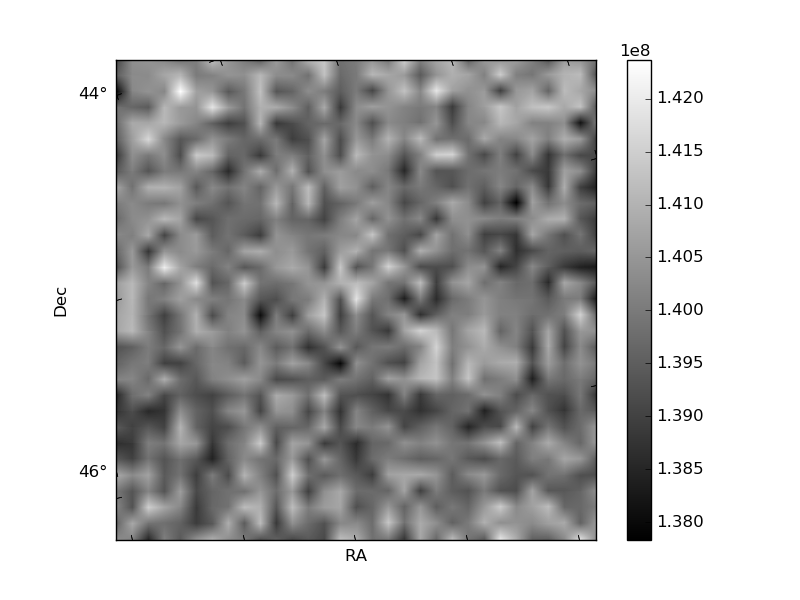
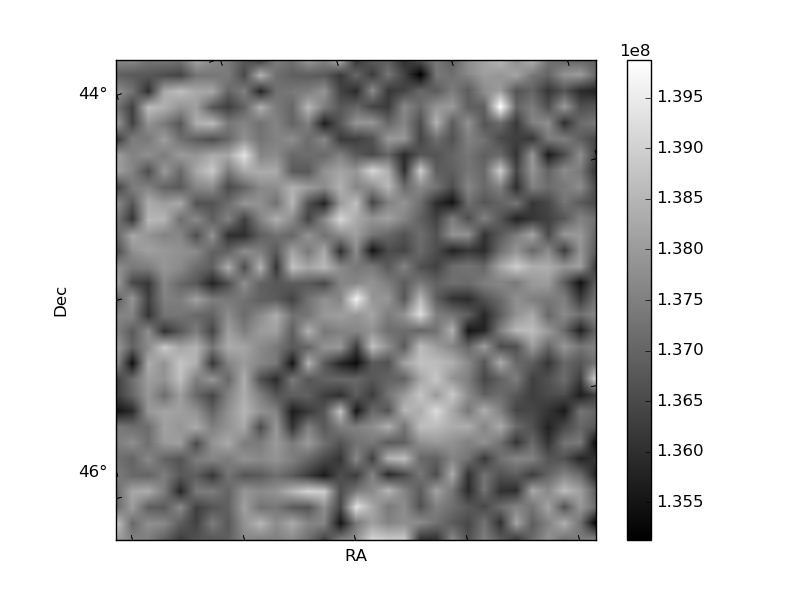
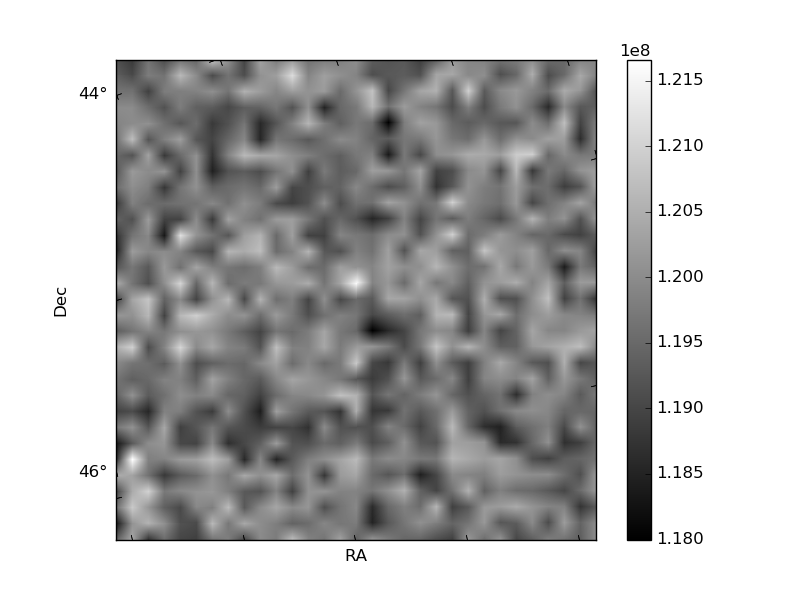
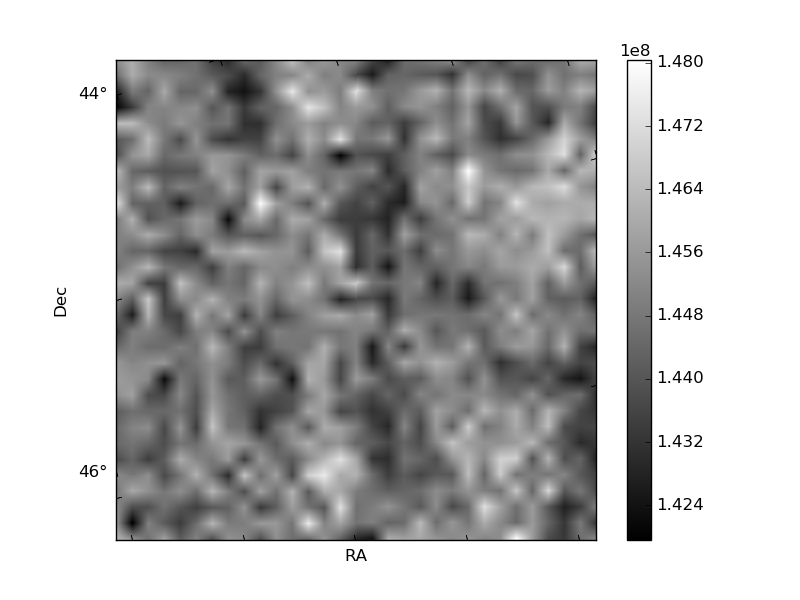
Histogram calculated using DETX and DETY for each event in the final _common_clean file
| Quadrant A | 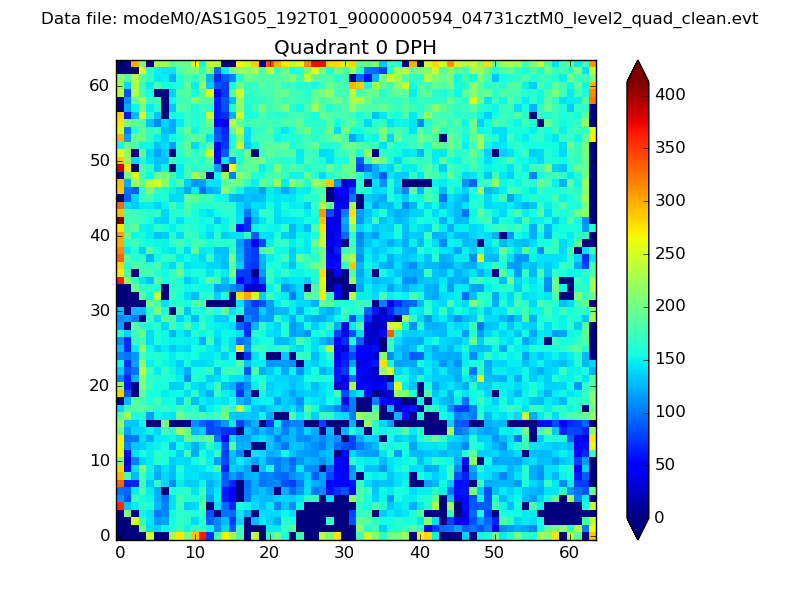 |
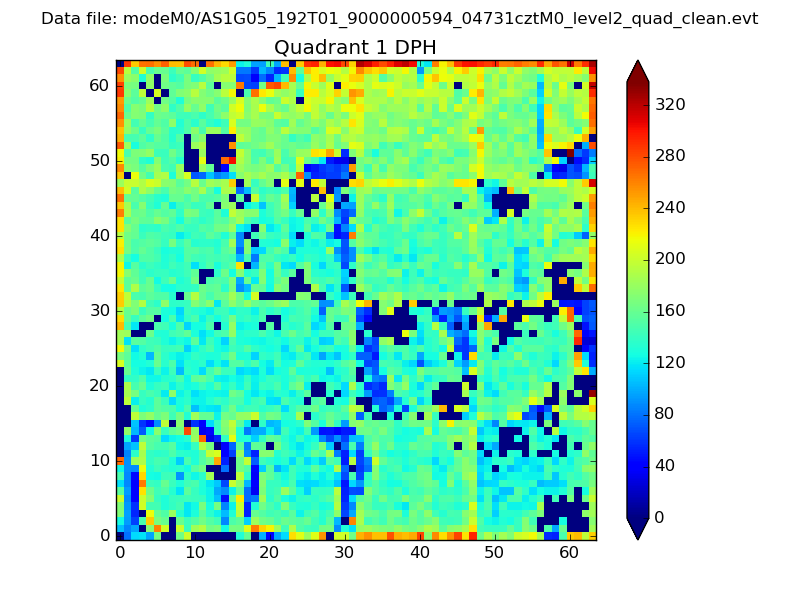 |
Quadrant B |
|---|---|---|---|
| Quadrant D | 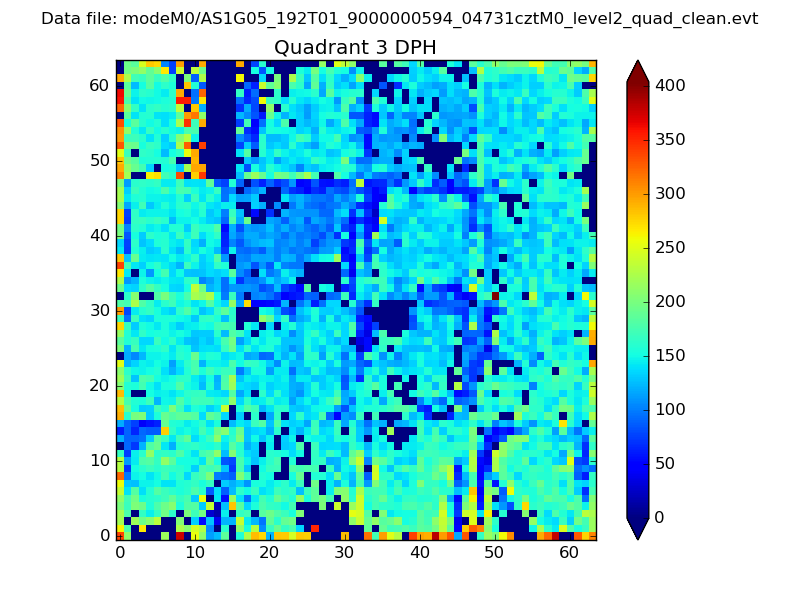 |
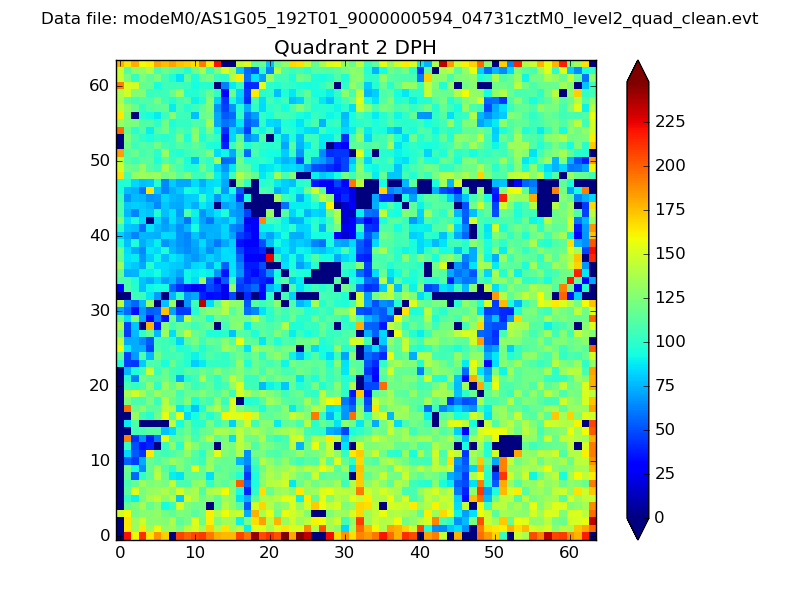 |
Quadrant C |
| Plot type | Count rate plots | Images |
|---|---|---|
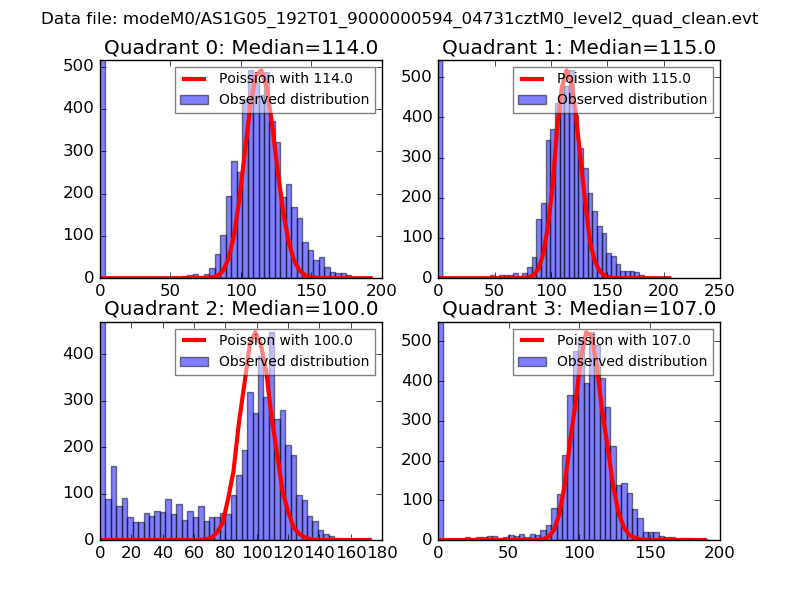
| Comparison with Poisson distribution Blue bars denote a histogram of data divided into 1 sec bins. Red curve is a Poisson curve with rate = median count rate of data. |
 |
 |
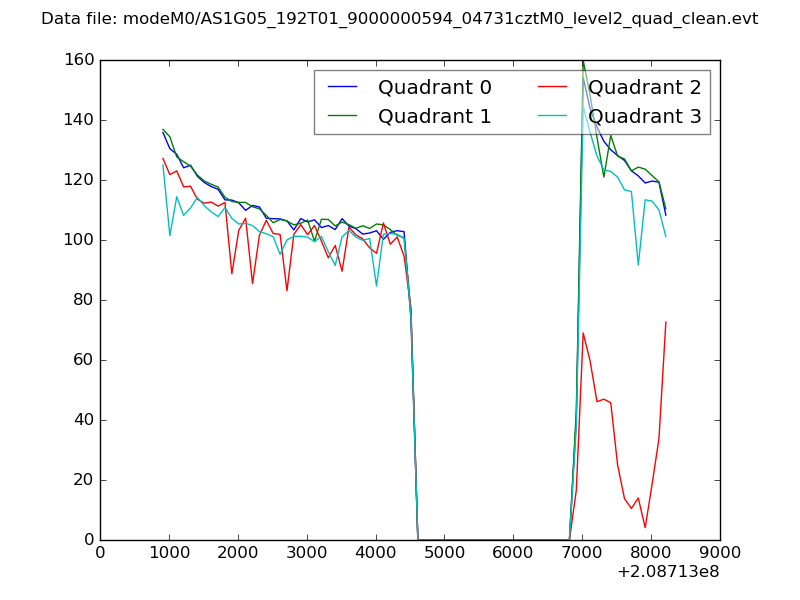
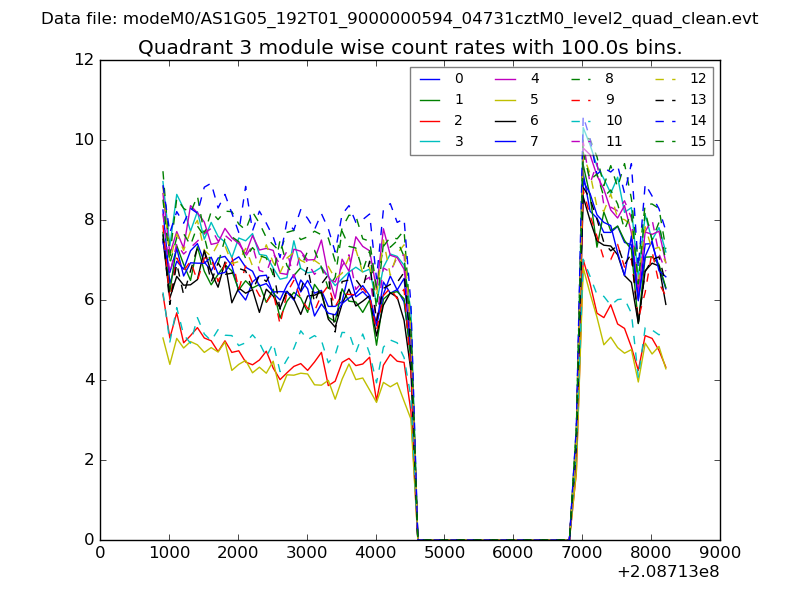
| Quadrant-wise count rates Data is divided into 100 sec bins |
 |
|
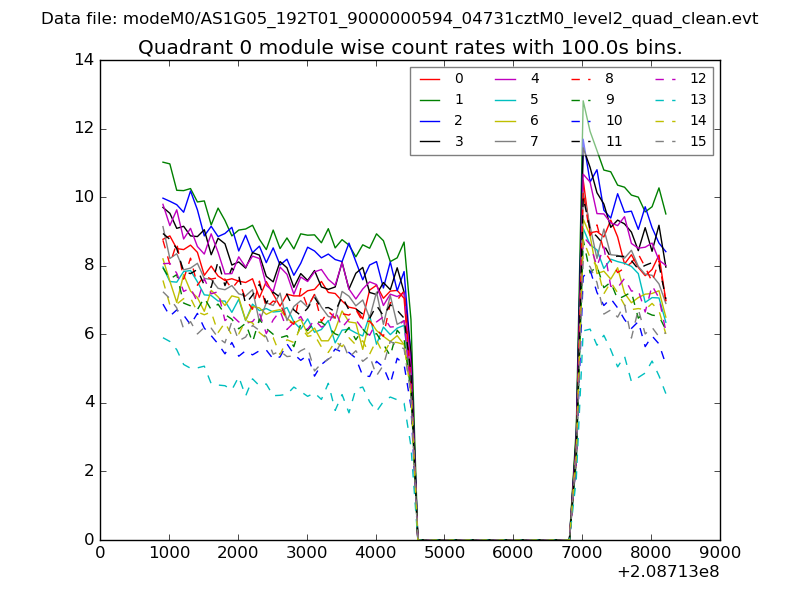
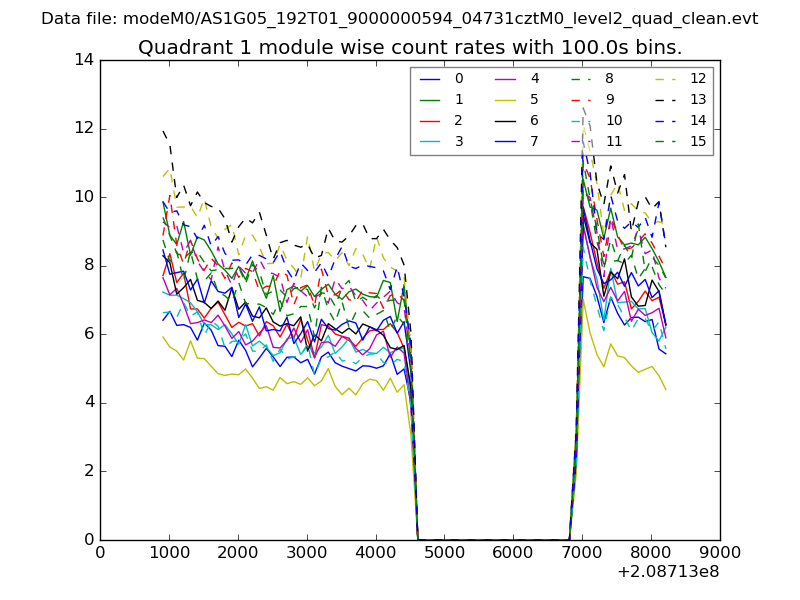
| Module-wise count rates for Quadrant A Data is divided into 100 sec bins |
 |
 |
| Module-wise count rates for Quadrant B Data is divided into 100 sec bins |
 |
 |
| Module-wise count rates for Quadrant C Data is divided into 100 sec bins |
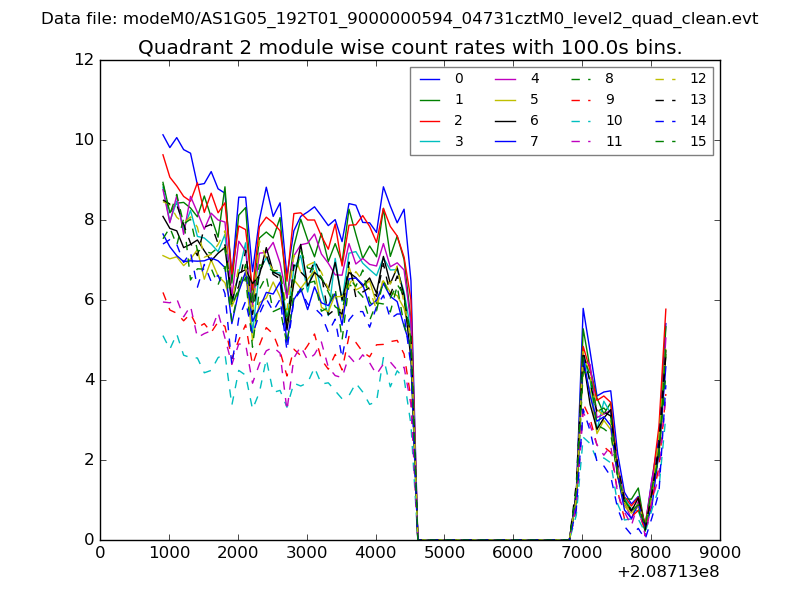 |
 |
| Module-wise count rates for Quadrant D Data is divided into 100 sec bins |
 |
 |
| Parameter | Plot |
|---|---|
| CZT HV Monitor | 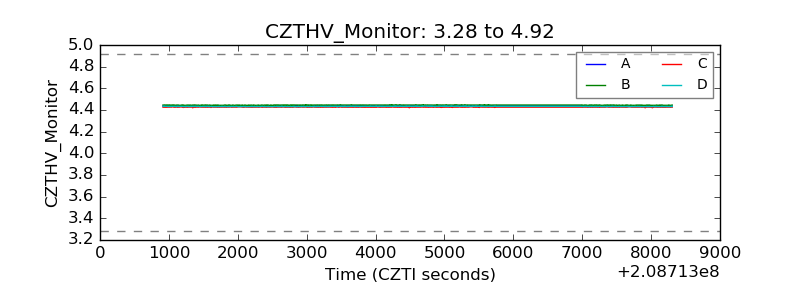 |
| D_VDD | 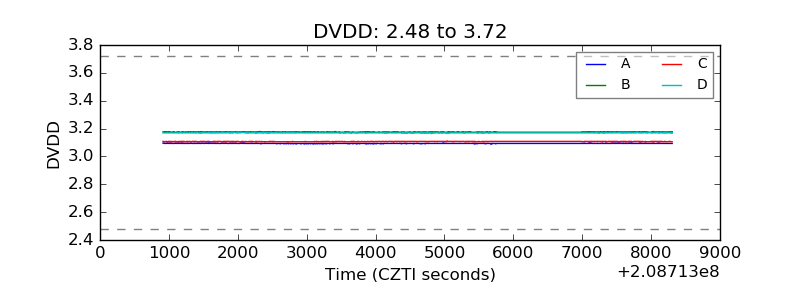 |
| Temperature 1 | 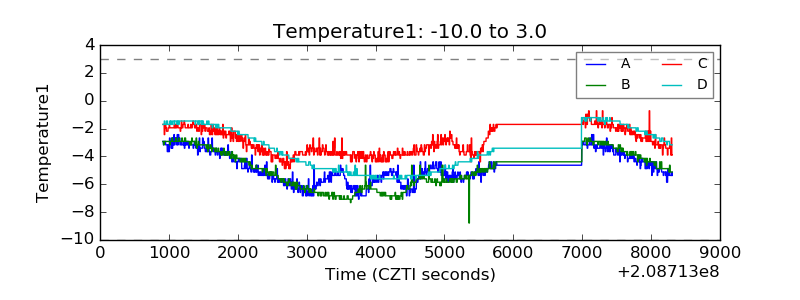 |
| Veto HV Monitor | 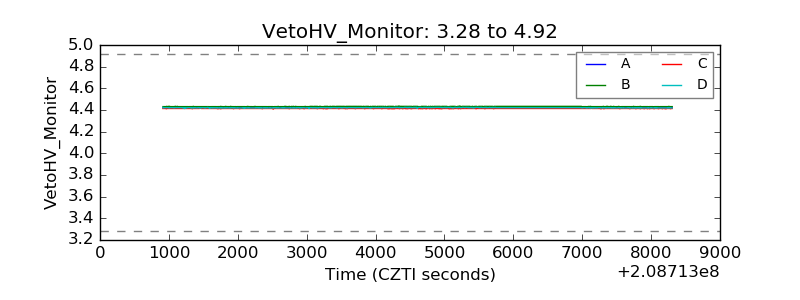 |
| Veto LLD | 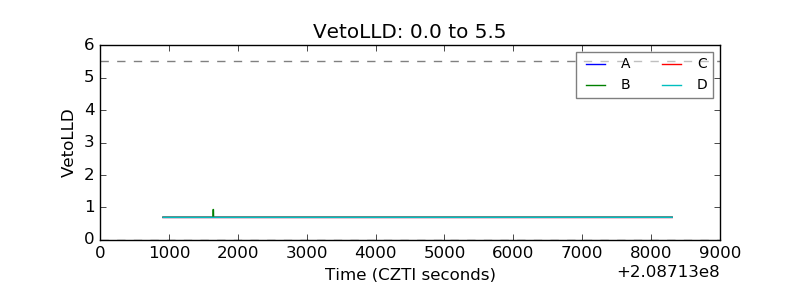 |
| Alpha Counter | 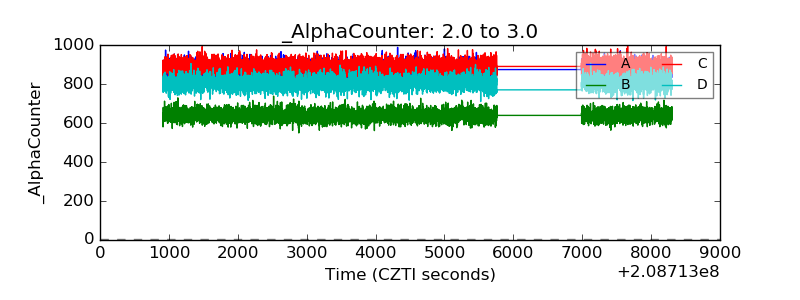 |
| _CPM_Rate | 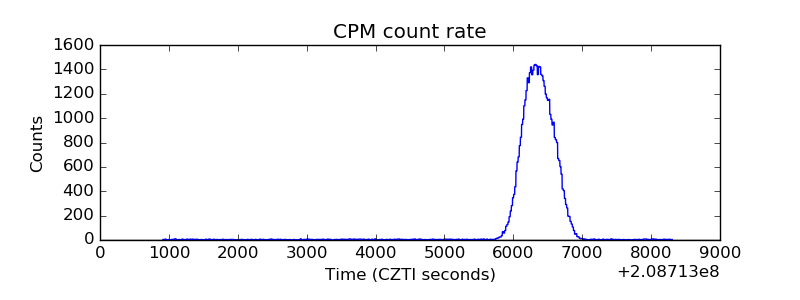 |
| CZT Counter | 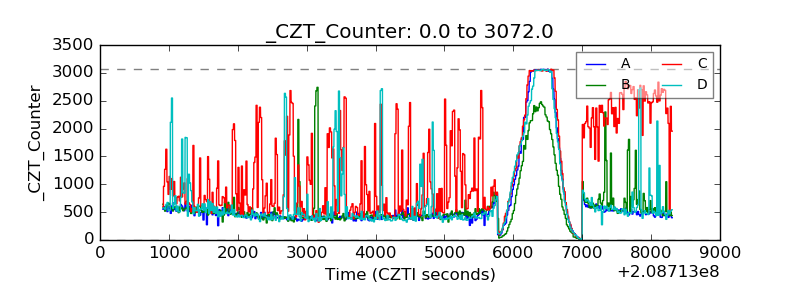 |
| +2.5 Volts monitor |  |
| +5 Volts monitor | 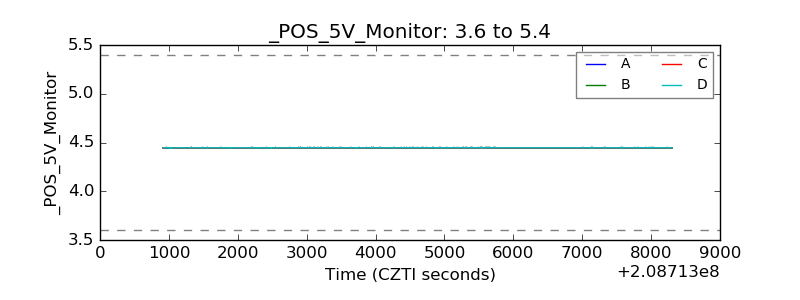 |
| _ROLL_ROT | 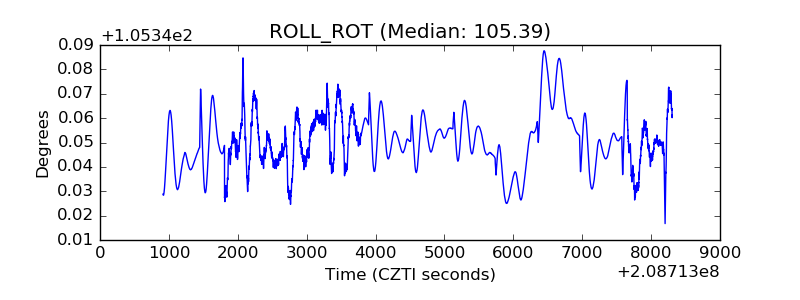 |
| _Roll_DEC |  |
| _Roll_RA | 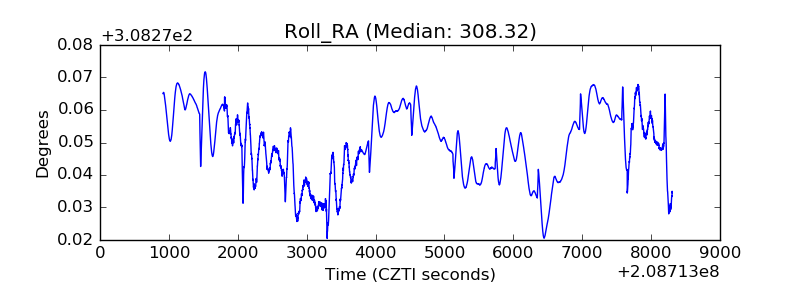 |
| Veto Counter | 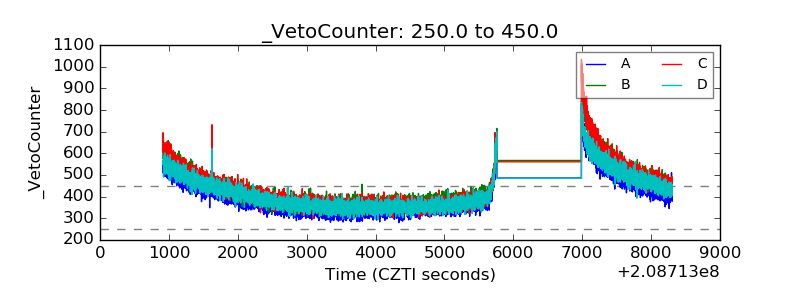 |