| Param | Original file | Final file |
|---|---|---|
| Filename | modeM0/AS1G05_192T01_9000000594_04732cztM0_level2.evt | modeM0/AS1G05_192T01_9000000594_04732cztM0_level2_quad_clean.evt |
| Size (bytes) | 775,045,440 | 67,032,000 |
| Size | 739.1 MB | 63.9 MB |
| Events in quadrant A | 2,752,413 | 506,013 |
| Events in quadrant B | 3,056,231 | 513,425 |
| Events in quadrant C | 11,767,014 | 147,212 |
| Events in quadrant D | 5,501,271 | 452,848 |
| Mode SS | |||
|---|---|---|---|
| Quadrant | BADHDUFLAG | Total packets | Discarded packets |
| A | 0 | 118 | 0 |
| B | 0 | 118 | 0 |
| C | 0 | 118 | 0 |
| D | 0 | 118 | 0 |
| Mode M9 | |||
|---|---|---|---|
| Quadrant | BADHDUFLAG | Total packets | Discarded packets |
| A | 0 | 13 | 0 |
| B | 0 | 13 | 0 |
| C | 0 | 13 | 0 |
| D | 0 | 13 | 0 |
| Mode M0 | |||
|---|---|---|---|
| Quadrant | BADHDUFLAG | Total packets | Discarded packets |
| A | 0 | 12159 | 2 |
| B | 0 | 13035 | 1 |
| C | 0 | 39055 | 1 |
| D | 0 | 20312 | 1 |
| Quadrant | Total seconds | Saturated seconds | Saturation percentage |
|---|---|---|---|
| A | 5843 | 23 | 0.393633% |
| B | 5843 | 56 | 0.958412% |
| C | 5843 | 4269 | 73.061783% |
| D | 5843 | 1078 | 18.449427% |
Noise dominated data is calculated using 1-second bins in cleaned event files. If a bin has >2000 counts, and if more than 50% of those come from <1% of pixels, then it is considered to be noise-dominated and hence unusable.
| Quadrant | # 1 sec bins | Bins with >0 counts | Bins with >2000 counts | High rate bins dominated by noise | Noise dominated (total time) | Noise dominated (detector-on time) | Marked lightcurve |
|---|---|---|---|---|---|---|---|
| A | 7138 | 5844 | 0 | 0 | 0.00% | 0.00% | 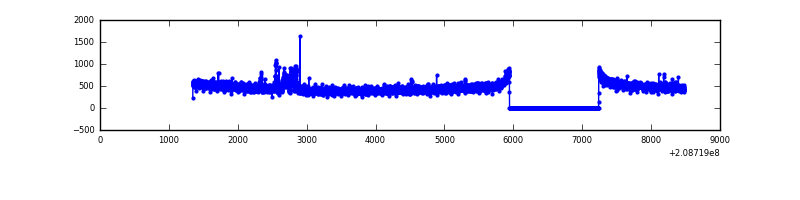 |
| B | 7138 | 5844 | 16 | 16 | 0.22% | 0.27% | 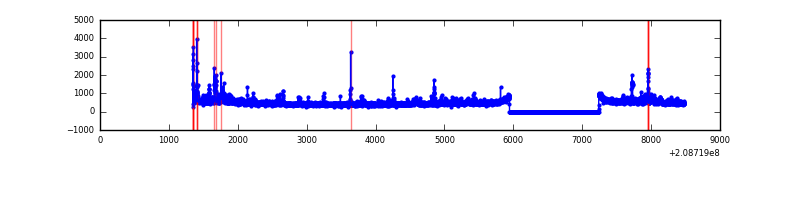 |
| C | 7138 | 5844 | 3555 | 3555 | 49.80% | 60.83% | 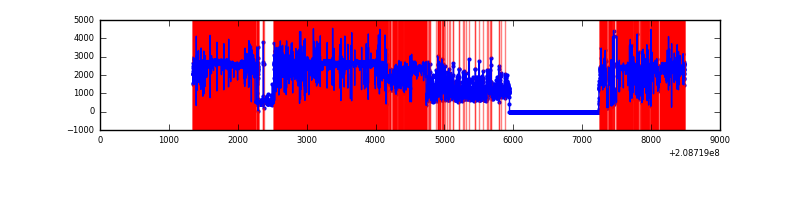 |
| D | 7138 | 5844 | 883 | 883 | 12.37% | 15.11% | 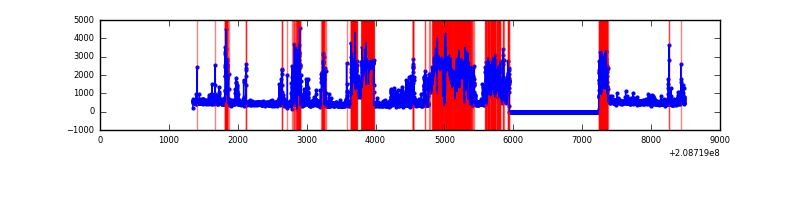 |
Top three noisy pixels from each quadrant. If the there are fewer than three noisy pixels in the level2.evt file, extra rows are filled as -1
| Pixel properties | Quadrant properties | ||||||
|---|---|---|---|---|---|---|---|
| Quadrant | DetID | PixID | Counts | Sigma | Mean | Median | Sigma |
| A | 0 | 118 | 65763 | 464.96 | 693 | 680 | 140.0 |
| A | 0 | 226 | 13155 | 89.12 | 693 | 680 | 140.0 |
| A | 12 | 194 | 6909 | 44.5 | 693 | 680 | 140.0 |
| B | 14 | 167 | 130159 | 984.25 | 702 | 686 | 131.5 |
| B | 10 | 16 | 88906 | 670.64 | 702 | 686 | 131.5 |
| B | 15 | 204 | 58095 | 436.42 | 702 | 686 | 131.5 |
| C | 14 | 48 | 10494833 | 140319.02 | 321 | 322 | 74.8 |
| C | 12 | 4 | 19630 | 258.16 | 321 | 322 | 74.8 |
| C | 13 | 61 | 2532 | 29.55 | 321 | 322 | 74.8 |
| D | 13 | 53 | 1189488 | 7848.25 | 623 | 603 | 151.5 |
| D | 13 | 235 | 1016497 | 6706.28 | 623 | 603 | 151.5 |
| D | 2 | 63 | 641503 | 4230.81 | 623 | 603 | 151.5 |
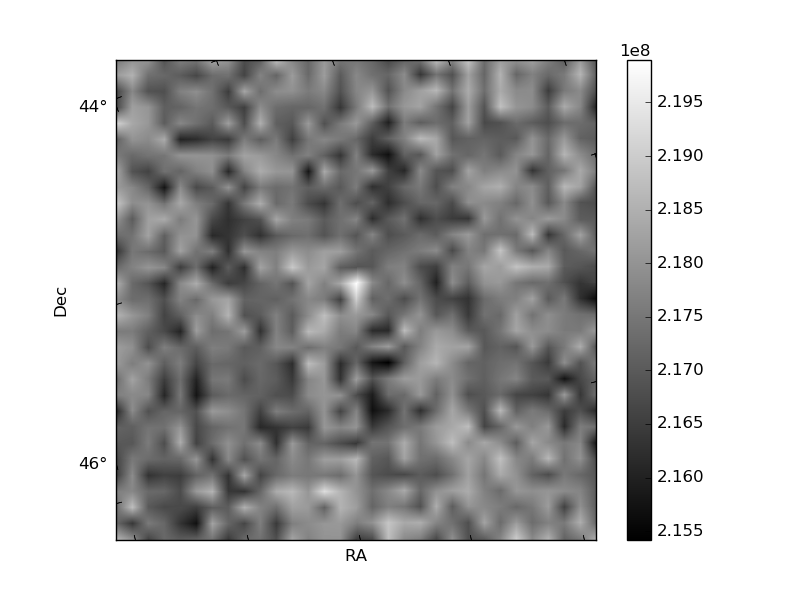
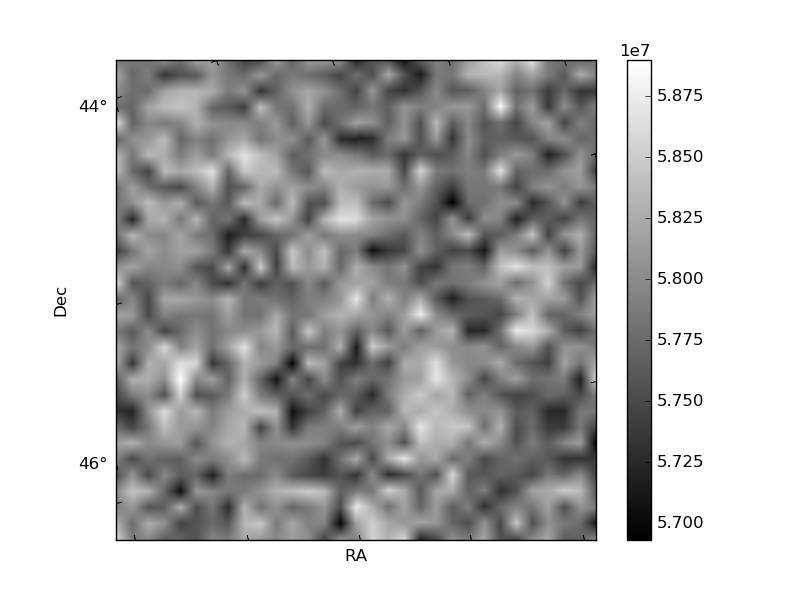
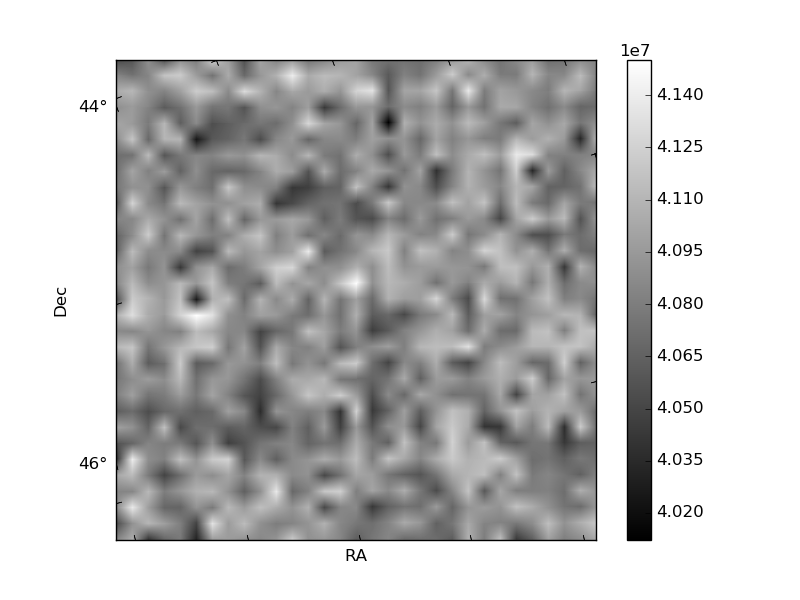
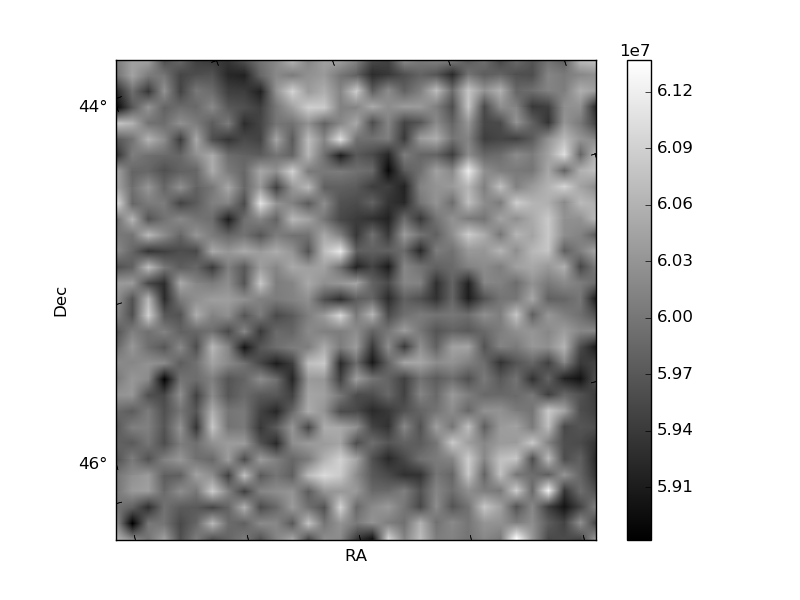
Histogram calculated using DETX and DETY for each event in the final _common_clean file
| Quadrant A | 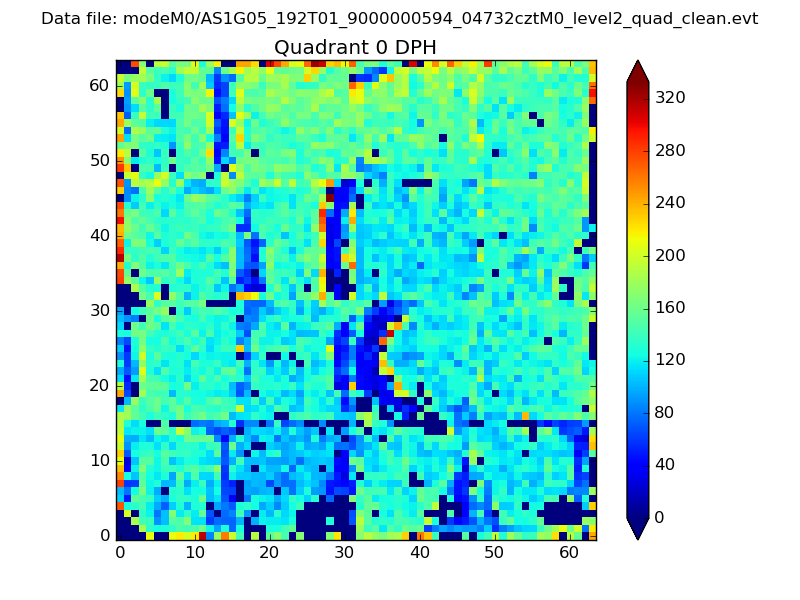 |
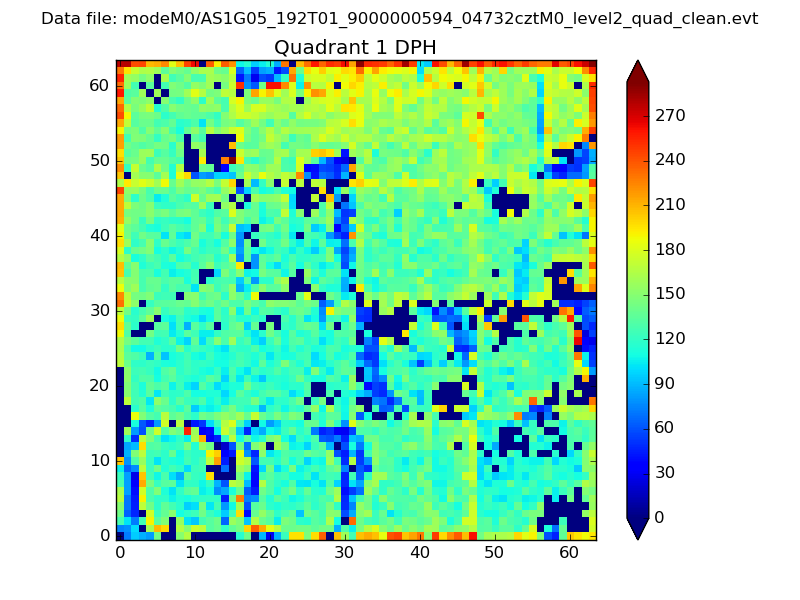 |
Quadrant B |
|---|---|---|---|
| Quadrant D | 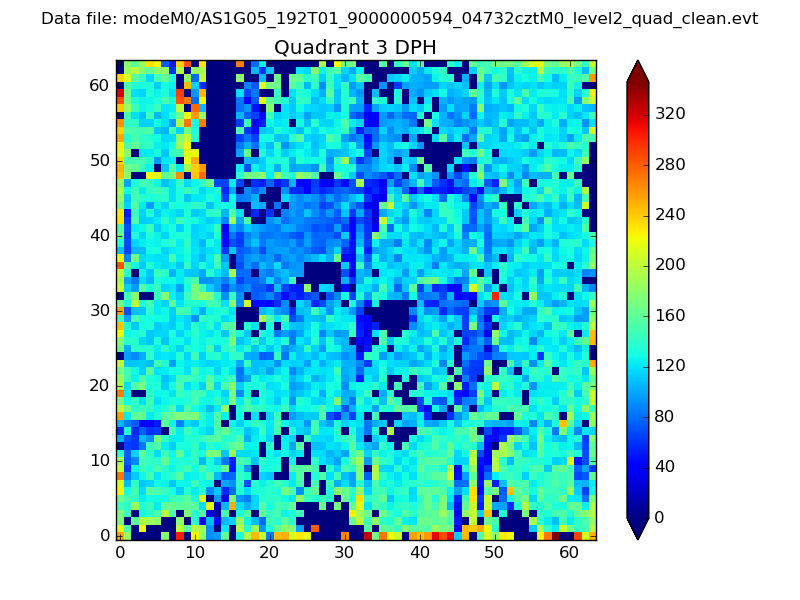 |
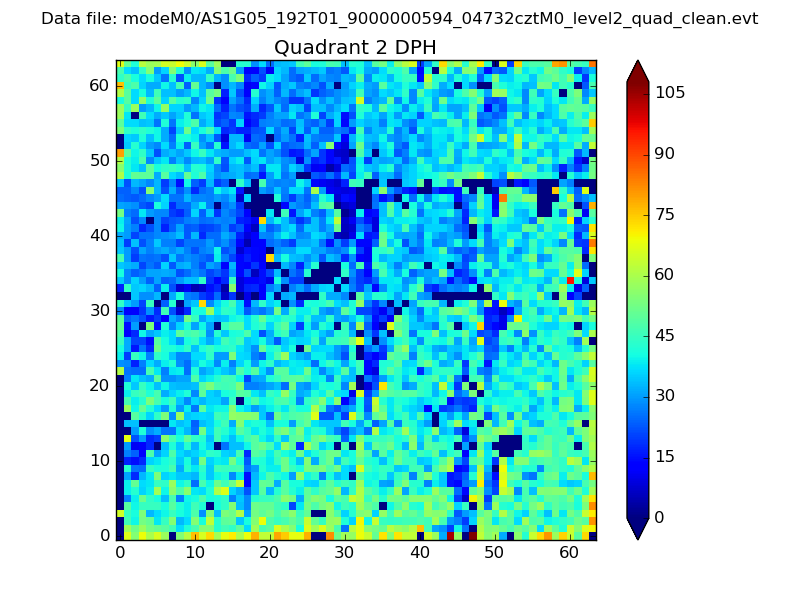 |
Quadrant C |
| Plot type | Count rate plots | Images |
|---|---|---|
| Comparison with Poisson distribution Blue bars denote a histogram of data divided into 1 sec bins. Red curve is a Poisson curve with rate = median count rate of data. |
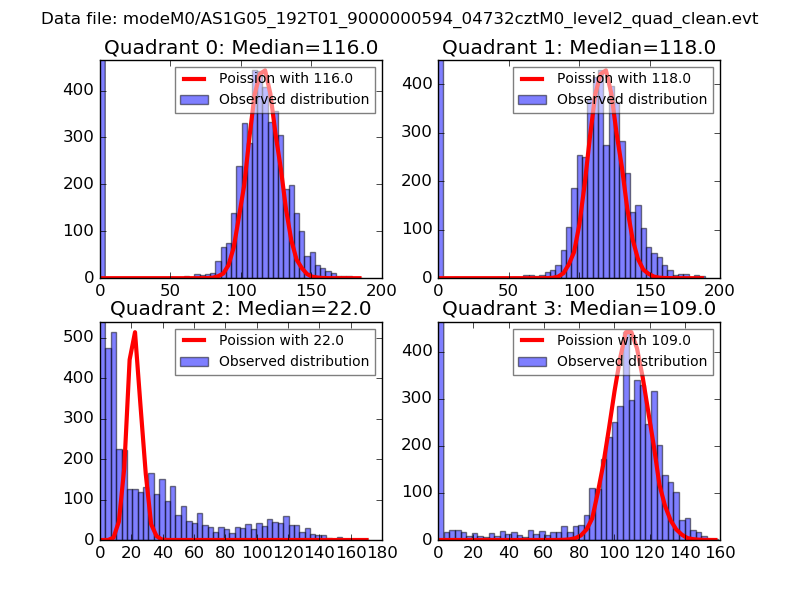 |
 |
| Quadrant-wise count rates Data is divided into 100 sec bins |
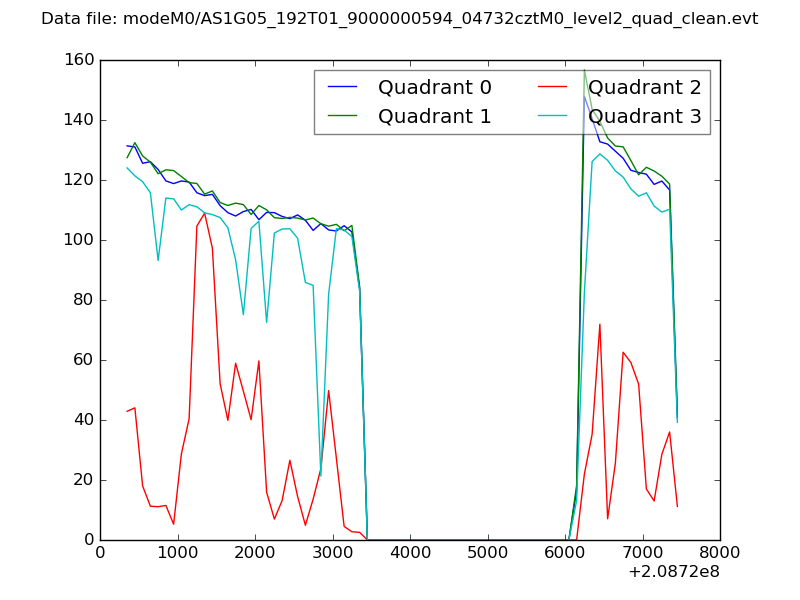 |
|
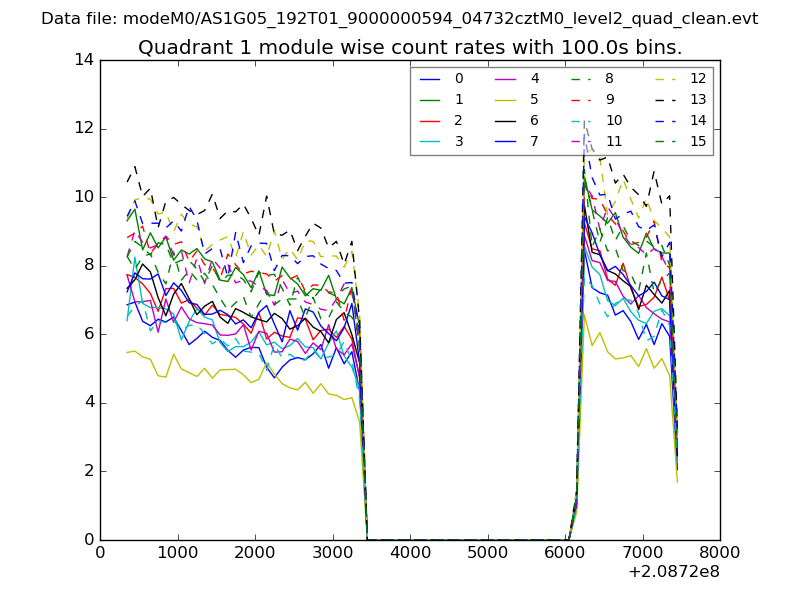
| Module-wise count rates for Quadrant A Data is divided into 100 sec bins |
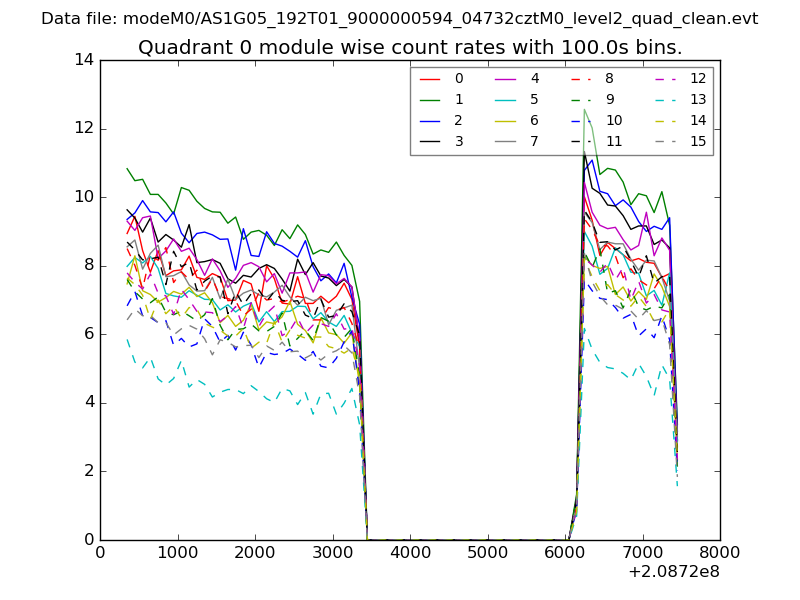 |
 |
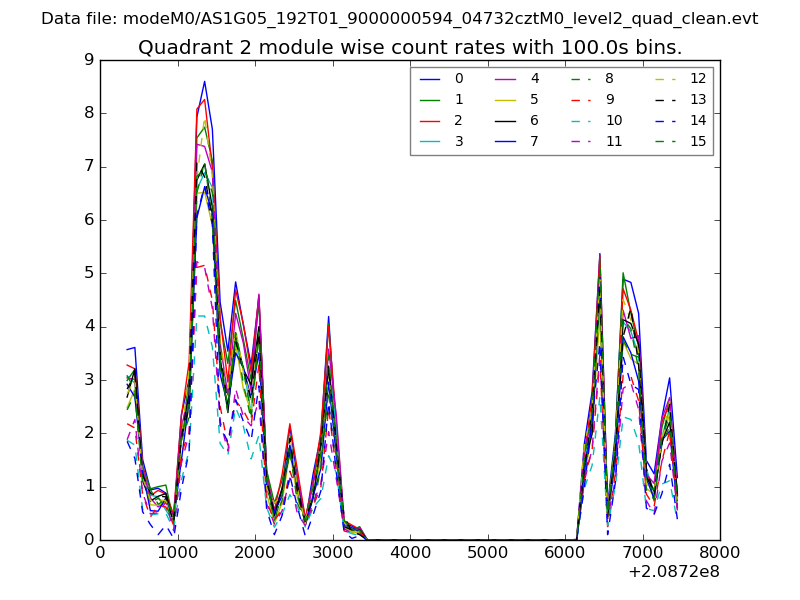
| Module-wise count rates for Quadrant B Data is divided into 100 sec bins |
 |
 |
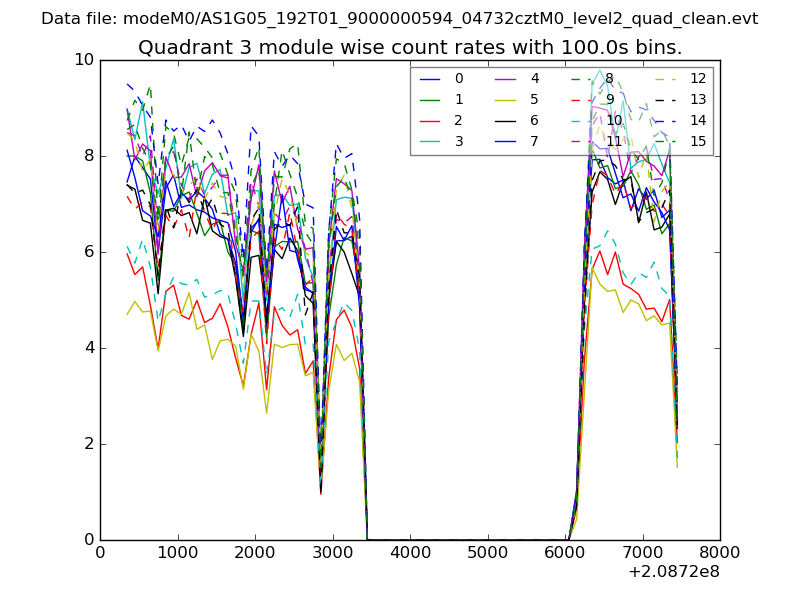
| Module-wise count rates for Quadrant C Data is divided into 100 sec bins |
 |
 |
| Module-wise count rates for Quadrant D Data is divided into 100 sec bins |
 |
 |
| Parameter | Plot |
|---|---|
| CZT HV Monitor | 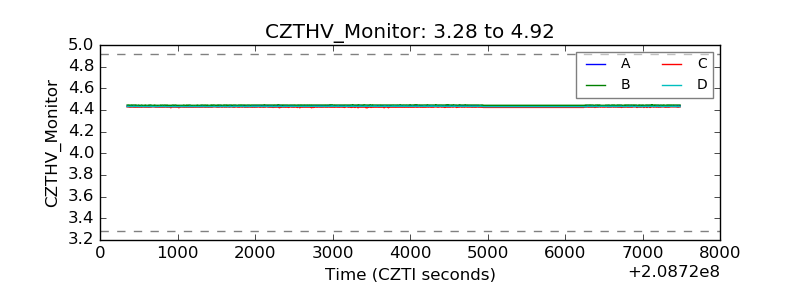 |
| D_VDD | 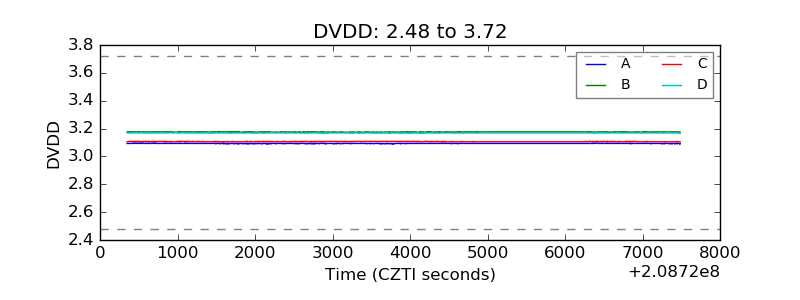 |
| Temperature 1 | 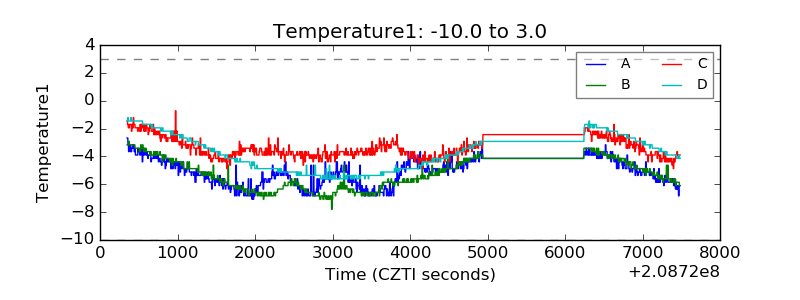 |
| Veto HV Monitor | 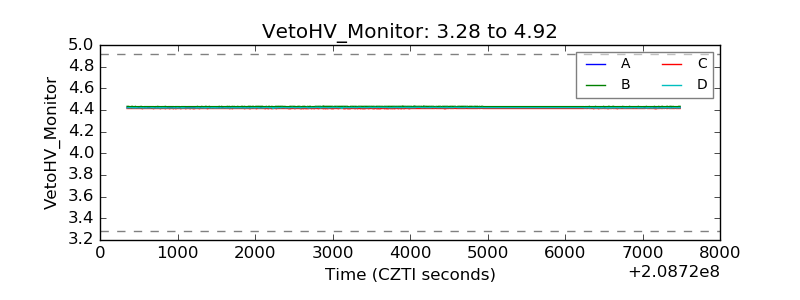 |
| Veto LLD | 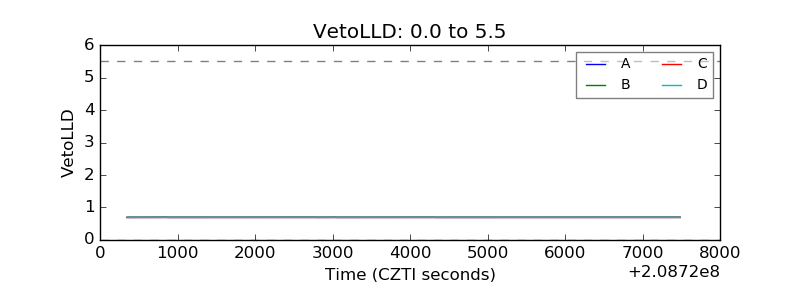 |
| Alpha Counter | 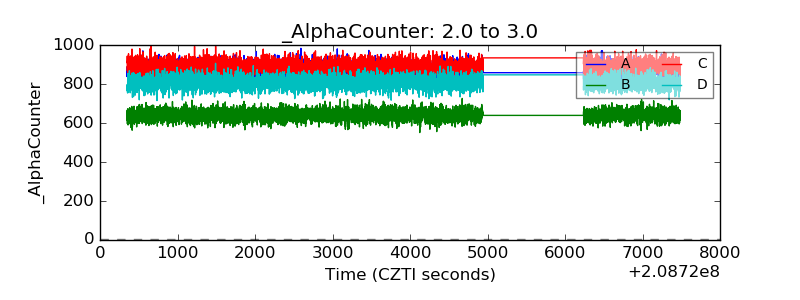 |
| _CPM_Rate | 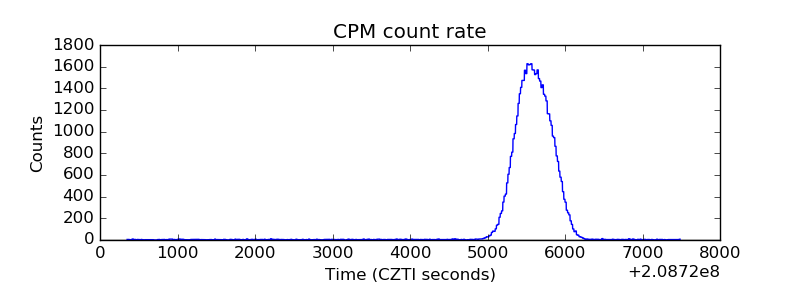 |
| CZT Counter | 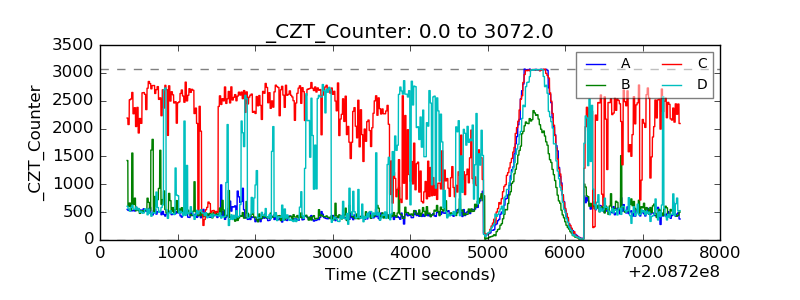 |
| +2.5 Volts monitor |  |
| +5 Volts monitor | 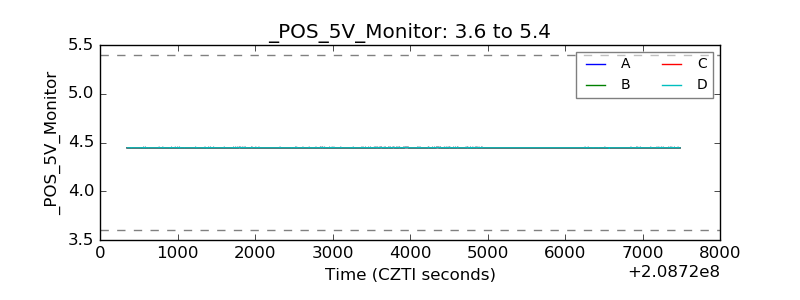 |
| _ROLL_ROT | 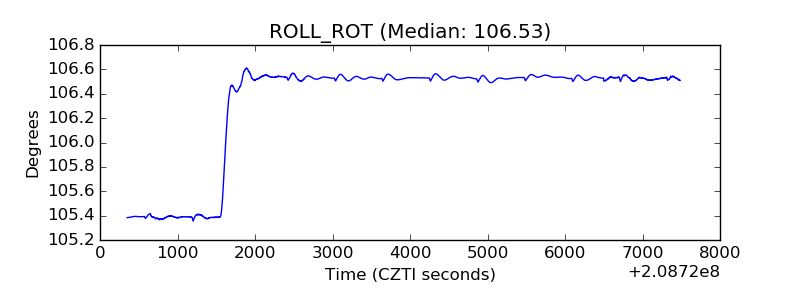 |
| _Roll_DEC | 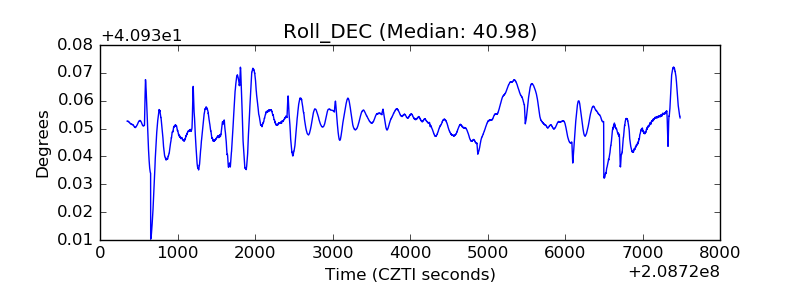 |
| _Roll_RA | 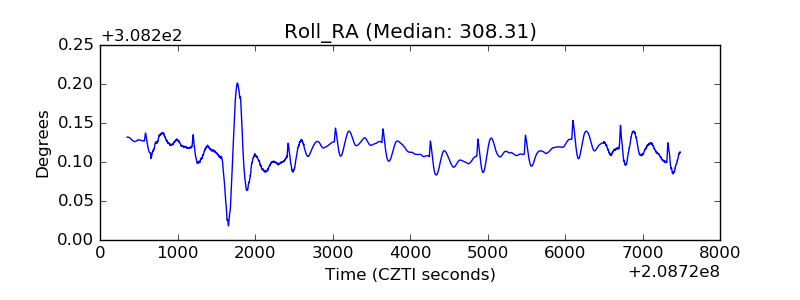 |
| Veto Counter | 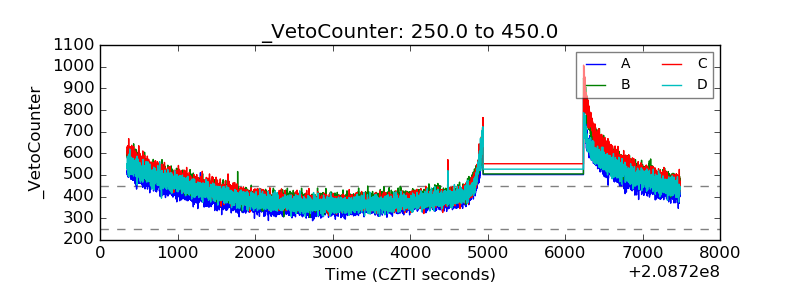 |