| Param | Original file | Final file |
|---|---|---|
| Filename | modeM0/AS1G05_192T01_9000000594_04733cztM0_level2.evt | modeM0/AS1G05_192T01_9000000594_04733cztM0_level2_quad_clean.evt |
| Size (bytes) | 19,592,640 | 4,011,840 |
| Size | 18.7 MB | 3.8 MB |
| Events in quadrant A | 193,513 | 31,954 |
| Events in quadrant B | 202,854 | 32,835 |
| Events in quadrant C | 87,788 | 3,843 |
| Events in quadrant D | 81,208 | 19,226 |
| Mode SS | |||
|---|---|---|---|
| Quadrant | BADHDUFLAG | Total packets | Discarded packets |
| A | 0 | 80 | 48 |
| B | 0 | 80 | 48 |
| C | 0 | 80 | 48 |
| D | 0 | 80 | 49 |
| Mode M9 | |||
|---|---|---|---|
| Quadrant | BADHDUFLAG | Total packets | Discarded packets |
| A | 0 | 14 | 0 |
| B | 1 | 14 | 0 |
| C | 1 | -1 | -1 |
| D | 1 | -1 | -1 |
| Mode M0 | |||
|---|---|---|---|
| Quadrant | BADHDUFLAG | Total packets | Discarded packets |
| A | 0 | 8578 | 7723 |
| B | 0 | 8737 | 7877 |
| C | 0 | 23548 | 23168 |
| D | 0 | 13826 | 13484 |
| Quadrant | Total seconds | Saturated seconds | Saturation percentage |
|---|---|---|---|
| A | 428 | 1 | 0.233645% |
| B | 430 | 0 | 0.000000% |
| C | 191 | 1 | 0.523560% |
| D | 171 | 0 | 0.000000% |
Noise dominated data is calculated using 1-second bins in cleaned event files. If a bin has >2000 counts, and if more than 50% of those come from <1% of pixels, then it is considered to be noise-dominated and hence unusable.
| Quadrant | # 1 sec bins | Bins with >0 counts | Bins with >2000 counts | High rate bins dominated by noise | Noise dominated (total time) | Noise dominated (detector-on time) | Marked lightcurve |
|---|---|---|---|---|---|---|---|
| A | 5489 | 854 | 0 | 0 | 0.00% | 0.00% | 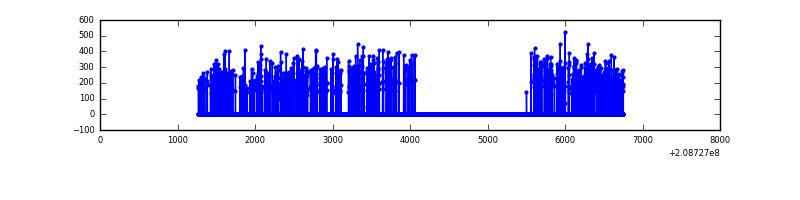 |
| B | 5489 | 859 | 0 | 0 | 0.00% | 0.00% | 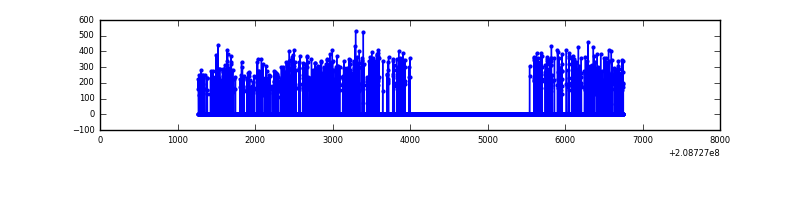 |
| C | 4024 | 379 | 0 | 0 | 0.00% | 0.00% | 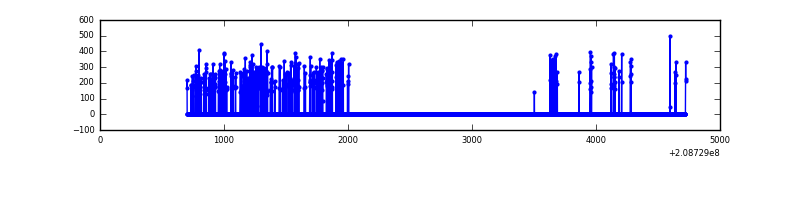 |
| D | 5496 | 341 | 0 | 0 | 0.00% | 0.00% | 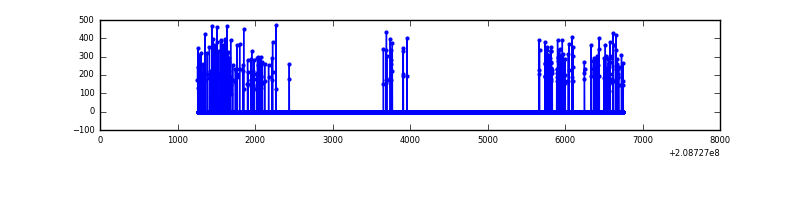 |
Top three noisy pixels from each quadrant. If the there are fewer than three noisy pixels in the level2.evt file, extra rows are filled as -1
| Pixel properties | Quadrant properties | ||||||
|---|---|---|---|---|---|---|---|
| Quadrant | DetID | PixID | Counts | Sigma | Mean | Median | Sigma |
| A | 15 | 254 | 4950 | 405.39 | 48 | 47 | 12.1 |
| A | 13 | 14 | 1089 | 86.16 | 48 | 47 | 12.1 |
| A | 12 | 194 | 499 | 37.37 | 48 | 47 | 12.1 |
| B | 4 | 80 | 5134 | 438.45 | 49 | 48 | 11.6 |
| B | 14 | 167 | 3727 | 317.16 | 49 | 48 | 11.6 |
| B | 10 | 16 | 2292 | 193.45 | 49 | 48 | 11.6 |
| C | 14 | 48 | 1921 | 272.95 | 21 | 21 | 7.0 |
| C | 12 | 4 | 423 | 57.75 | 21 | 21 | 7.0 |
| C | 13 | 61 | 159 | 19.82 | 21 | 21 | 7.0 |
| D | 1 | 31 | 4119 | 678.68 | 18 | 17 | 6.0 |
| D | 13 | 235 | 3903 | 642.94 | 18 | 17 | 6.0 |
| D | 2 | 63 | 1780 | 291.69 | 18 | 17 | 6.0 |
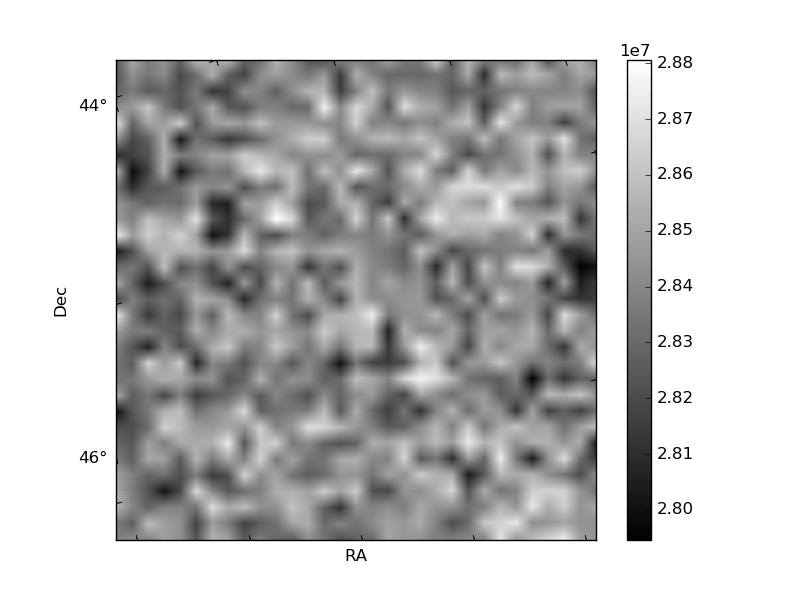
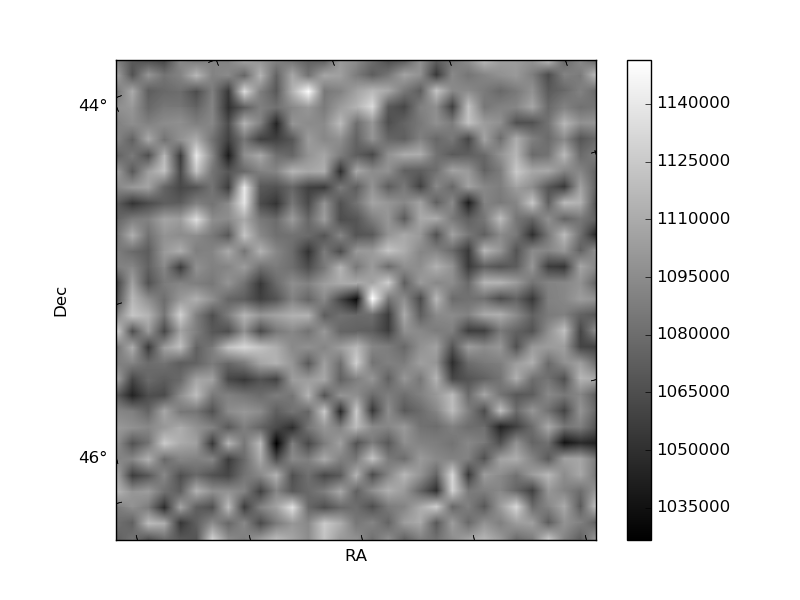
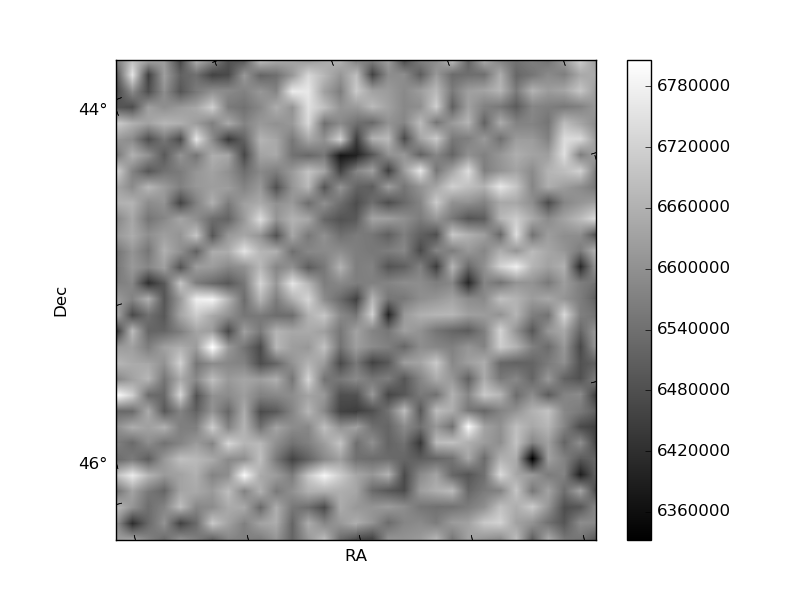
Histogram calculated using DETX and DETY for each event in the final _common_clean file
| Quadrant A | 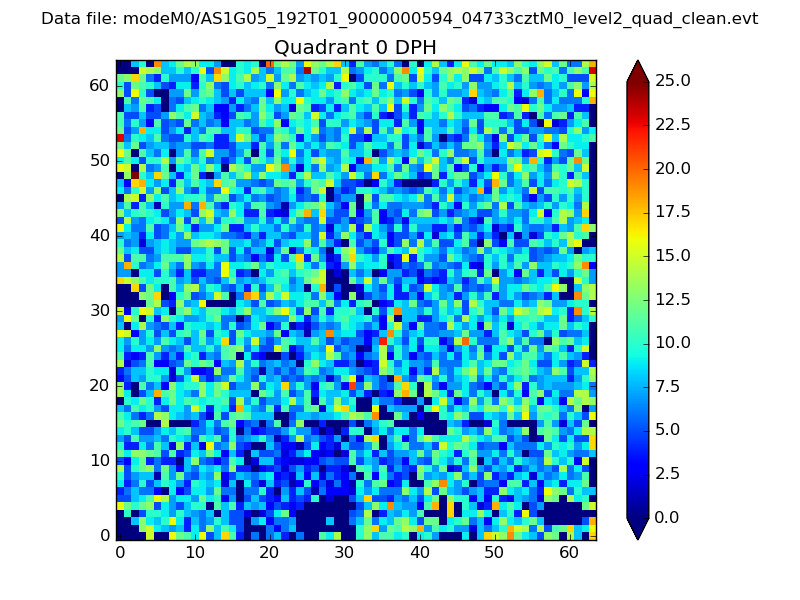 |
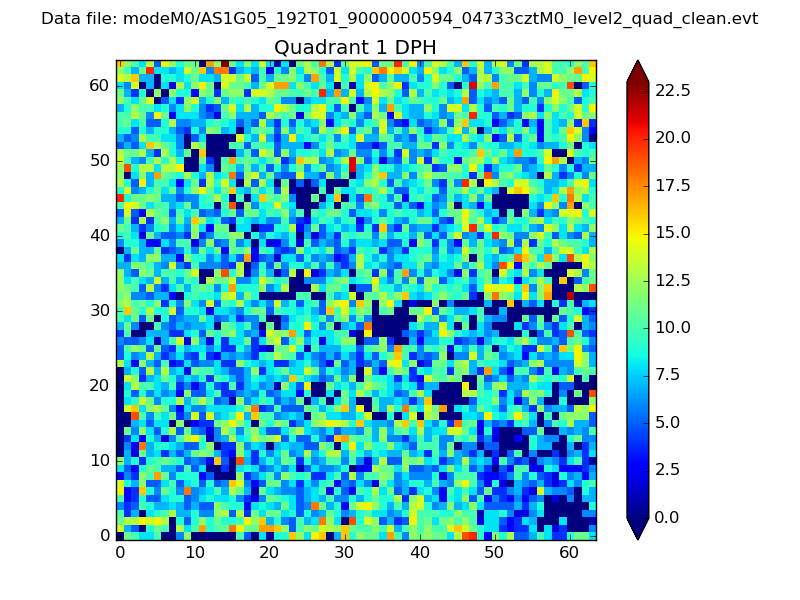 |
Quadrant B |
|---|---|---|---|
| Quadrant D | 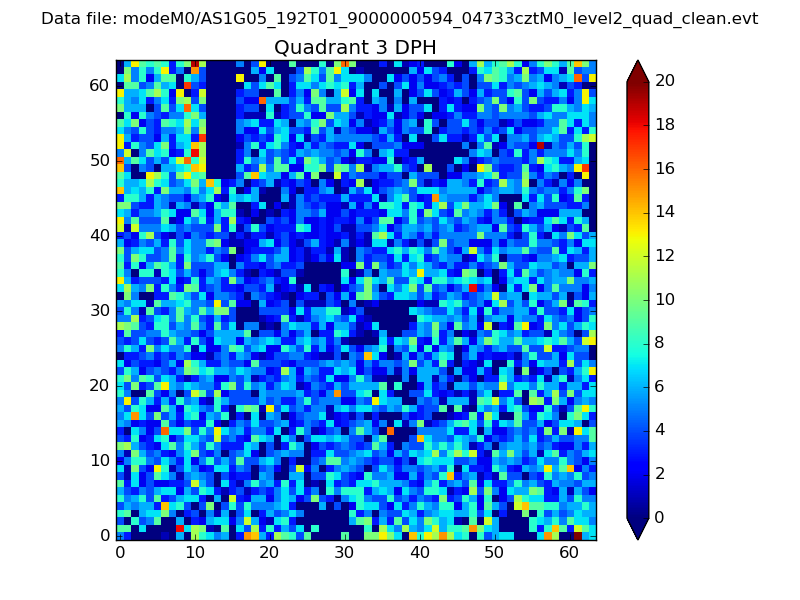 |
 |
Quadrant C |
| Plot type | Count rate plots | Images |
|---|---|---|
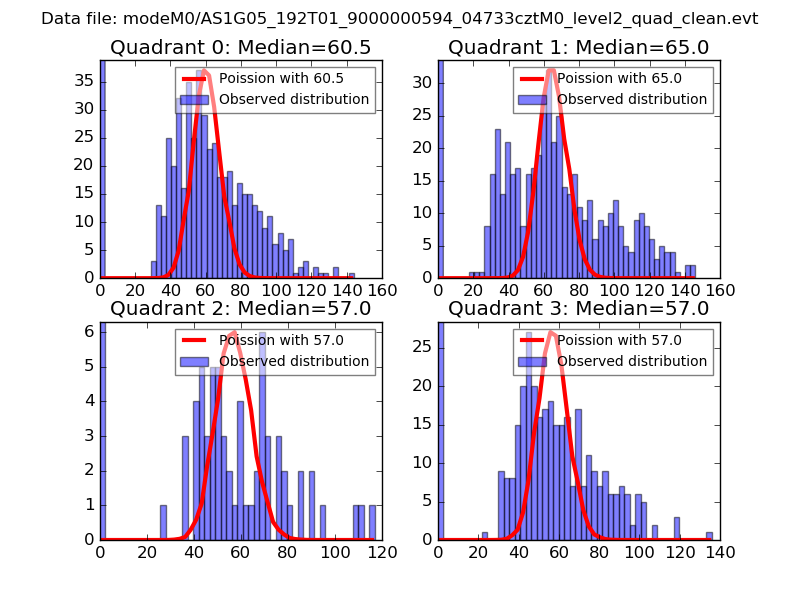
| Comparison with Poisson distribution Blue bars denote a histogram of data divided into 1 sec bins. Red curve is a Poisson curve with rate = median count rate of data. |
 |
 |
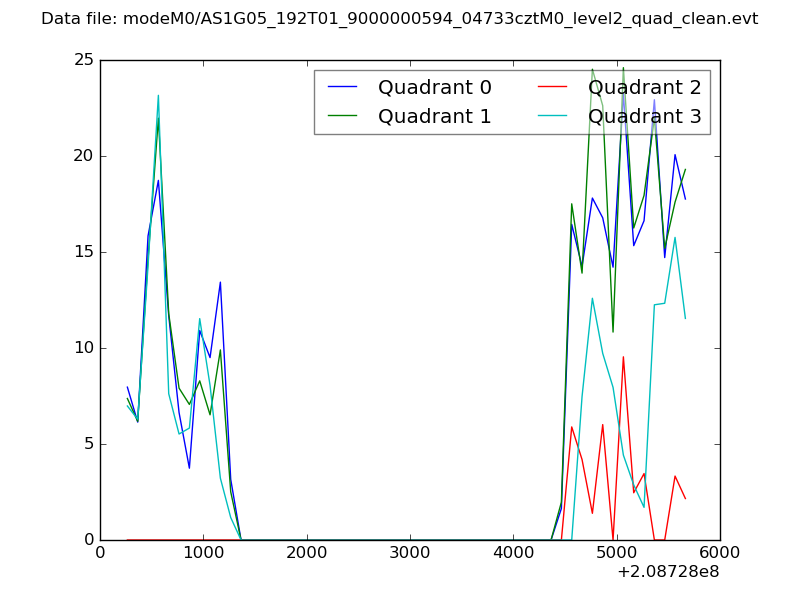
| Quadrant-wise count rates Data is divided into 100 sec bins |
 |
|
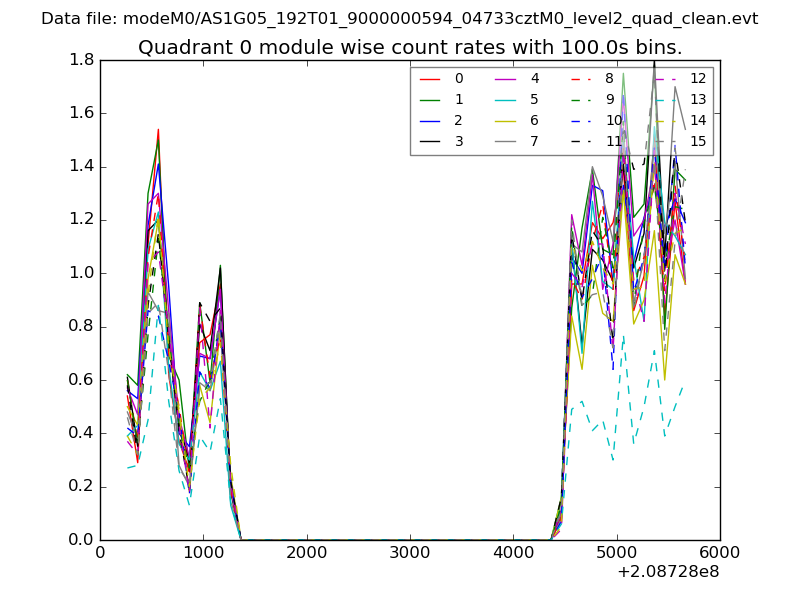
| Module-wise count rates for Quadrant A Data is divided into 100 sec bins |
 |
 |
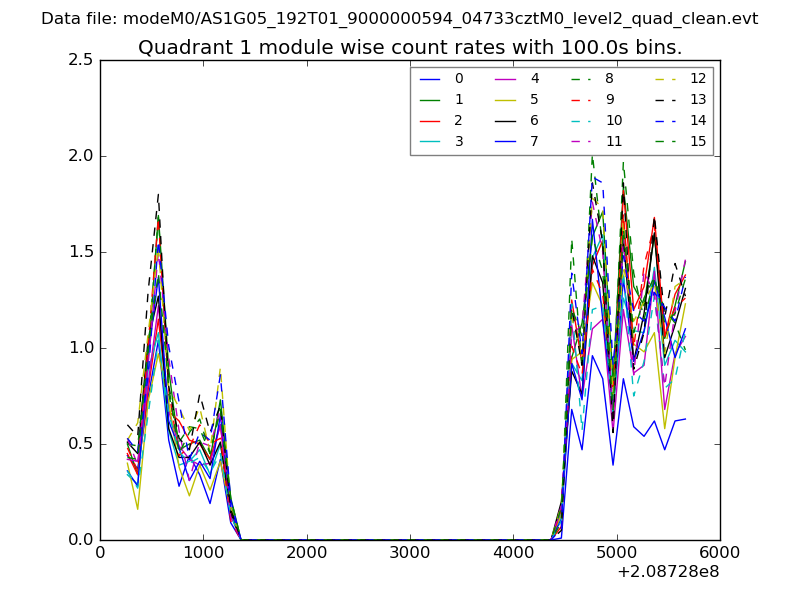
| Module-wise count rates for Quadrant B Data is divided into 100 sec bins |
 |
 |
| Module-wise count rates for Quadrant C Data is divided into 100 sec bins |
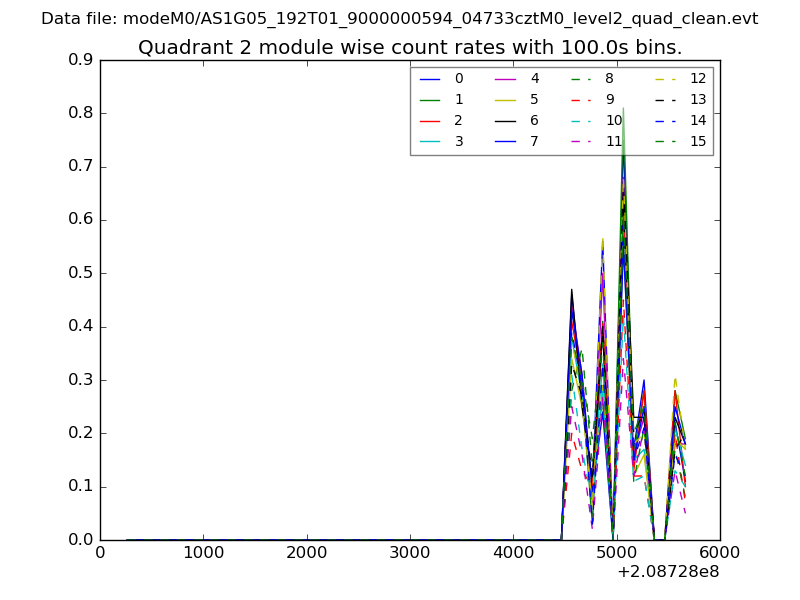 |
 |
| Module-wise count rates for Quadrant D Data is divided into 100 sec bins |
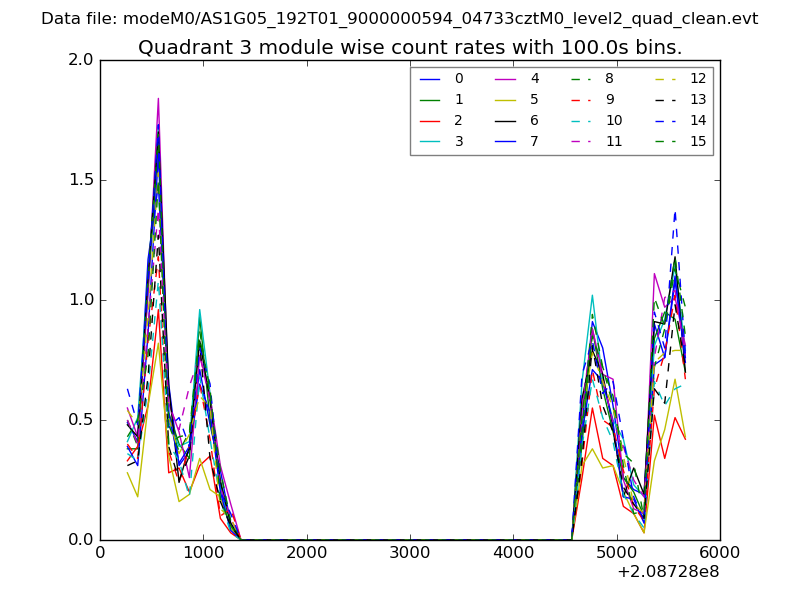 |
 |
| Parameter | Plot |
|---|---|
| CZT HV Monitor | 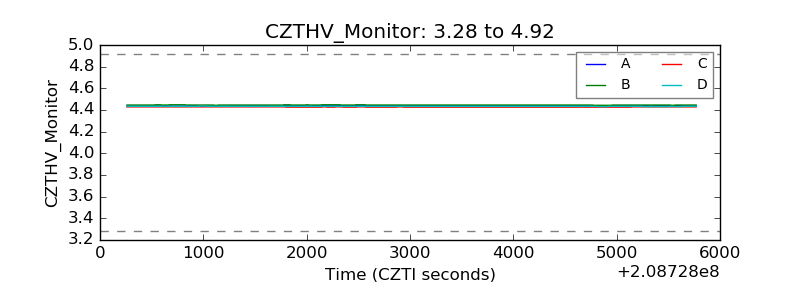 |
| D_VDD | 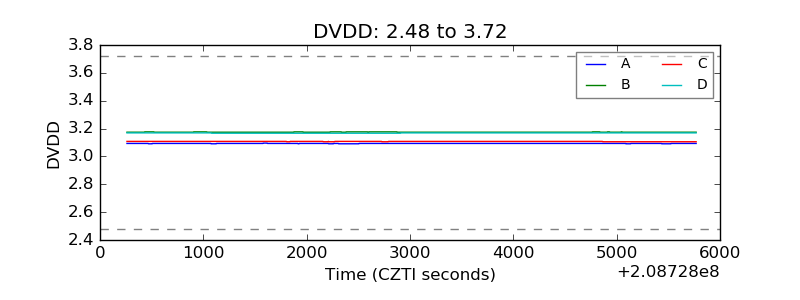 |
| Temperature 1 | 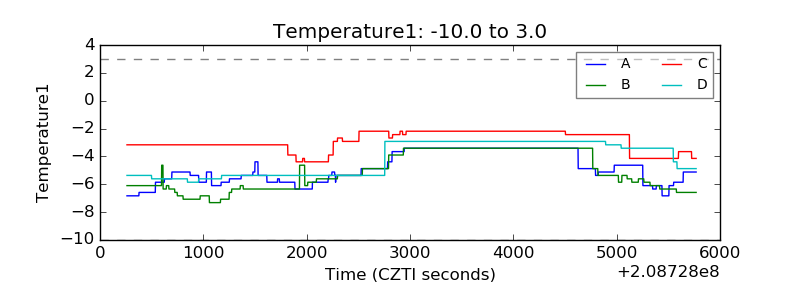 |
| Veto HV Monitor | 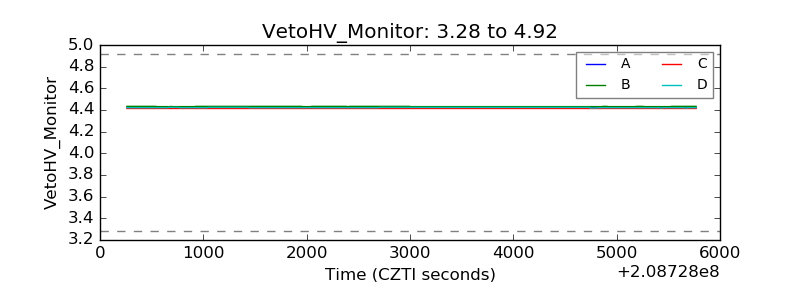 |
| Veto LLD | 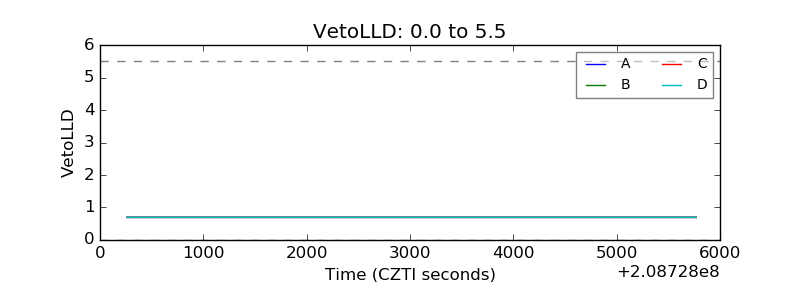 |
| Alpha Counter | 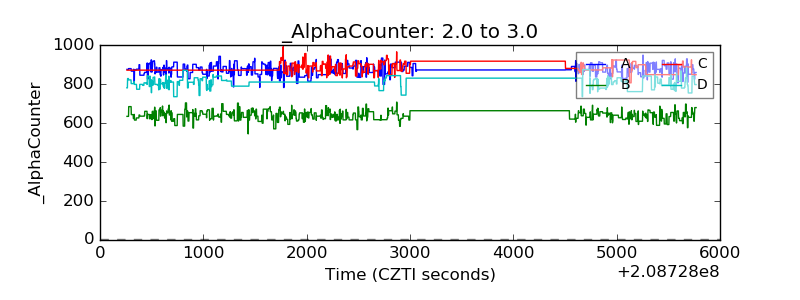 |
| _CPM_Rate | 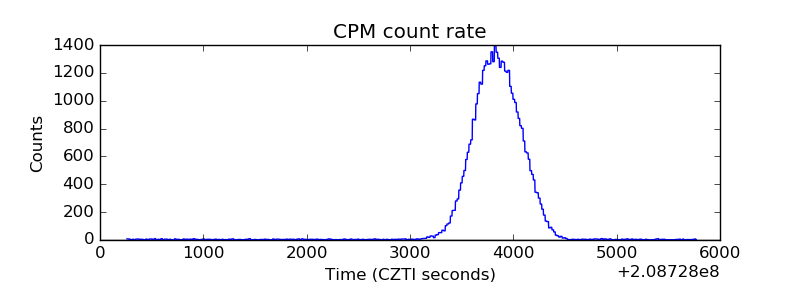 |
| CZT Counter | 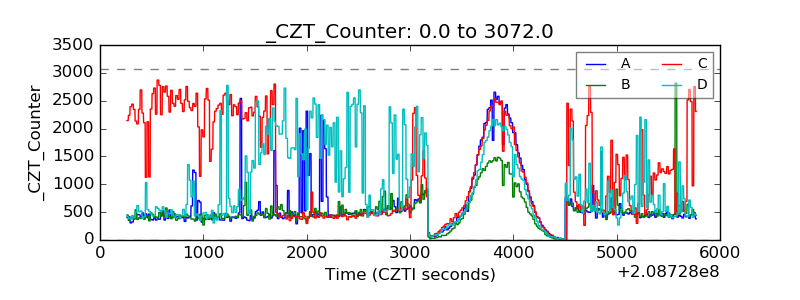 |
| +2.5 Volts monitor |  |
| +5 Volts monitor |  |
| _ROLL_ROT | 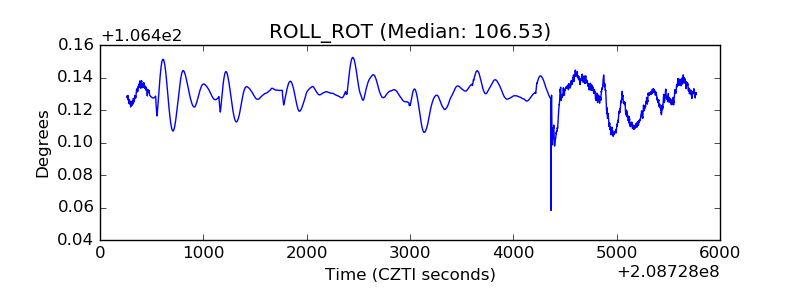 |
| _Roll_DEC | 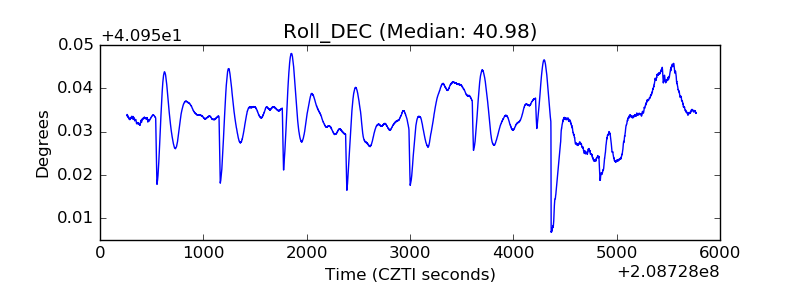 |
| _Roll_RA | 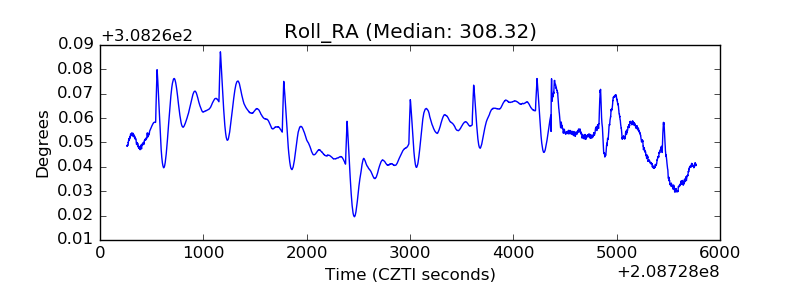 |
| Veto Counter | 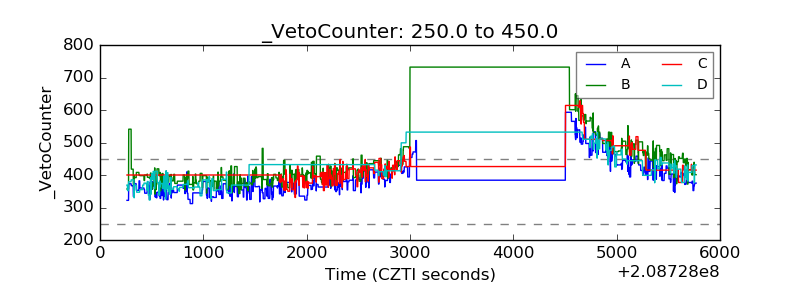 |