| Param | Original file | Final file |
|---|---|---|
| Filename | modeM0/AS1G05_192T01_9000000594_04735cztM0_level2.evt | modeM0/AS1G05_192T01_9000000594_04735cztM0_level2_quad_clean.evt |
| Size (bytes) | 607,487,040 | 78,353,280 |
| Size | 579.3 MB | 74.7 MB |
| Events in quadrant A | 2,975,822 | 491,746 |
| Events in quadrant B | 3,491,075 | 498,892 |
| Events in quadrant C | 5,884,471 | 455,848 |
| Events in quadrant D | 5,596,878 | 463,083 |
| Mode SS | |||
|---|---|---|---|
| Quadrant | BADHDUFLAG | Total packets | Discarded packets |
| A | 0 | 134 | 0 |
| B | 0 | 134 | 0 |
| C | 0 | 134 | 0 |
| D | 0 | 134 | 0 |
| Mode M9 | |||
|---|---|---|---|
| Quadrant | BADHDUFLAG | Total packets | Discarded packets |
| A | 0 | 16 | 0 |
| B | 0 | 16 | 0 |
| C | 0 | 16 | 0 |
| D | 0 | 17 | 0 |
| Mode M0 | |||
|---|---|---|---|
| Quadrant | BADHDUFLAG | Total packets | Discarded packets |
| A | 0 | 13702 | 3 |
| B | 0 | 15023 | 2 |
| C | 0 | 22104 | 2 |
| D | 0 | 21470 | 2 |
| Quadrant | Total seconds | Saturated seconds | Saturation percentage |
|---|---|---|---|
| A | 6638 | 15 | 0.225972% |
| B | 6638 | 159 | 2.395300% |
| C | 6638 | 807 | 12.157276% |
| D | 6638 | 788 | 11.871045% |
Noise dominated data is calculated using 1-second bins in cleaned event files. If a bin has >2000 counts, and if more than 50% of those come from <1% of pixels, then it is considered to be noise-dominated and hence unusable.
| Quadrant | # 1 sec bins | Bins with >0 counts | Bins with >2000 counts | High rate bins dominated by noise | Noise dominated (total time) | Noise dominated (detector-on time) | Marked lightcurve |
|---|---|---|---|---|---|---|---|
| A | 7663 | 6639 | 5 | 5 | 0.07% | 0.08% | 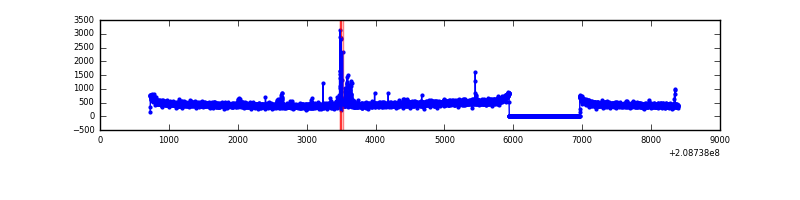 |
| B | 7663 | 6639 | 110 | 110 | 1.44% | 1.66% | 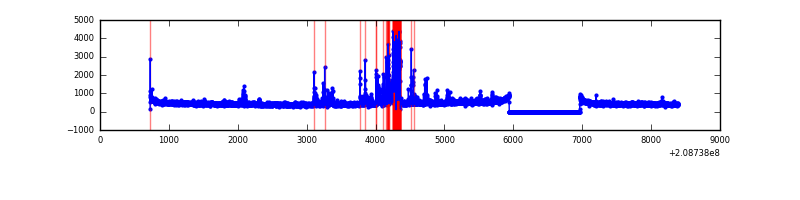 |
| C | 7663 | 6638 | 689 | 689 | 8.99% | 10.38% | 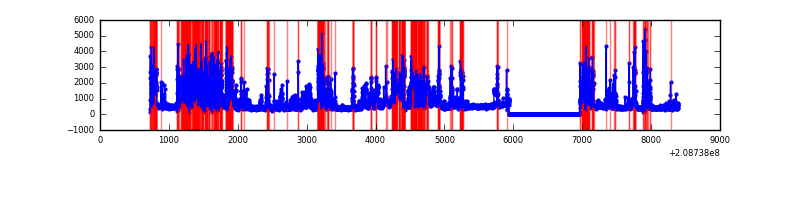 |
| D | 7663 | 6639 | 749 | 749 | 9.77% | 11.28% | 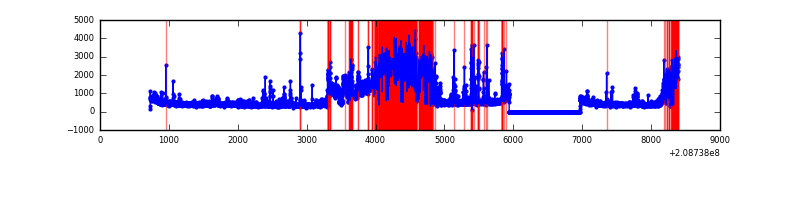 |
Top three noisy pixels from each quadrant. If the there are fewer than three noisy pixels in the level2.evt file, extra rows are filled as -1
| Pixel properties | Quadrant properties | ||||||
|---|---|---|---|---|---|---|---|
| Quadrant | DetID | PixID | Counts | Sigma | Mean | Median | Sigma |
| A | 15 | 254 | 81556 | 528.53 | 749 | 734 | 152.9 |
| A | 12 | 194 | 7325 | 43.1 | 749 | 734 | 152.9 |
| A | 0 | 226 | 7231 | 42.49 | 749 | 734 | 152.9 |
| B | 10 | 16 | 496942 | 3420.88 | 758 | 739 | 145.1 |
| B | 14 | 167 | 32297 | 217.56 | 758 | 739 | 145.1 |
| B | 4 | 80 | 27987 | 187.85 | 758 | 739 | 145.1 |
| C | 14 | 48 | 3162994 | 19547.21 | 696 | 699 | 161.8 |
| C | 13 | 61 | 5703 | 30.93 | 696 | 699 | 161.8 |
| C | 12 | 4 | 3558 | 17.67 | 696 | 699 | 161.8 |
| D | 13 | 53 | 2555626 | 15309.36 | 689 | 670 | 166.9 |
| D | 13 | 235 | 214503 | 1281.29 | 689 | 670 | 166.9 |
| D | 13 | 239 | 74352 | 441.5 | 689 | 670 | 166.9 |
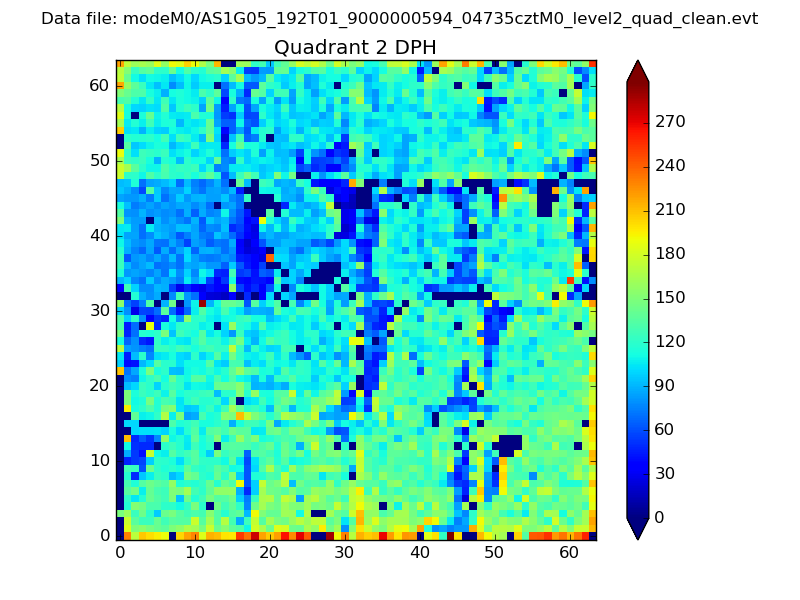
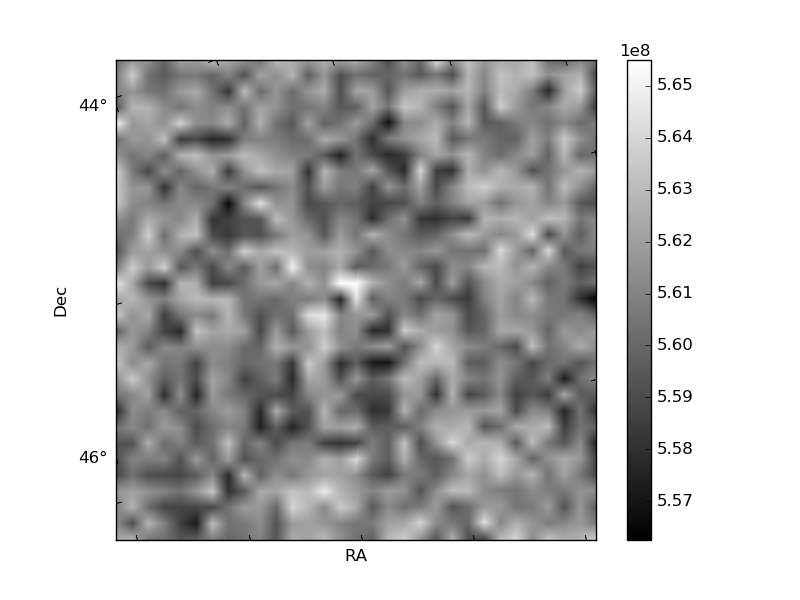
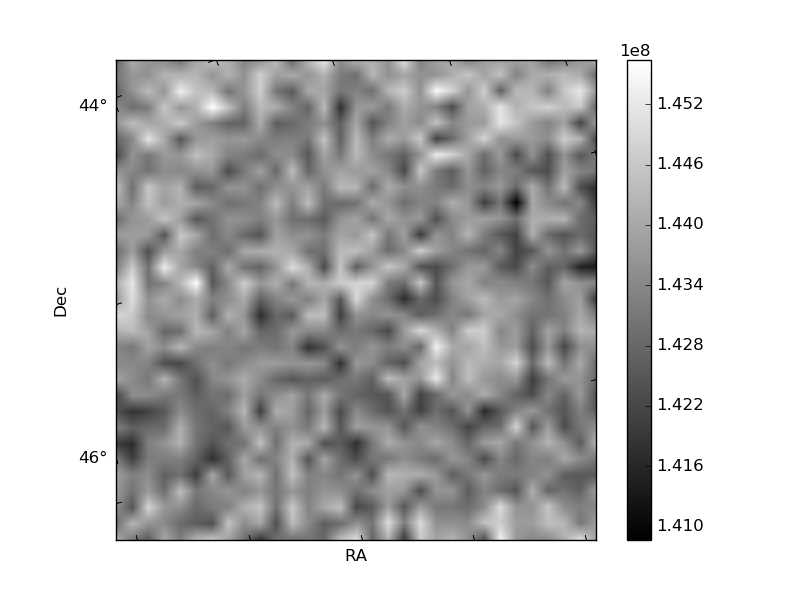
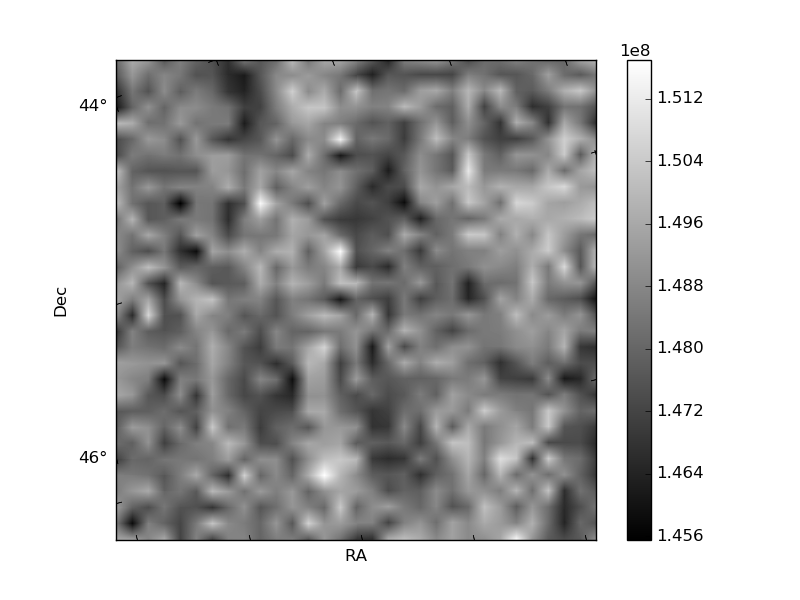
Histogram calculated using DETX and DETY for each event in the final _common_clean file
| Quadrant A | 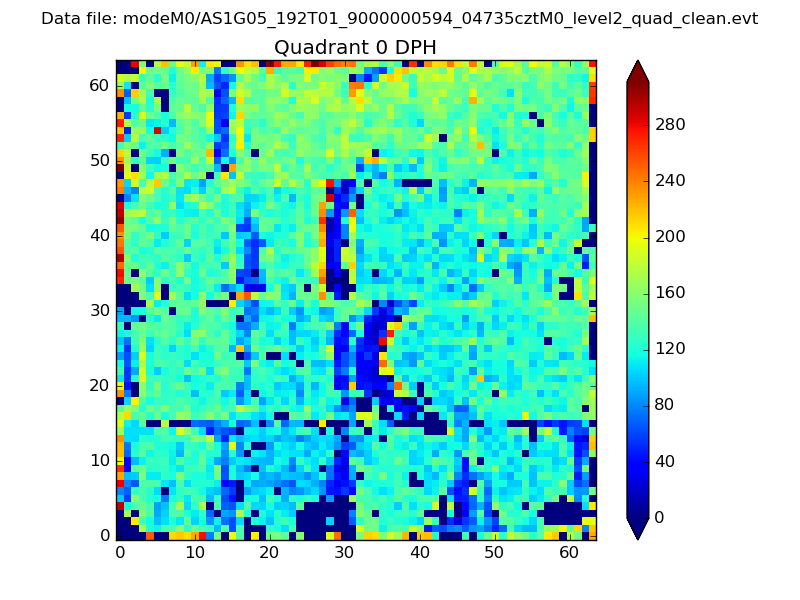 |
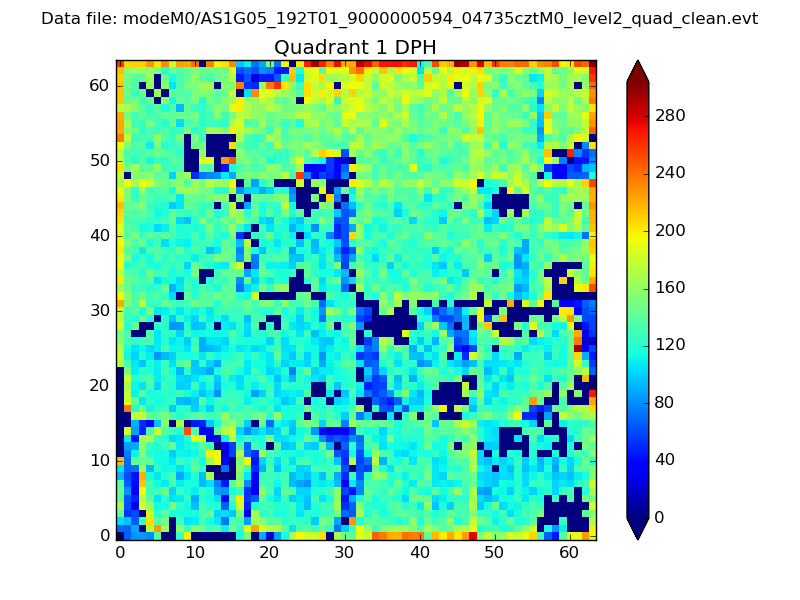 |
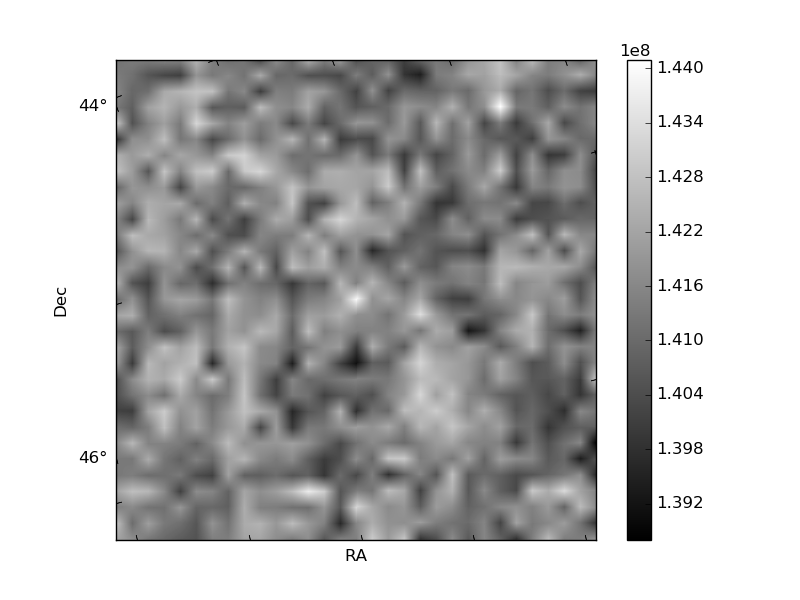
Quadrant B |
|---|---|---|---|
| Quadrant D | 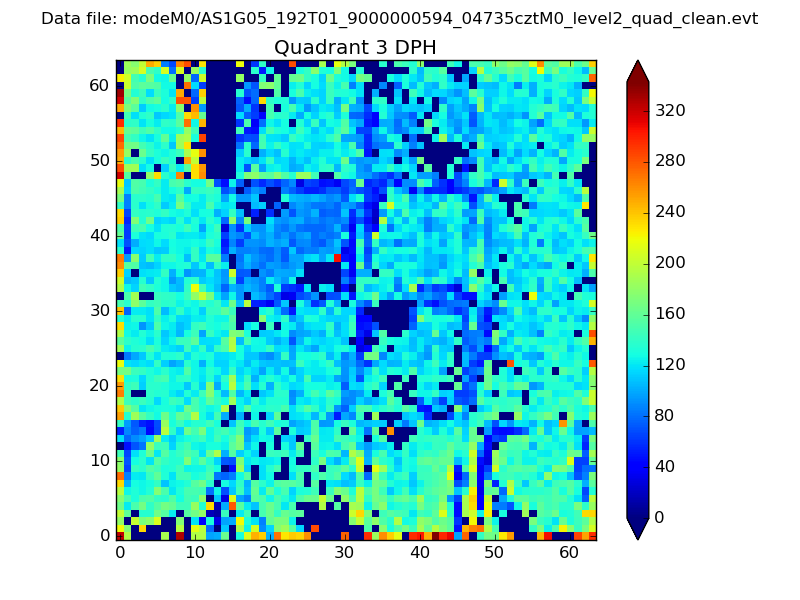 |
 |
Quadrant C |
| Plot type | Count rate plots | Images |
|---|---|---|
| Comparison with Poisson distribution Blue bars denote a histogram of data divided into 1 sec bins. Red curve is a Poisson curve with rate = median count rate of data. |
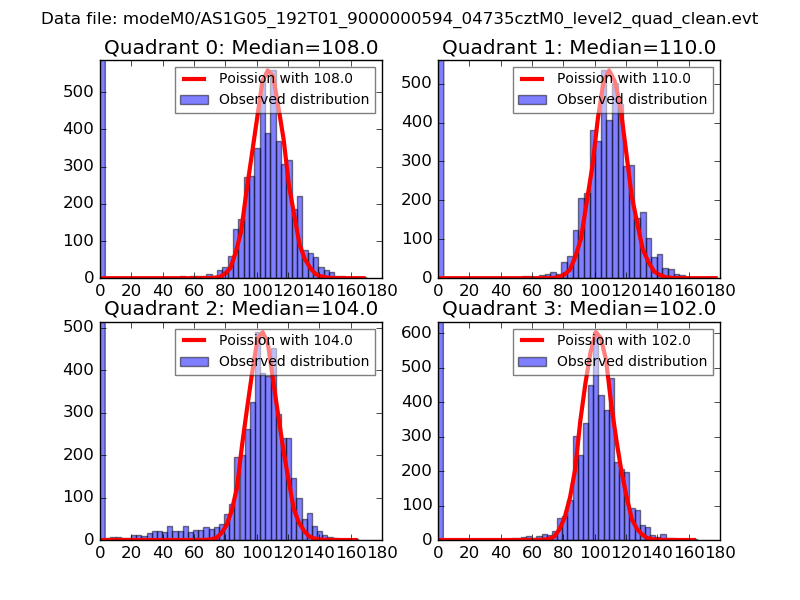 |
 |
| Quadrant-wise count rates Data is divided into 100 sec bins |
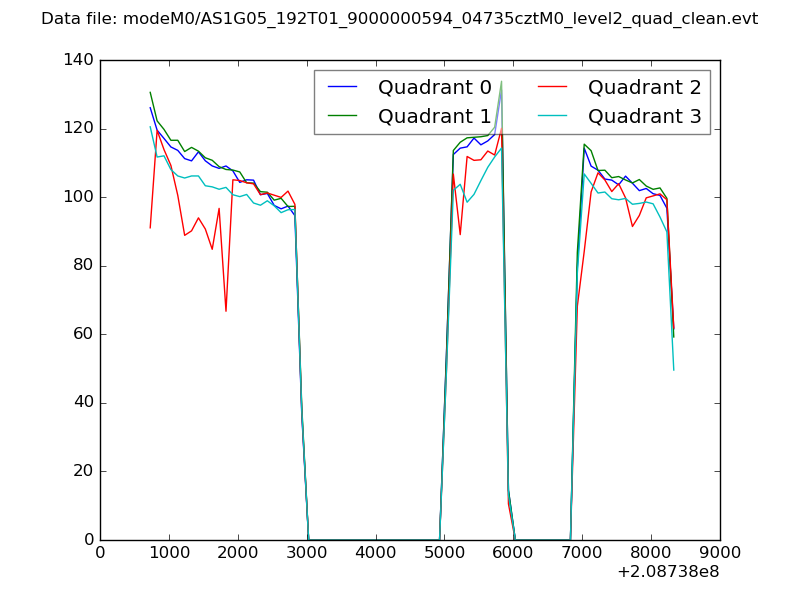 |
|
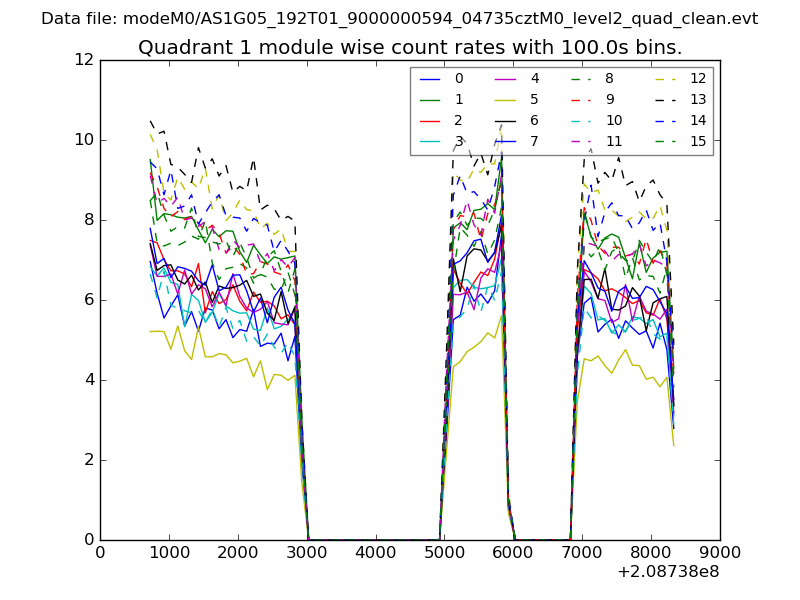
| Module-wise count rates for Quadrant A Data is divided into 100 sec bins |
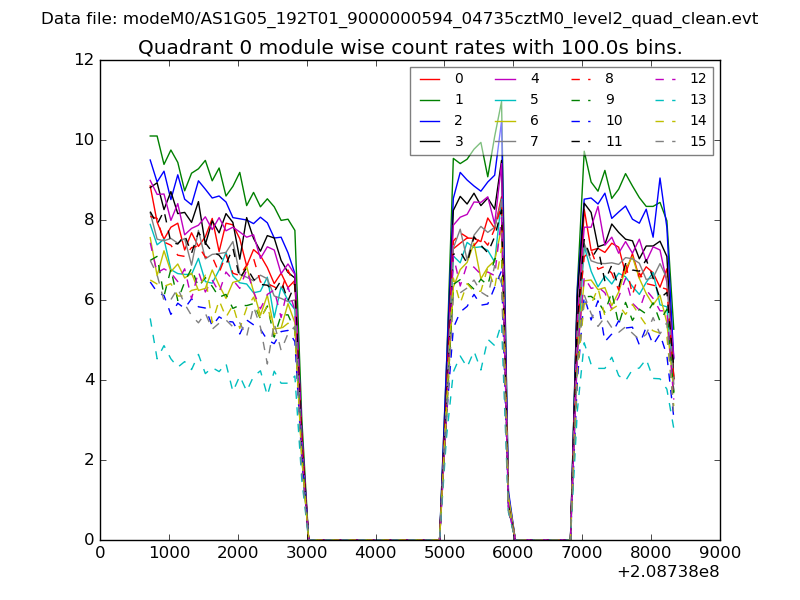 |
 |
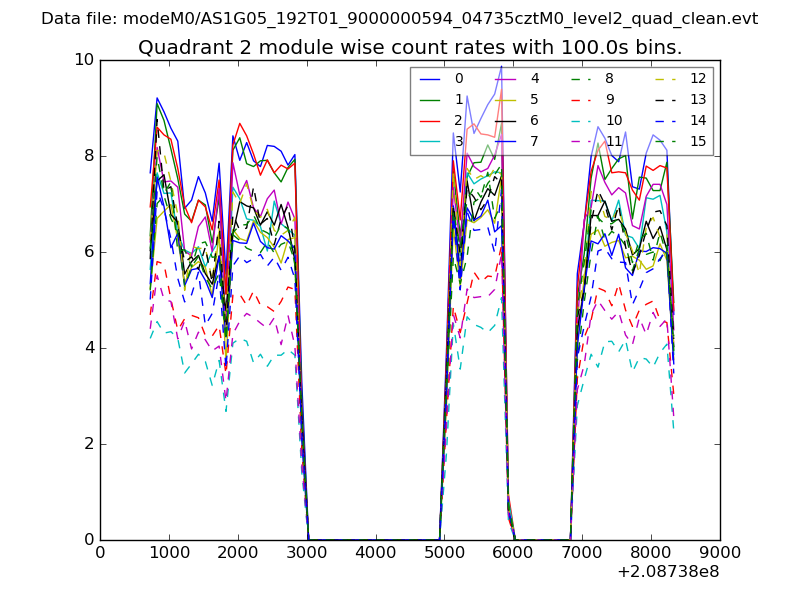
| Module-wise count rates for Quadrant B Data is divided into 100 sec bins |
 |
 |
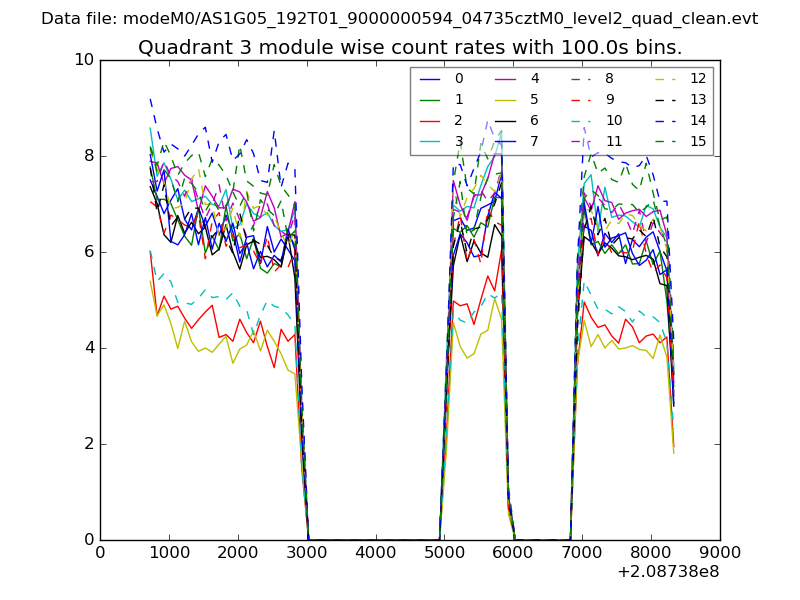
| Module-wise count rates for Quadrant C Data is divided into 100 sec bins |
 |
 |
| Module-wise count rates for Quadrant D Data is divided into 100 sec bins |
 |
 |
| Parameter | Plot |
|---|---|
| CZT HV Monitor | 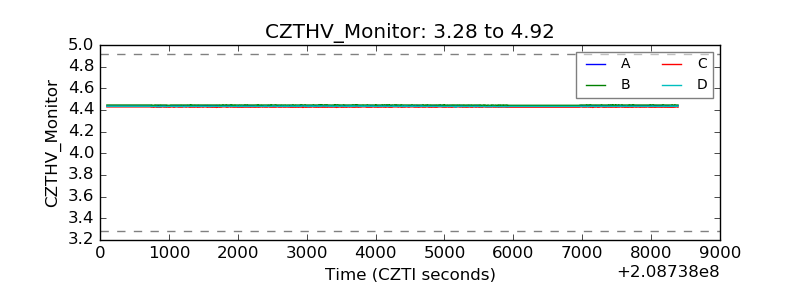 |
| D_VDD | 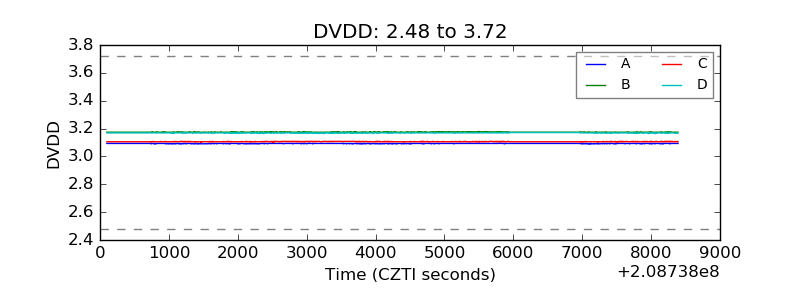 |
| Temperature 1 | 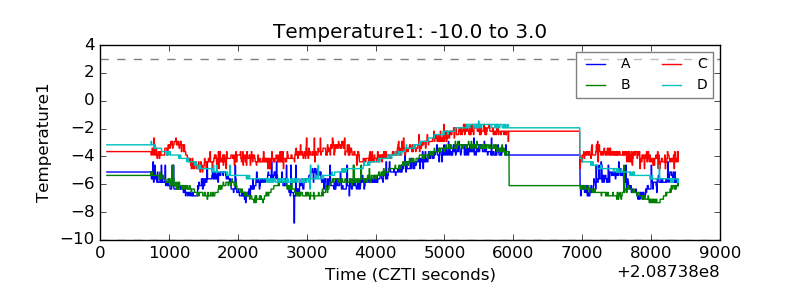 |
| Veto HV Monitor | 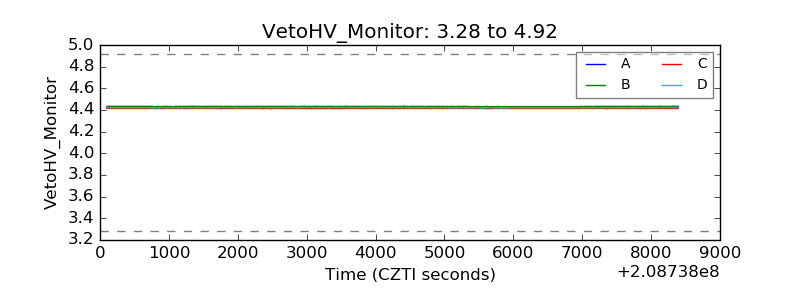 |
| Veto LLD | 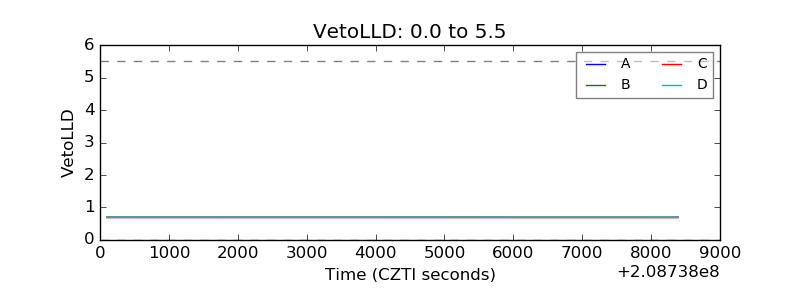 |
| Alpha Counter | 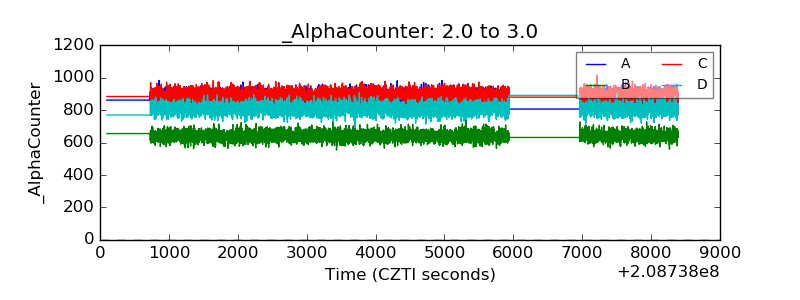 |
| _CPM_Rate | 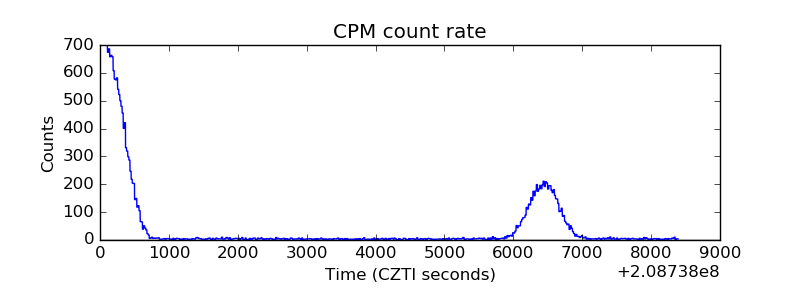 |
| CZT Counter | 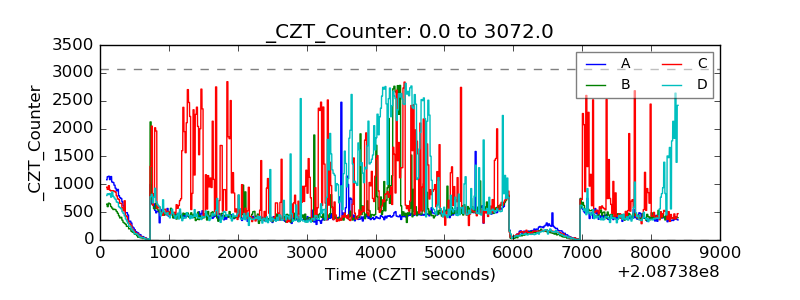 |
| +2.5 Volts monitor |  |
| +5 Volts monitor |  |
| _ROLL_ROT | 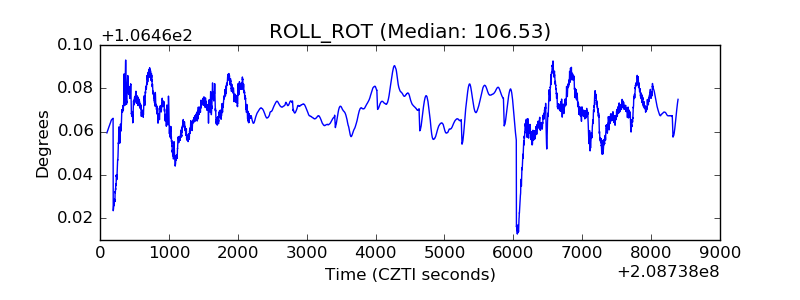 |
| _Roll_DEC | 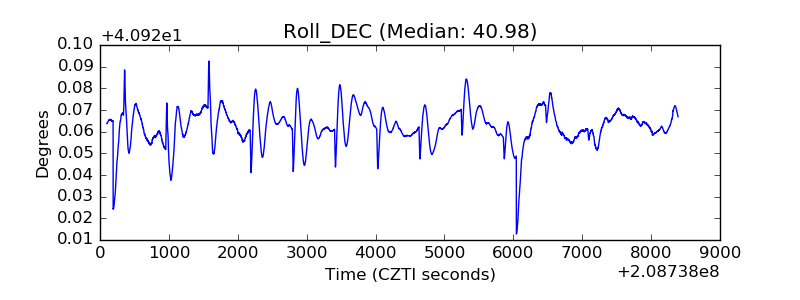 |
| _Roll_RA | 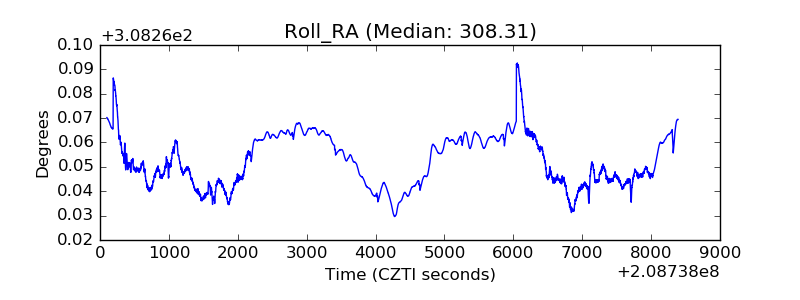 |
| Veto Counter | 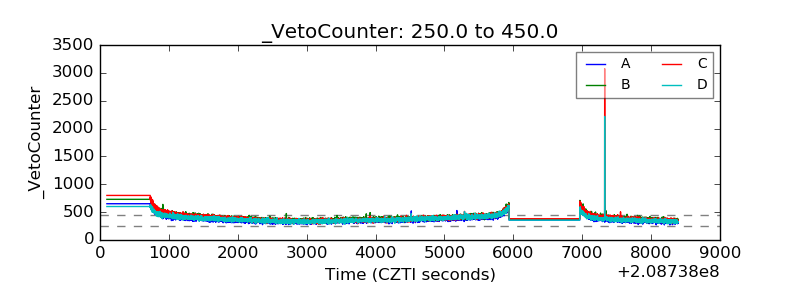 |