| Param | Original file | Final file |
|---|---|---|
| Filename | modeM0/AS1G05_192T01_9000000594_04736cztM0_level2.evt | modeM0/AS1G05_192T01_9000000594_04736cztM0_level2_quad_clean.evt |
| Size (bytes) | 605,606,400 | 82,932,480 |
| Size | 577.6 MB | 79.1 MB |
| Events in quadrant A | 3,086,947 | 522,474 |
| Events in quadrant B | 3,347,515 | 529,039 |
| Events in quadrant C | 6,782,034 | 471,793 |
| Events in quadrant D | 4,645,762 | 495,649 |
| Mode SS | |||
|---|---|---|---|
| Quadrant | BADHDUFLAG | Total packets | Discarded packets |
| A | 0 | 144 | 0 |
| B | 0 | 144 | 0 |
| C | 0 | 144 | 0 |
| D | 0 | 144 | 0 |
| Mode M9 | |||
|---|---|---|---|
| Quadrant | BADHDUFLAG | Total packets | Discarded packets |
| A | 0 | 6 | 0 |
| B | 0 | 6 | 0 |
| C | 0 | 6 | 0 |
| D | 0 | 6 | 0 |
| Mode M0 | |||
|---|---|---|---|
| Quadrant | BADHDUFLAG | Total packets | Discarded packets |
| A | 0 | 14380 | 3 |
| B | 0 | 14879 | 2 |
| C | 0 | 25114 | 2 |
| D | 0 | 18869 | 2 |
| Quadrant | Total seconds | Saturated seconds | Saturation percentage |
|---|---|---|---|
| A | 7061 | 42 | 0.594817% |
| B | 7061 | 72 | 1.019686% |
| C | 7061 | 1005 | 14.233111% |
| D | 7061 | 350 | 4.956805% |
Noise dominated data is calculated using 1-second bins in cleaned event files. If a bin has >2000 counts, and if more than 50% of those come from <1% of pixels, then it is considered to be noise-dominated and hence unusable.
| Quadrant | # 1 sec bins | Bins with >0 counts | Bins with >2000 counts | High rate bins dominated by noise | Noise dominated (total time) | Noise dominated (detector-on time) | Marked lightcurve |
|---|---|---|---|---|---|---|---|
| A | 7661 | 7063 | 0 | 0 | 0.00% | 0.00% | 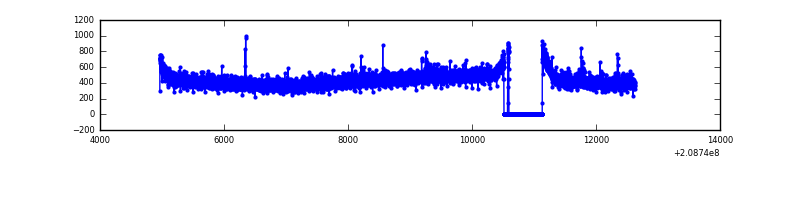 |
| B | 7661 | 7063 | 6 | 6 | 0.08% | 0.08% | 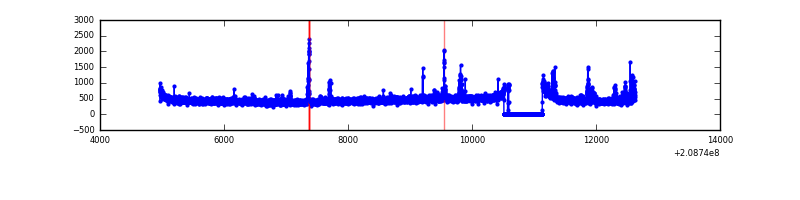 |
| C | 7661 | 7063 | 790 | 790 | 10.31% | 11.19% | 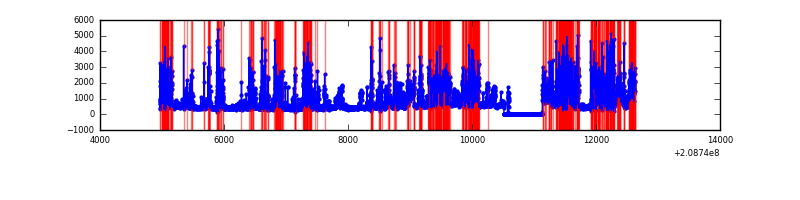 |
| D | 7661 | 7063 | 354 | 354 | 4.62% | 5.01% | 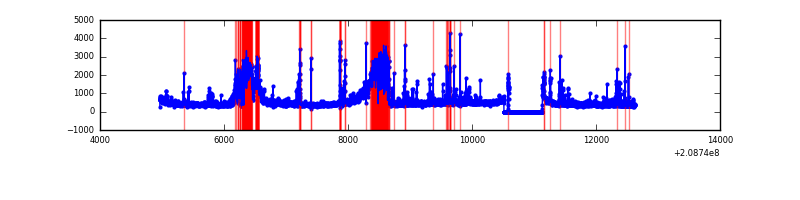 |
Top three noisy pixels from each quadrant. If the there are fewer than three noisy pixels in the level2.evt file, extra rows are filled as -1
| Pixel properties | Quadrant properties | ||||||
|---|---|---|---|---|---|---|---|
| Quadrant | DetID | PixID | Counts | Sigma | Mean | Median | Sigma |
| A | 7 | 16 | 10556 | 60.76 | 794 | 776 | 161.0 |
| A | 12 | 194 | 7844 | 43.91 | 794 | 776 | 161.0 |
| A | 0 | 226 | 7823 | 43.78 | 794 | 776 | 161.0 |
| B | 14 | 167 | 175290 | 1108.48 | 810 | 789 | 157.4 |
| B | 4 | 80 | 24025 | 147.6 | 810 | 789 | 157.4 |
| B | 12 | 111 | 14569 | 87.53 | 810 | 789 | 157.4 |
| C | 14 | 48 | 3916029 | 22954.44 | 731 | 736 | 170.6 |
| C | 12 | 4 | 11171 | 61.18 | 731 | 736 | 170.6 |
| C | 13 | 61 | 5991 | 30.81 | 731 | 736 | 170.6 |
| D | 13 | 53 | 1336813 | 7301.19 | 757 | 734 | 183.0 |
| D | 13 | 235 | 171055 | 930.74 | 757 | 734 | 183.0 |
| D | 2 | 14 | 89758 | 486.48 | 757 | 734 | 183.0 |
Histogram calculated using DETX and DETY for each event in the final _common_clean file
| Quadrant A | 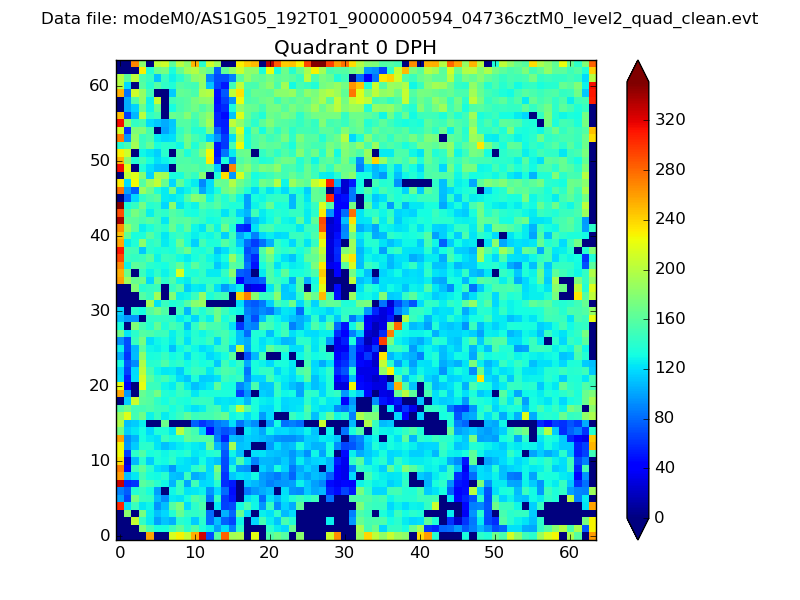 |
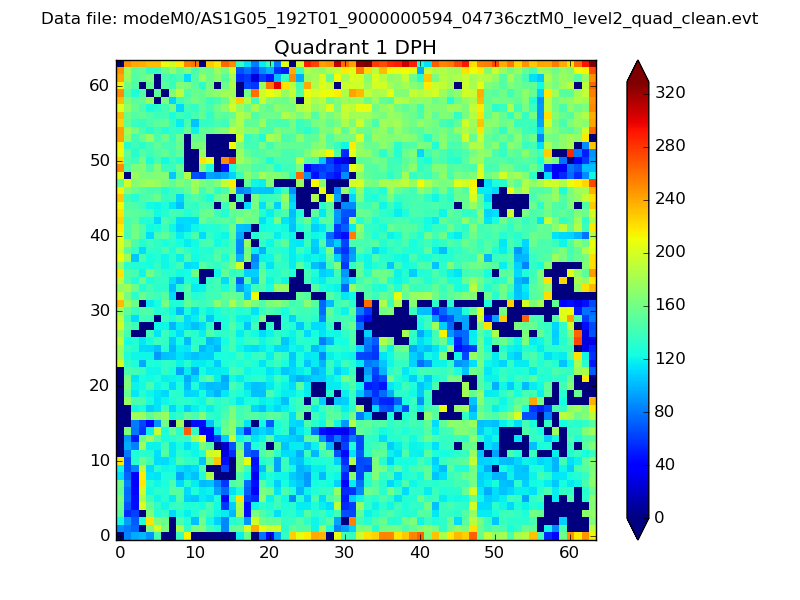 |
Quadrant B |
|---|---|---|---|
| Quadrant D | 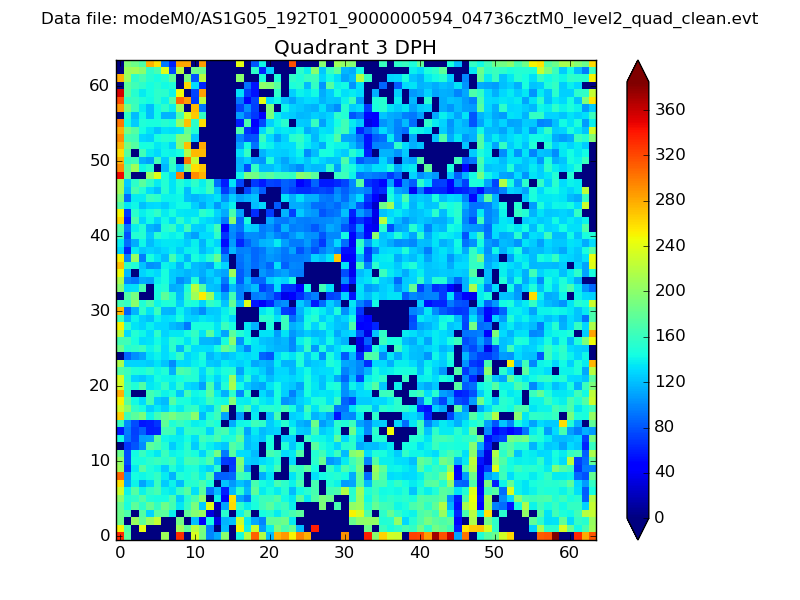 |
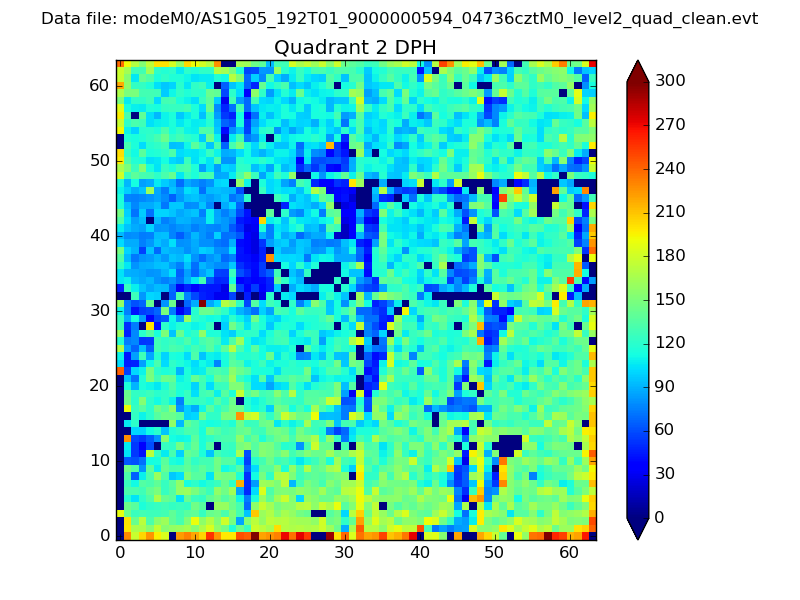 |
Quadrant C |
| Plot type | Count rate plots | Images |
|---|---|---|
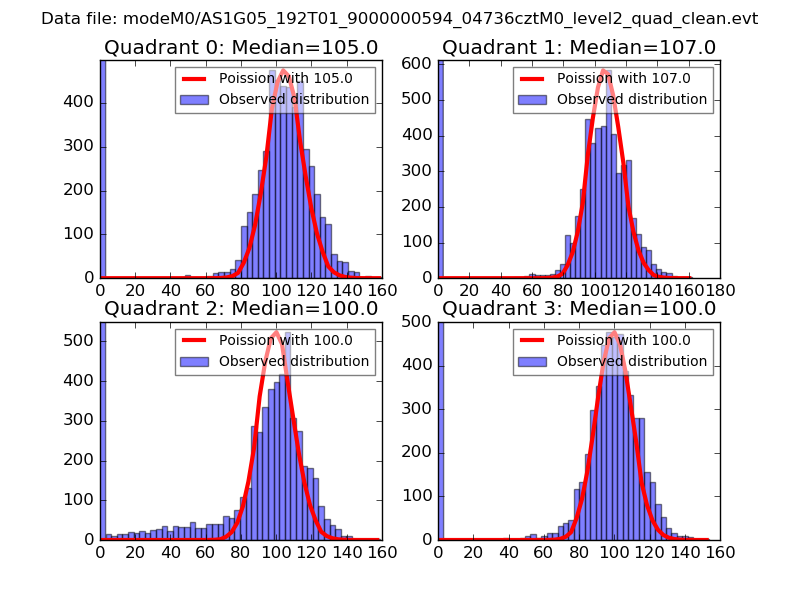
| Comparison with Poisson distribution Blue bars denote a histogram of data divided into 1 sec bins. Red curve is a Poisson curve with rate = median count rate of data. |
 |
 |
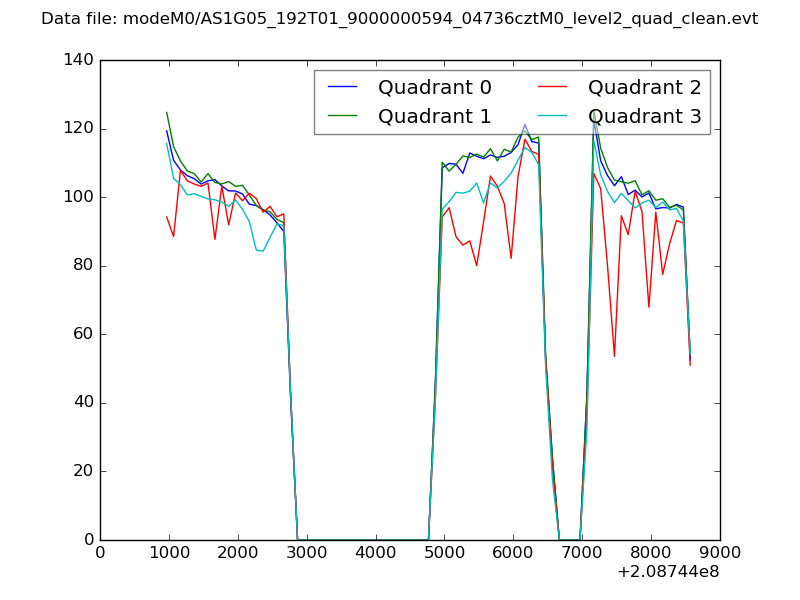
| Quadrant-wise count rates Data is divided into 100 sec bins |
 |
|
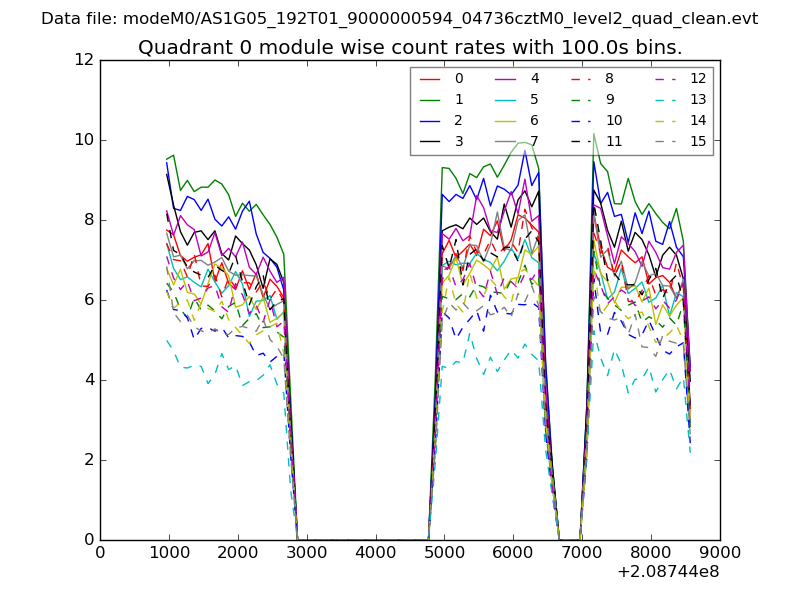
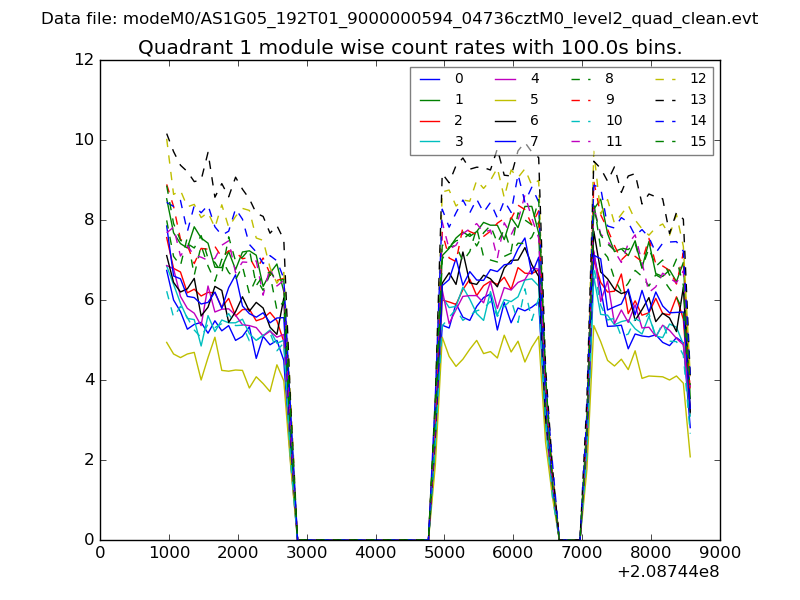
| Module-wise count rates for Quadrant A Data is divided into 100 sec bins |
 |
 |
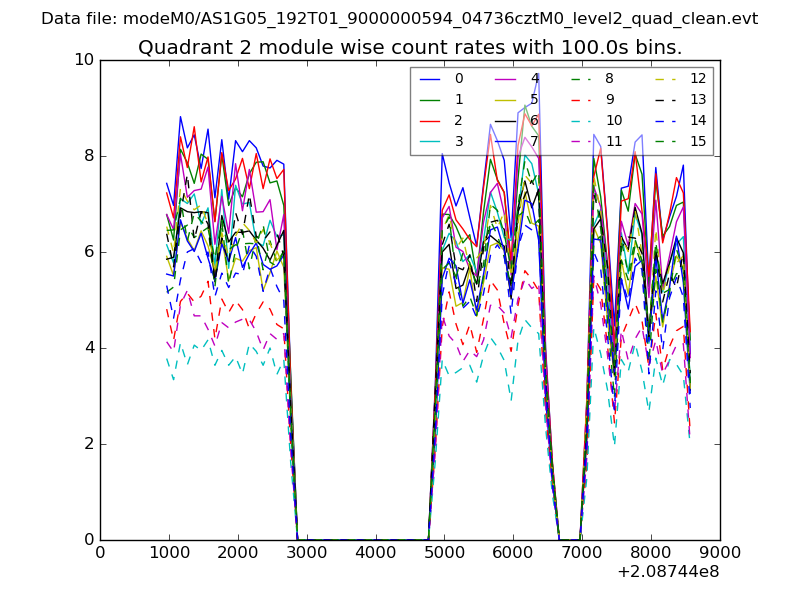
| Module-wise count rates for Quadrant B Data is divided into 100 sec bins |
 |
 |
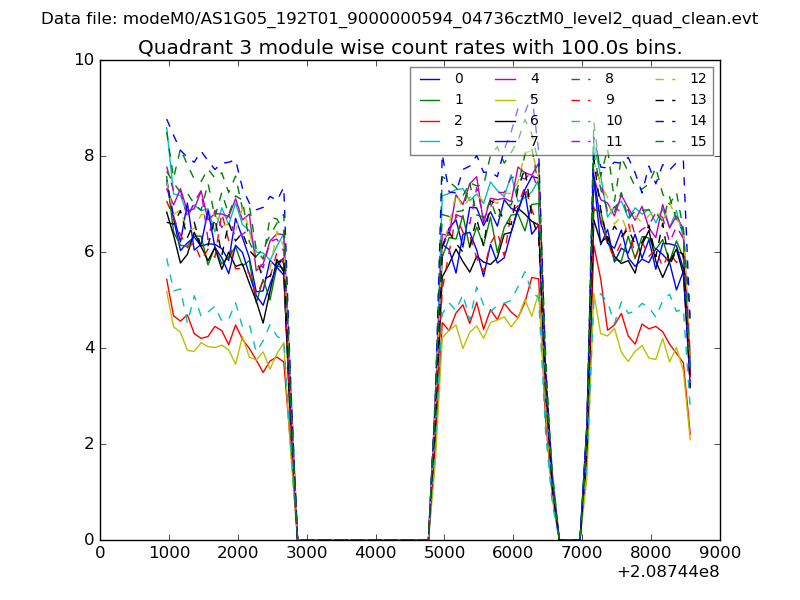
| Module-wise count rates for Quadrant C Data is divided into 100 sec bins |
 |
 |
| Module-wise count rates for Quadrant D Data is divided into 100 sec bins |
 |
 |
| Parameter | Plot |
|---|---|
| CZT HV Monitor | 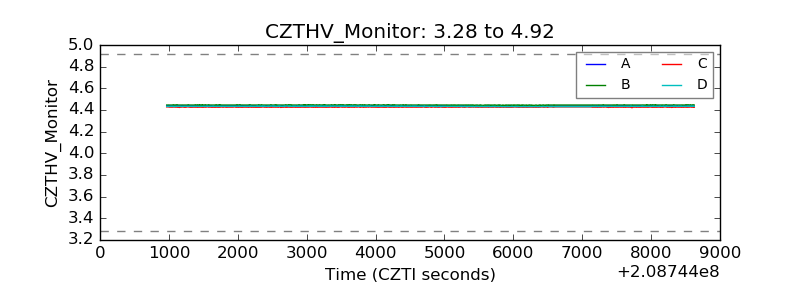 |
| D_VDD |  |
| Temperature 1 | 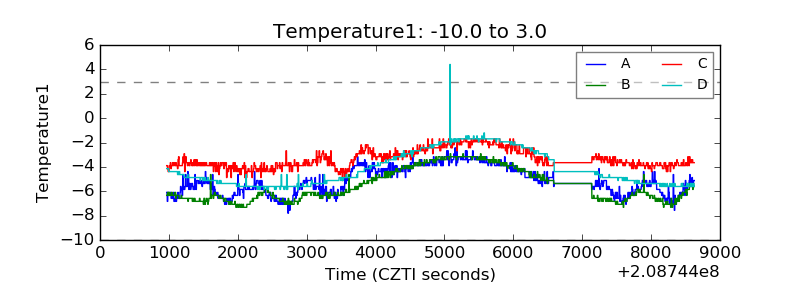 |
| Veto HV Monitor | 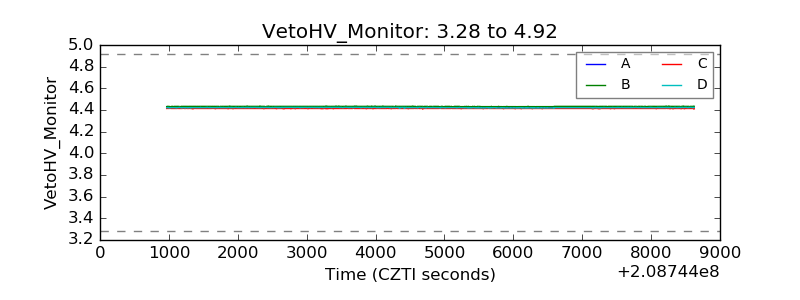 |
| Veto LLD | 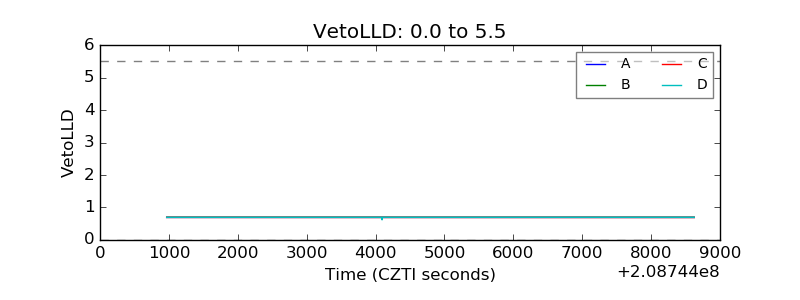 |
| Alpha Counter | 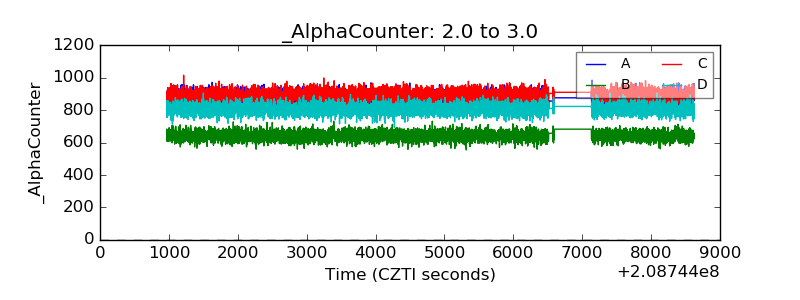 |
| _CPM_Rate | 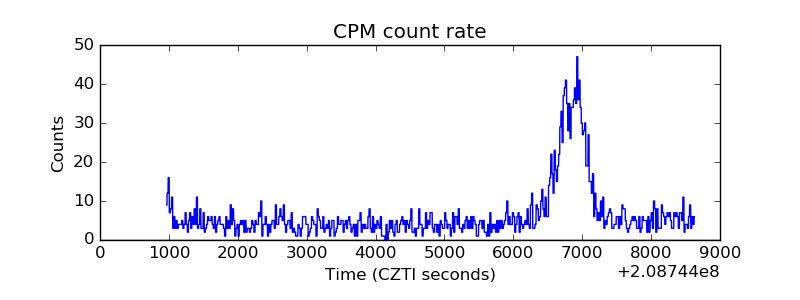 |
| CZT Counter | 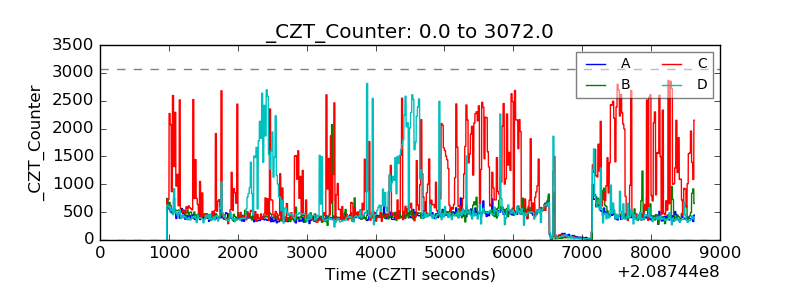 |
| +2.5 Volts monitor |  |
| +5 Volts monitor |  |
| _ROLL_ROT | 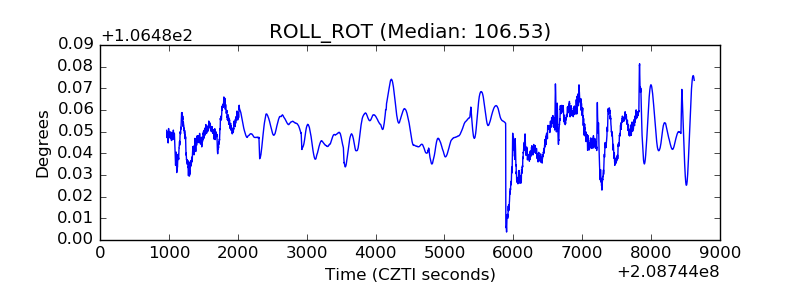 |
| _Roll_DEC | 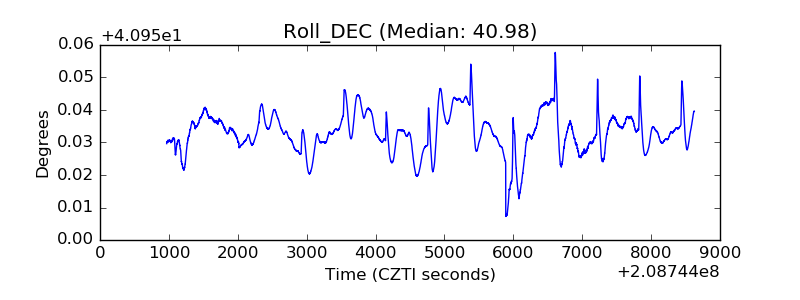 |
| _Roll_RA |  |
| Veto Counter | 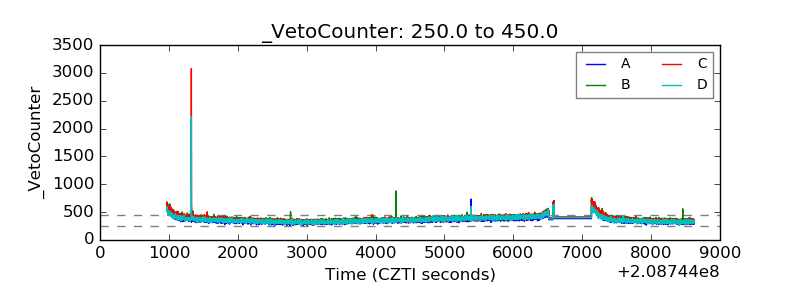 |