| Param | Original file | Final file |
|---|---|---|
| Filename | modeM0/AS1G05_192T01_9000000594_04737cztM0_level2.evt | modeM0/AS1G05_192T01_9000000594_04737cztM0_level2_quad_clean.evt |
| Size (bytes) | 798,338,880 | 89,769,600 |
| Size | 761.4 MB | 85.6 MB |
| Events in quadrant A | 3,614,659 | 564,731 |
| Events in quadrant B | 3,892,740 | 573,189 |
| Events in quadrant C | 8,093,884 | 526,172 |
| Events in quadrant D | 8,039,514 | 501,277 |
| Mode SS | |||
|---|---|---|---|
| Quadrant | BADHDUFLAG | Total packets | Discarded packets |
| A | 0 | 164 | 0 |
| B | 0 | 164 | 0 |
| C | 0 | 164 | 0 |
| D | 0 | 164 | 0 |
| Mode M9 | |||
|---|---|---|---|
| Quadrant | BADHDUFLAG | Total packets | Discarded packets |
| A | 0 | 7 | 0 |
| B | 0 | 7 | 0 |
| C | 0 | 7 | 0 |
| D | 0 | 7 | 0 |
| Mode M0 | |||
|---|---|---|---|
| Quadrant | BADHDUFLAG | Total packets | Discarded packets |
| A | 0 | 16581 | 4 |
| B | 0 | 17025 | 3 |
| C | 0 | 29484 | 3 |
| D | 0 | 29566 | 3 |
| Quadrant | Total seconds | Saturated seconds | Saturation percentage |
|---|---|---|---|
| A | 7940 | 203 | 2.556675% |
| B | 7940 | 247 | 3.110831% |
| C | 7940 | 1246 | 15.692695% |
| D | 7940 | 1489 | 18.753149% |
Noise dominated data is calculated using 1-second bins in cleaned event files. If a bin has >2000 counts, and if more than 50% of those come from <1% of pixels, then it is considered to be noise-dominated and hence unusable.
| Quadrant | # 1 sec bins | Bins with >0 counts | Bins with >2000 counts | High rate bins dominated by noise | Noise dominated (total time) | Noise dominated (detector-on time) | Marked lightcurve |
|---|---|---|---|---|---|---|---|
| A | 8675 | 7945 | 7 | 7 | 0.08% | 0.09% | 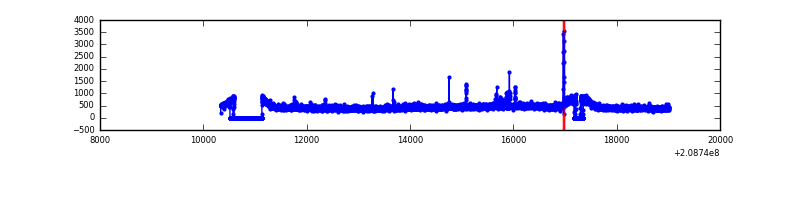 |
| B | 8675 | 7945 | 1 | 1 | 0.01% | 0.01% | 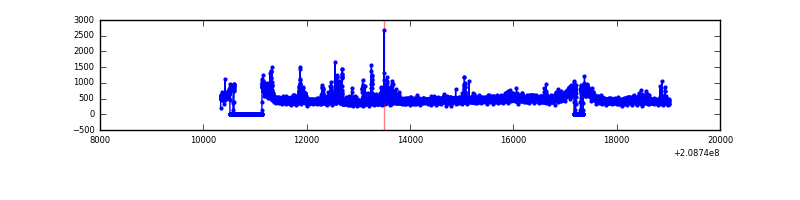 |
| C | 8675 | 7944 | 891 | 891 | 10.27% | 11.22% | 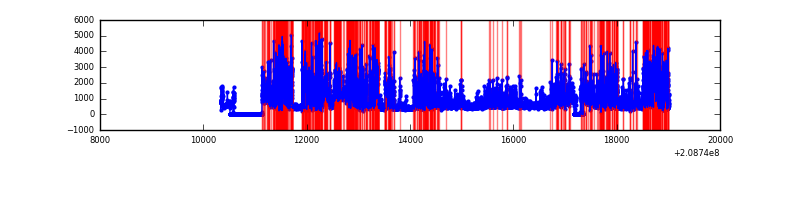 |
| D | 8675 | 7945 | 1079 | 1079 | 12.44% | 13.58% | 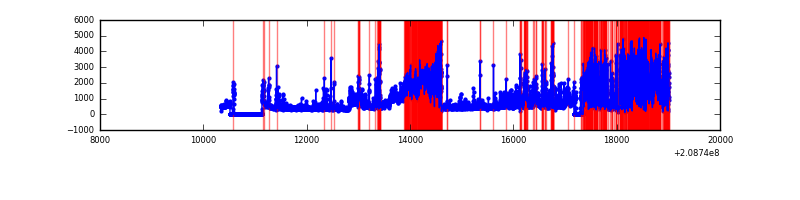 |
Top three noisy pixels from each quadrant. If the there are fewer than three noisy pixels in the level2.evt file, extra rows are filled as -1
| Pixel properties | Quadrant properties | ||||||
|---|---|---|---|---|---|---|---|
| Quadrant | DetID | PixID | Counts | Sigma | Mean | Median | Sigma |
| A | 0 | 118 | 30105 | 155.84 | 918 | 895 | 187.4 |
| A | 0 | 50 | 23327 | 119.68 | 918 | 895 | 187.4 |
| A | 15 | 254 | 13580 | 67.68 | 918 | 895 | 187.4 |
| B | 14 | 167 | 242544 | 1336.84 | 933 | 906 | 180.8 |
| B | 4 | 80 | 29934 | 160.59 | 933 | 906 | 180.8 |
| B | 12 | 111 | 17271 | 90.54 | 933 | 906 | 180.8 |
| C | 14 | 48 | 4772652 | 24239.22 | 847 | 850 | 196.9 |
| C | 14 | 67 | 8562 | 39.17 | 847 | 850 | 196.9 |
| C | 13 | 61 | 6947 | 30.97 | 847 | 850 | 196.9 |
| D | 1 | 31 | 2193188 | 11187.62 | 818 | 794 | 196.0 |
| D | 13 | 53 | 1800793 | 9185.26 | 818 | 794 | 196.0 |
| D | 2 | 234 | 450695 | 2295.81 | 818 | 794 | 196.0 |
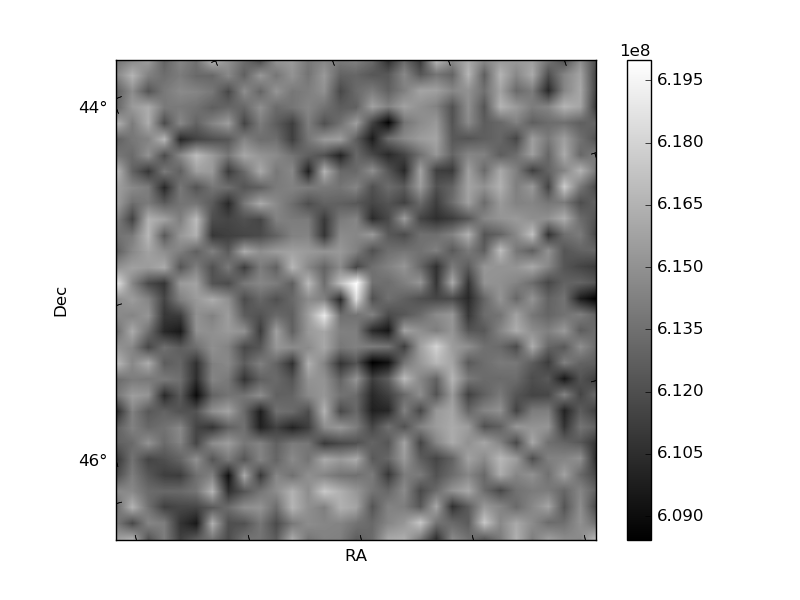
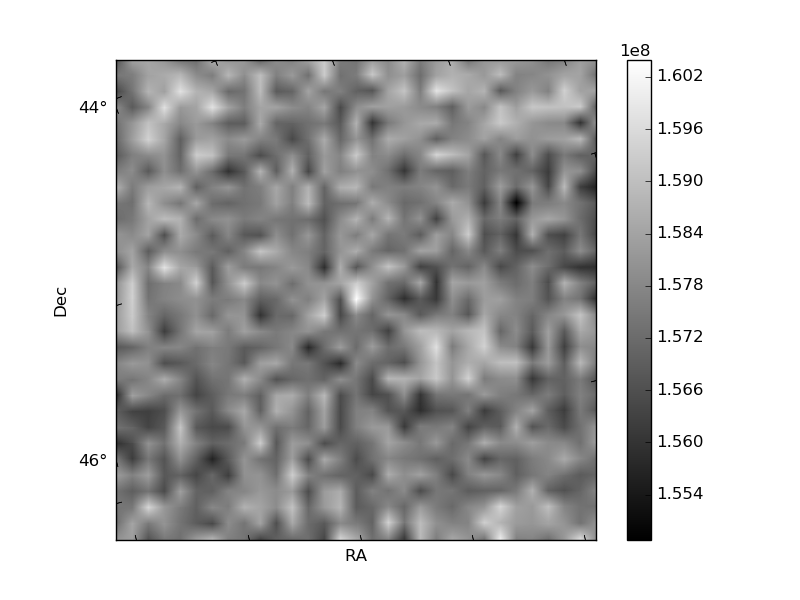
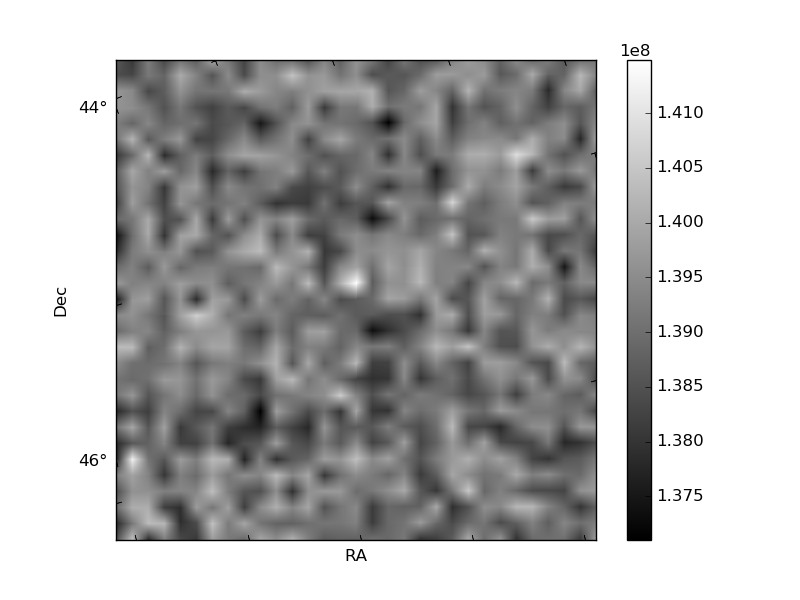
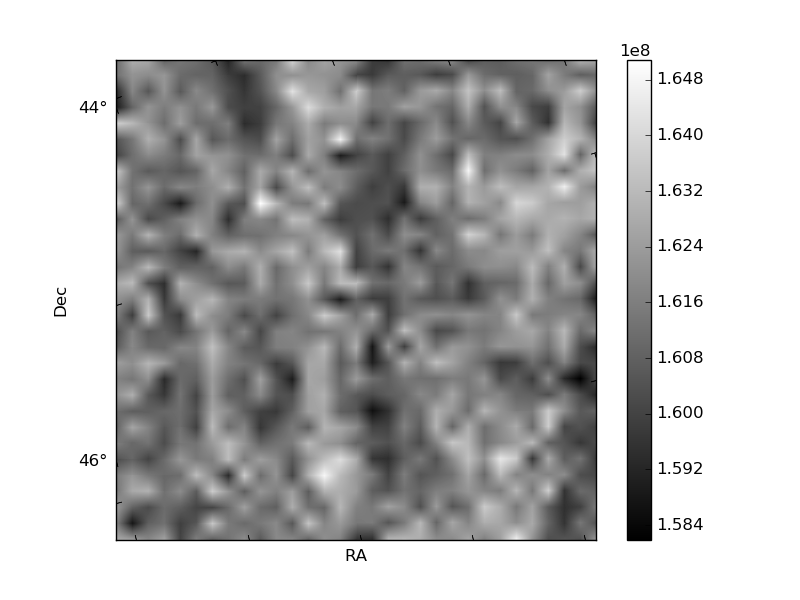
Histogram calculated using DETX and DETY for each event in the final _common_clean file
| Quadrant A | 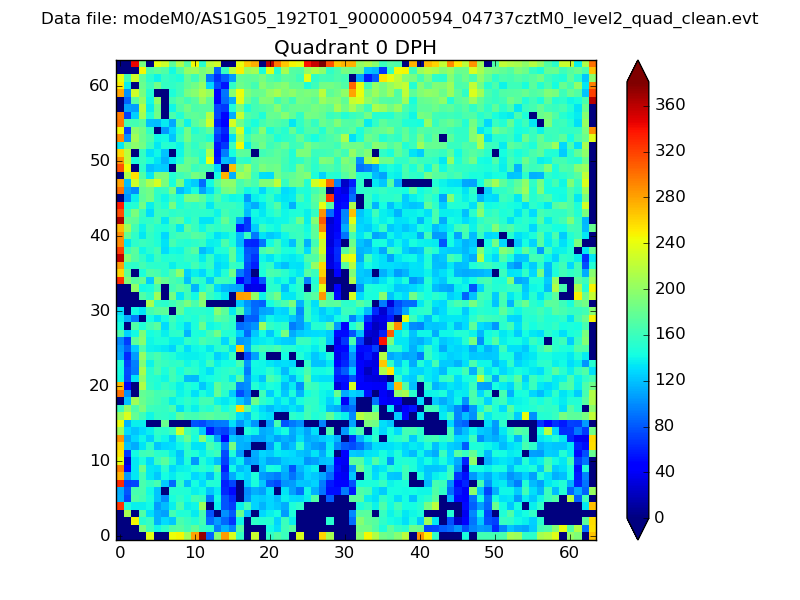 |
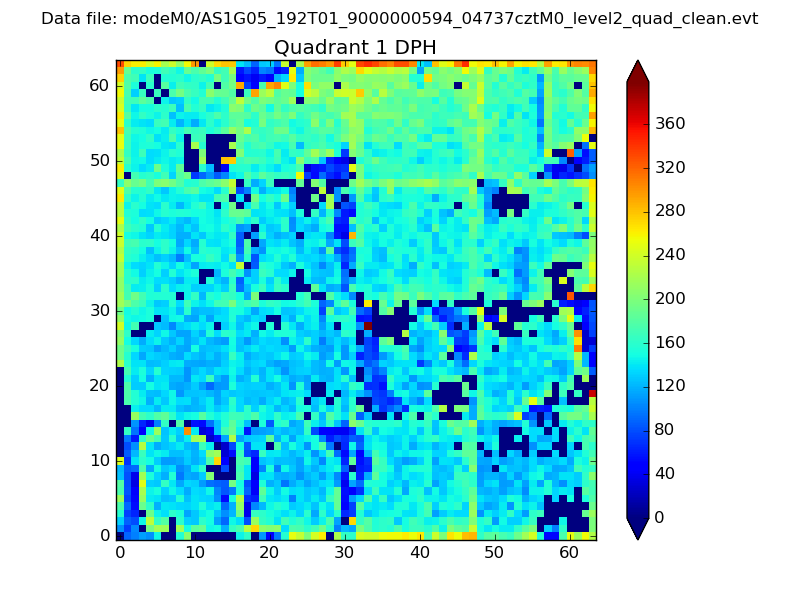 |
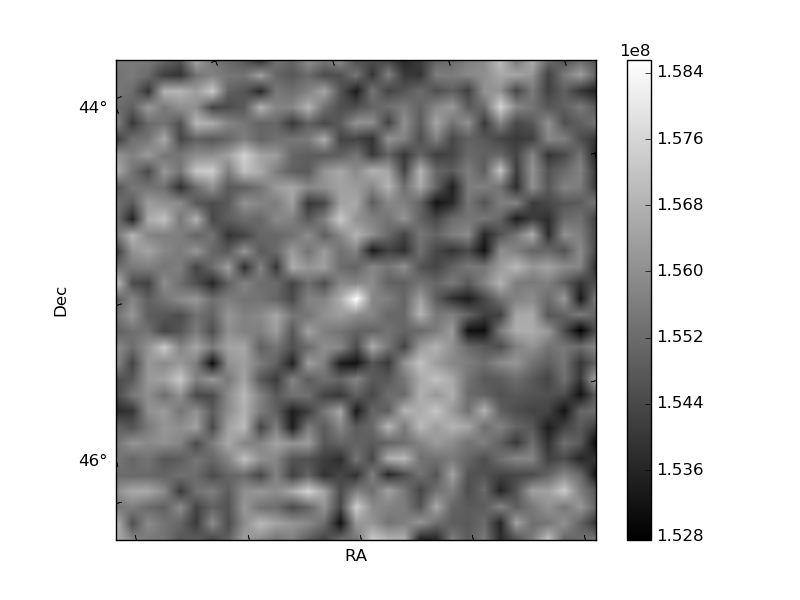
Quadrant B |
|---|---|---|---|
| Quadrant D | 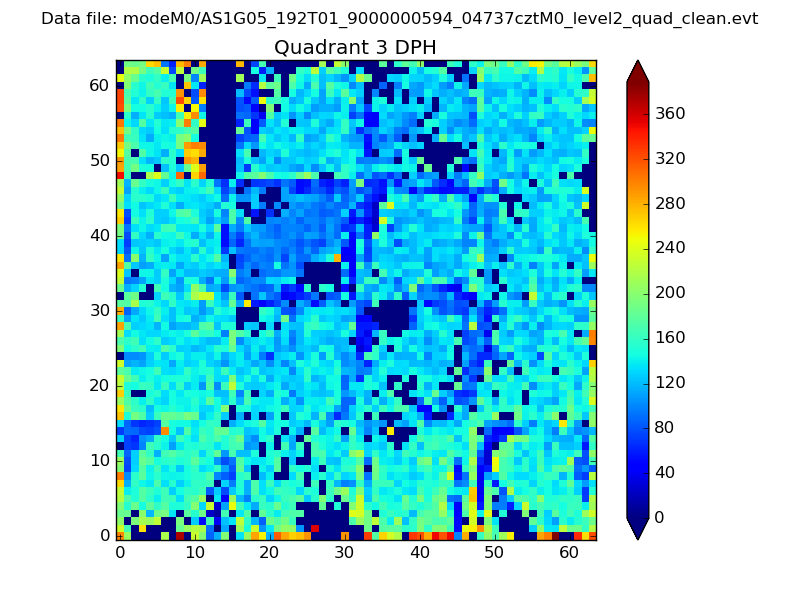 |
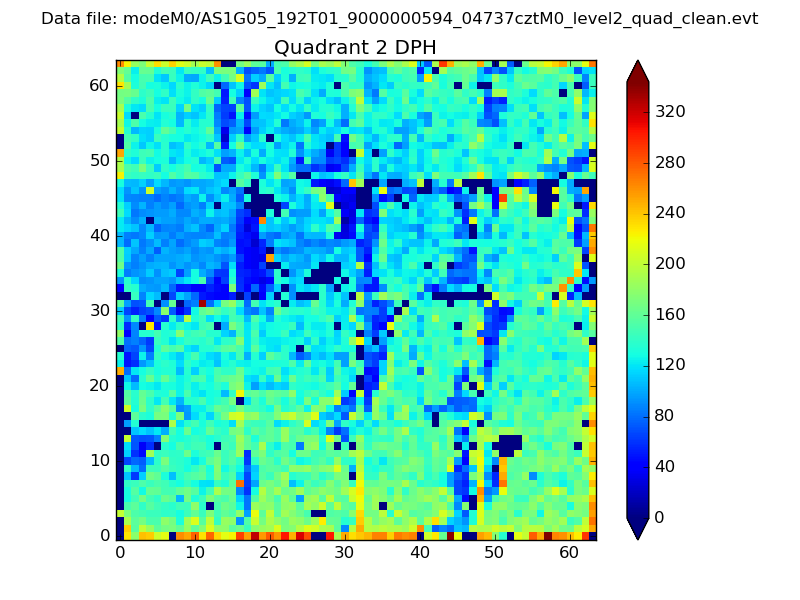 |
Quadrant C |
| Plot type | Count rate plots | Images |
|---|---|---|
| Comparison with Poisson distribution Blue bars denote a histogram of data divided into 1 sec bins. Red curve is a Poisson curve with rate = median count rate of data. |
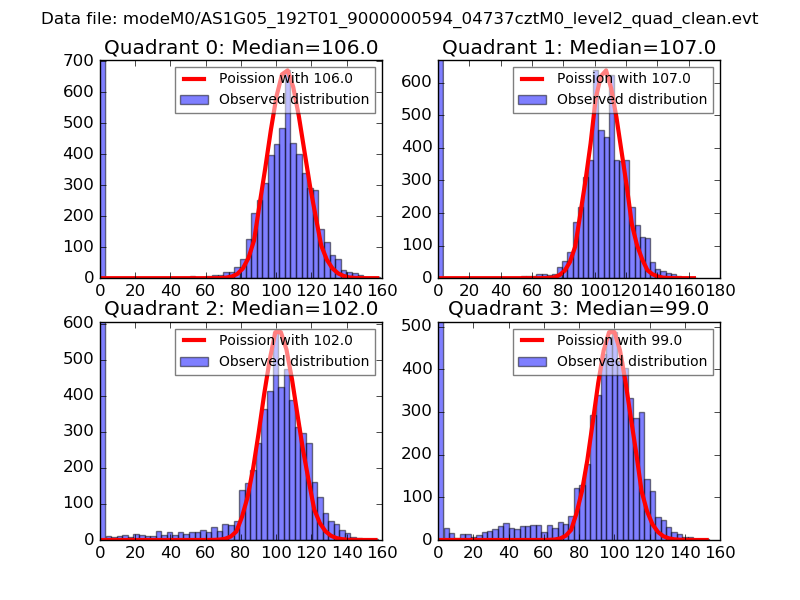 |
 |
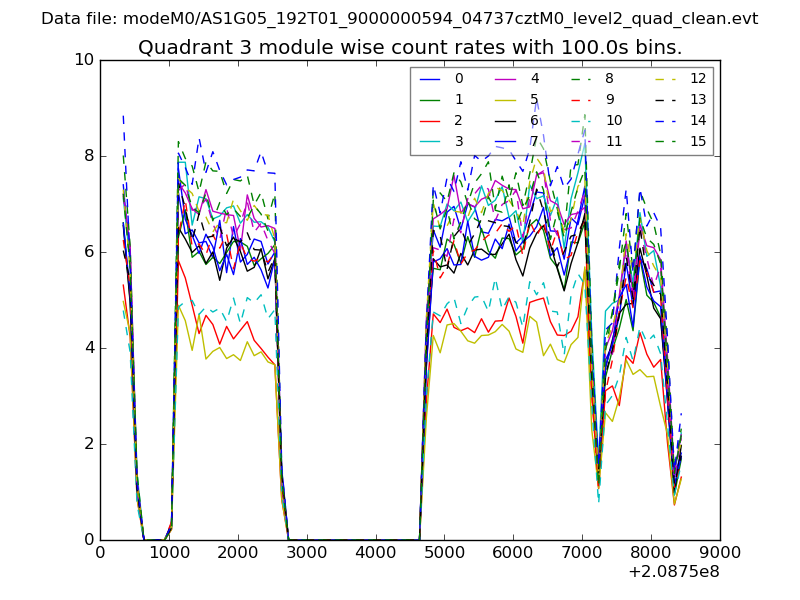
| Quadrant-wise count rates Data is divided into 100 sec bins |
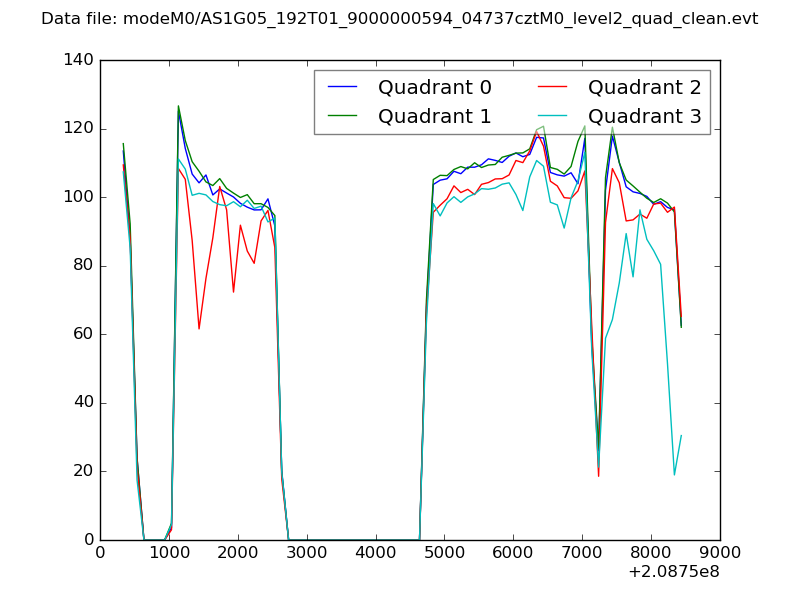 |
|
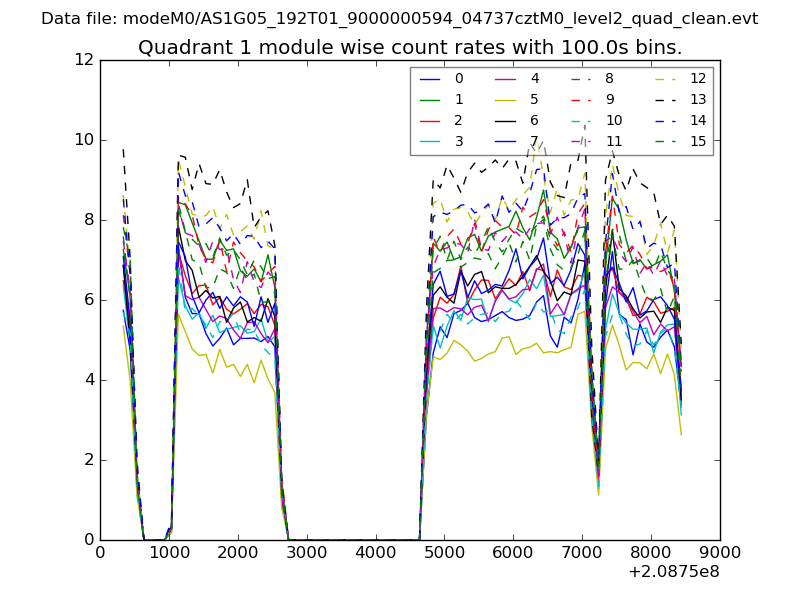
| Module-wise count rates for Quadrant A Data is divided into 100 sec bins |
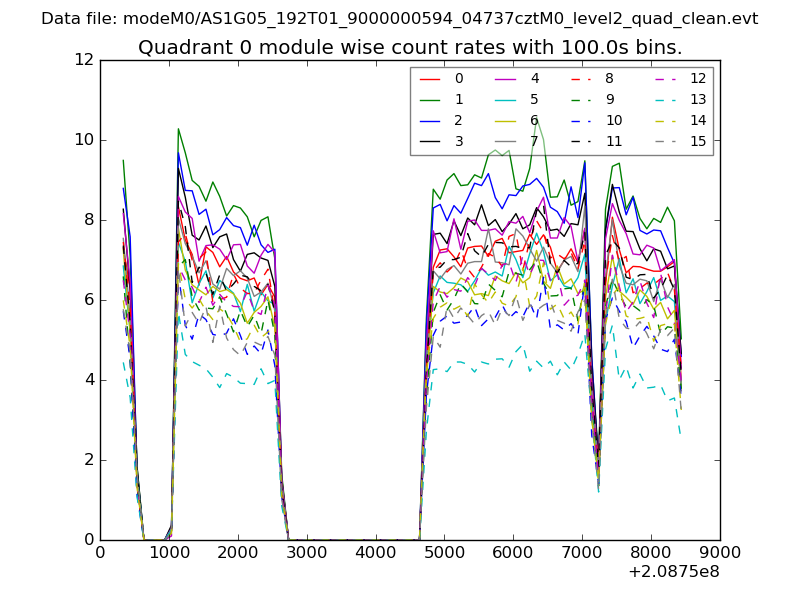 |
 |
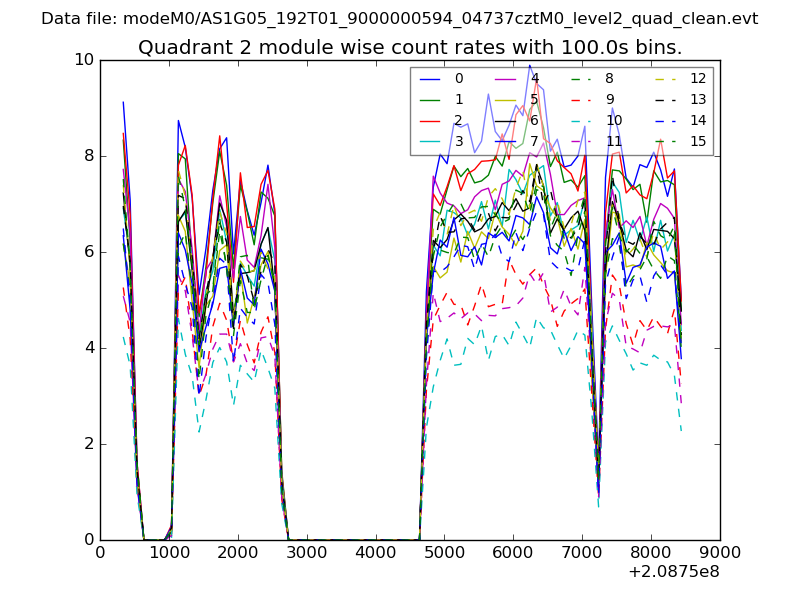
| Module-wise count rates for Quadrant B Data is divided into 100 sec bins |
 |
 |
| Module-wise count rates for Quadrant C Data is divided into 100 sec bins |
 |
 |
| Module-wise count rates for Quadrant D Data is divided into 100 sec bins |
 |
 |
| Parameter | Plot |
|---|---|
| CZT HV Monitor | 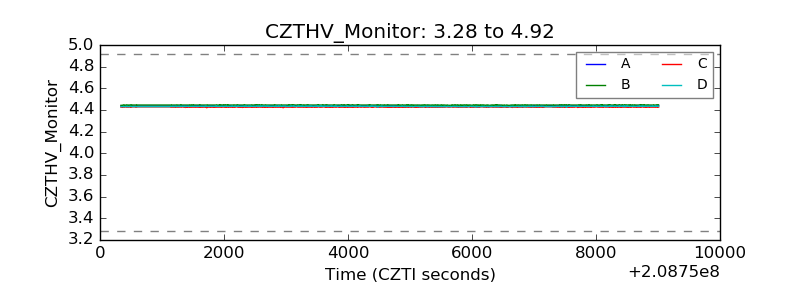 |
| D_VDD | 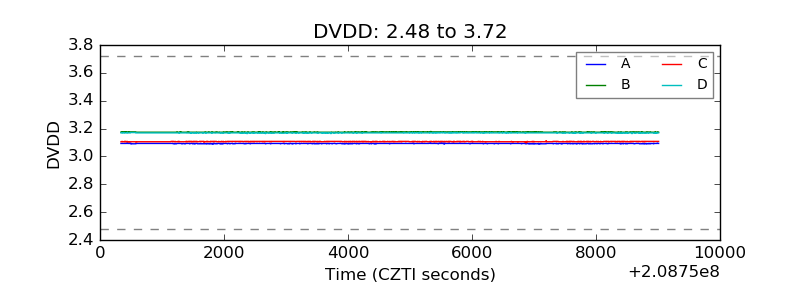 |
| Temperature 1 | 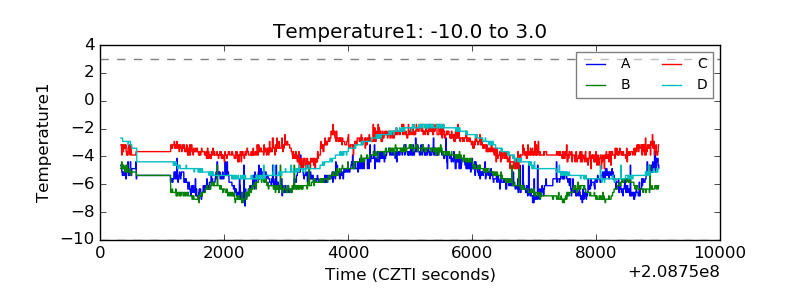 |
| Veto HV Monitor | 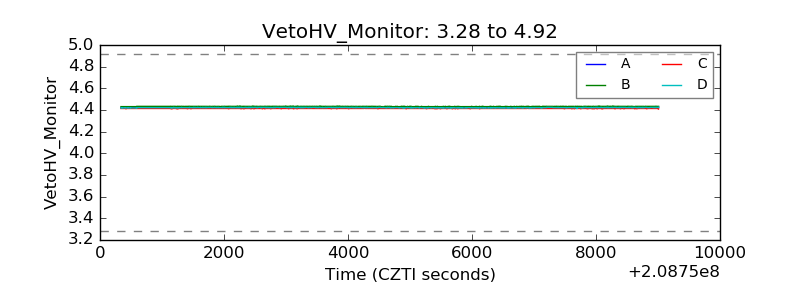 |
| Veto LLD | 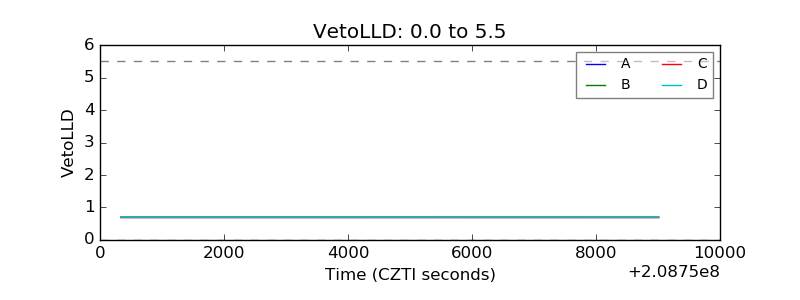 |
| Alpha Counter | 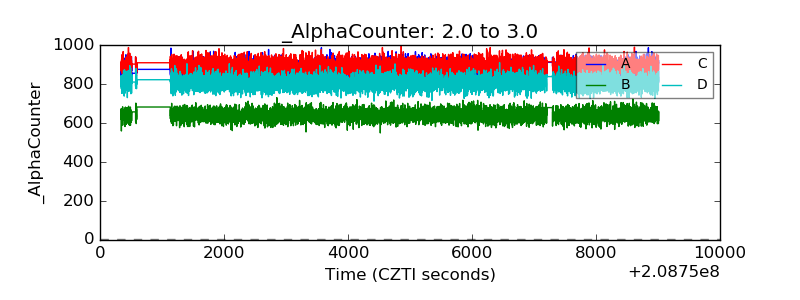 |
| _CPM_Rate | 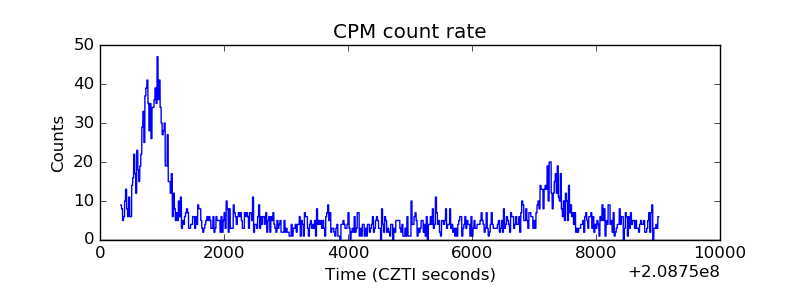 |
| CZT Counter | 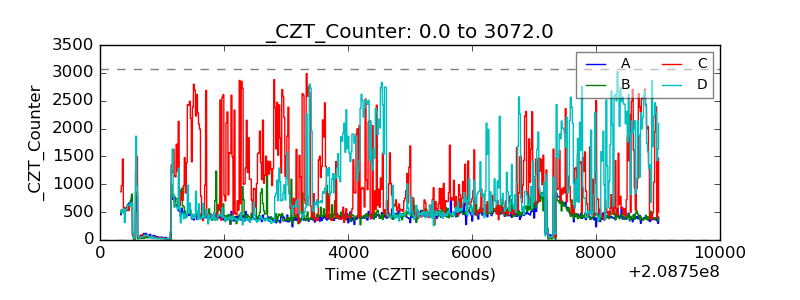 |
| +2.5 Volts monitor | 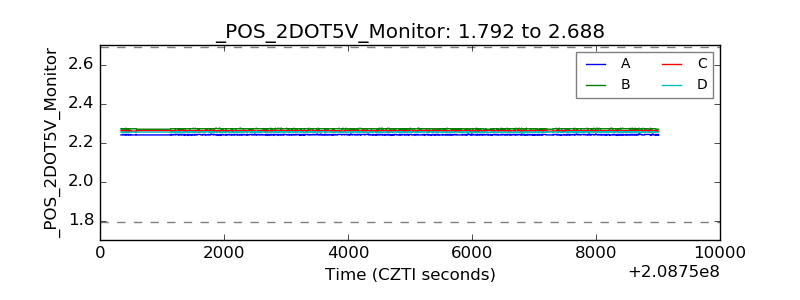 |
| +5 Volts monitor | 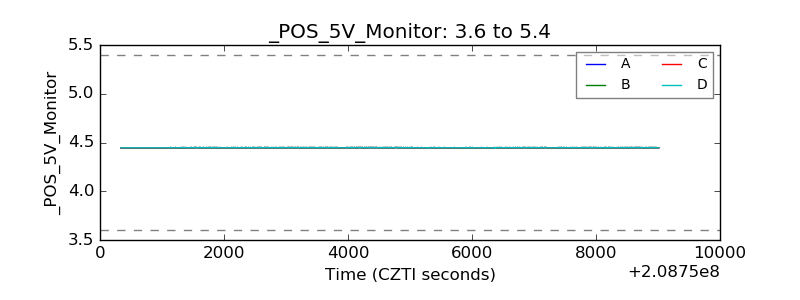 |
| _ROLL_ROT | 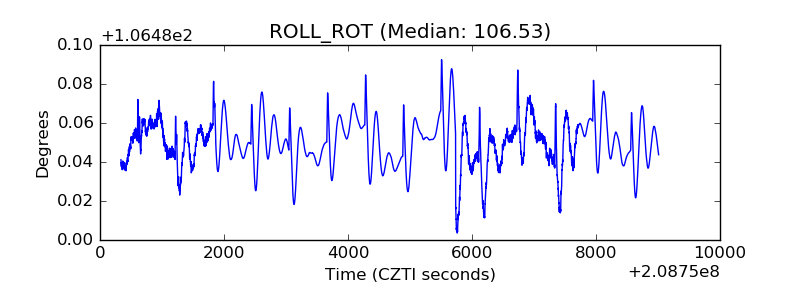 |
| _Roll_DEC | 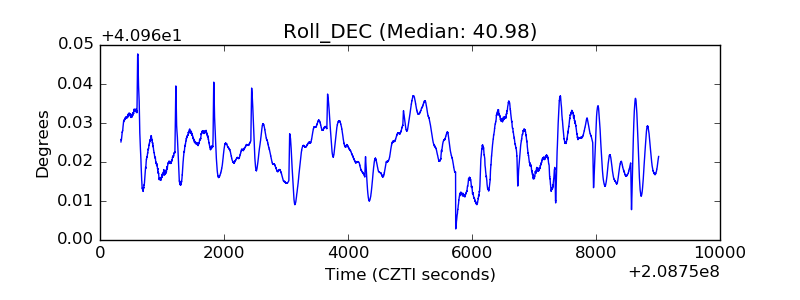 |
| _Roll_RA | 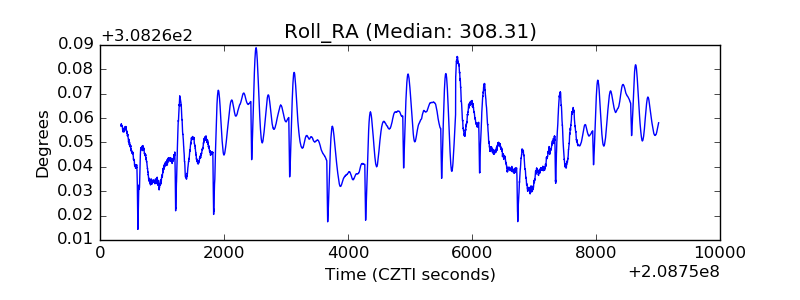 |
| Veto Counter | 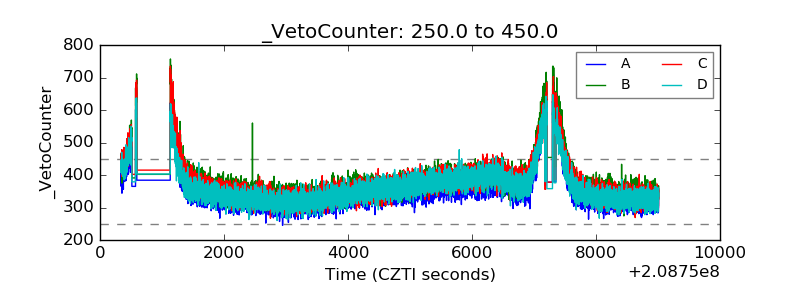 |