| Param | Original file | Final file |
|---|---|---|
| Filename | modeM0/AS1G05_192T01_9000000594_04738cztM0_level2.evt | modeM0/AS1G05_192T01_9000000594_04738cztM0_level2_quad_clean.evt |
| Size (bytes) | 307,062,720 | 14,302,080 |
| Size | 292.8 MB | 13.6 MB |
| Events in quadrant A | 1,130,986 | 64,240 |
| Events in quadrant B | 1,252,263 | 63,874 |
| Events in quadrant C | 2,368,607 | 61,972 |
| Events in quadrant D | 4,358,470 | 44,280 |
| Mode SS | |||
|---|---|---|---|
| Quadrant | BADHDUFLAG | Total packets | Discarded packets |
| A | 0 | 56 | 0 |
| B | 0 | 56 | 0 |
| C | 0 | 56 | 0 |
| D | 0 | 56 | 0 |
| Mode M0 | |||
|---|---|---|---|
| Quadrant | BADHDUFLAG | Total packets | Discarded packets |
| A | 0 | 5535 | 0 |
| B | 0 | 5723 | 0 |
| C | 0 | 8984 | 0 |
| D | 0 | 14872 | 0 |
| Quadrant | Total seconds | Saturated seconds | Saturation percentage |
|---|---|---|---|
| A | 2761 | 2 | 0.072438% |
| B | 2761 | 10 | 0.362188% |
| C | 2761 | 333 | 12.060848% |
| D | 2761 | 1125 | 40.746106% |
Noise dominated data is calculated using 1-second bins in cleaned event files. If a bin has >2000 counts, and if more than 50% of those come from <1% of pixels, then it is considered to be noise-dominated and hence unusable.
| Quadrant | # 1 sec bins | Bins with >0 counts | Bins with >2000 counts | High rate bins dominated by noise | Noise dominated (total time) | Noise dominated (detector-on time) | Marked lightcurve |
|---|---|---|---|---|---|---|---|
| A | 2761 | 2761 | 2 | 2 | 0.07% | 0.07% | 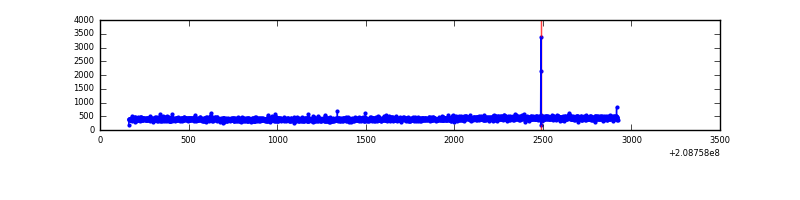 |
| B | 2761 | 2761 | 6 | 6 | 0.22% | 0.22% | 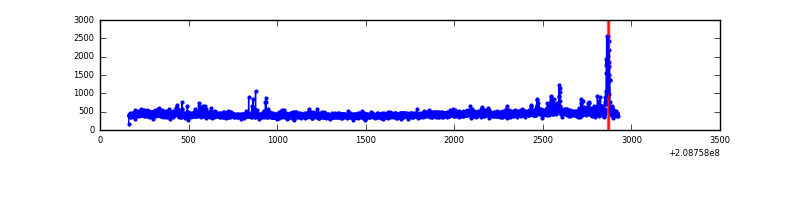 |
| C | 2761 | 2761 | 297 | 297 | 10.76% | 10.76% | 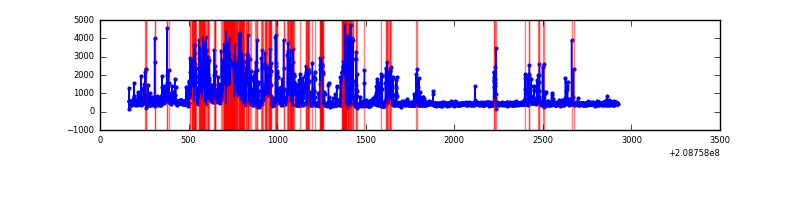 |
| D | 2761 | 2761 | 926 | 926 | 33.54% | 33.54% | 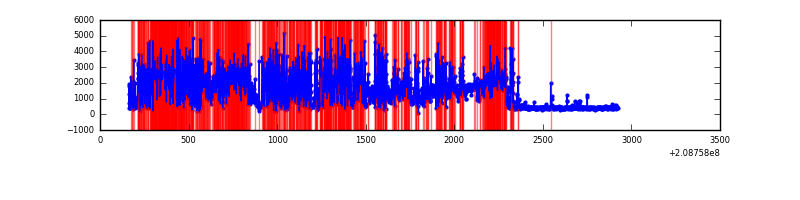 |
Top three noisy pixels from each quadrant. If the there are fewer than three noisy pixels in the level2.evt file, extra rows are filled as -1
| Pixel properties | Quadrant properties | ||||||
|---|---|---|---|---|---|---|---|
| Quadrant | DetID | PixID | Counts | Sigma | Mean | Median | Sigma |
| A | 0 | 118 | 5533 | 85.3 | 292 | 285 | 61.5 |
| A | 0 | 226 | 3315 | 49.25 | 292 | 285 | 61.5 |
| A | 12 | 194 | 2911 | 42.68 | 292 | 285 | 61.5 |
| B | 14 | 167 | 94756 | 1638.55 | 294 | 286 | 57.7 |
| B | 4 | 80 | 13569 | 230.39 | 294 | 286 | 57.7 |
| B | 12 | 111 | 5552 | 91.34 | 294 | 286 | 57.7 |
| C | 14 | 48 | 1321898 | 21034.41 | 263 | 264 | 62.8 |
| C | 8 | 208 | 11131 | 172.95 | 263 | 264 | 62.8 |
| C | 14 | 67 | 4565 | 68.45 | 263 | 264 | 62.8 |
| D | 1 | 31 | 1907987 | 35110.19 | 220 | 213 | 54.3 |
| D | 13 | 53 | 799254 | 14705.35 | 220 | 213 | 54.3 |
| D | 2 | 234 | 681338 | 12535.25 | 220 | 213 | 54.3 |
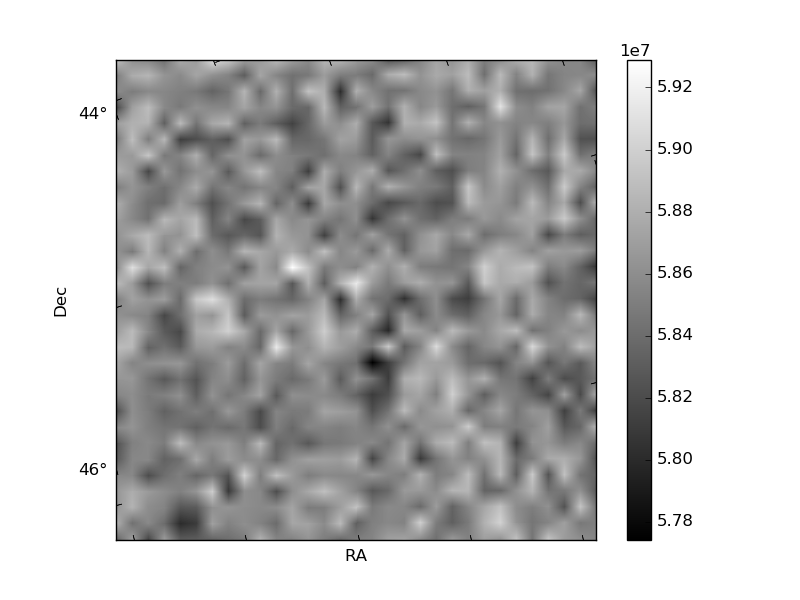
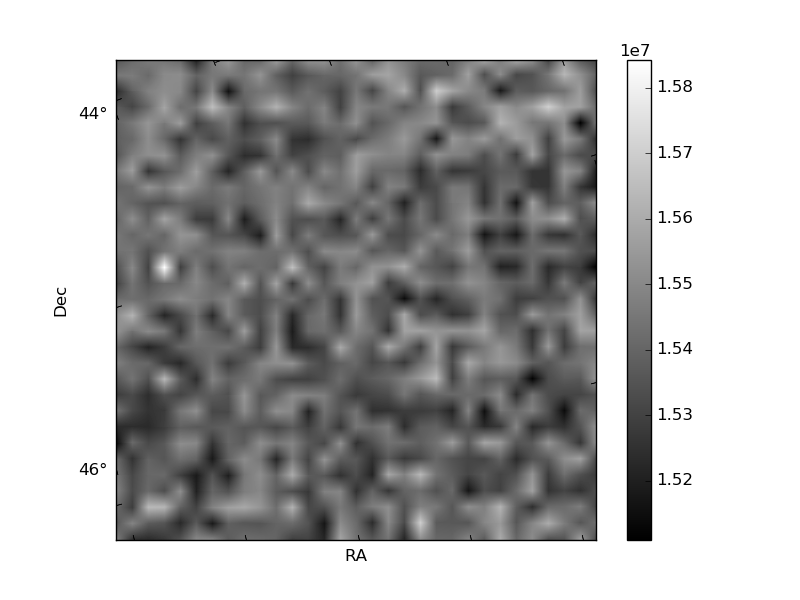
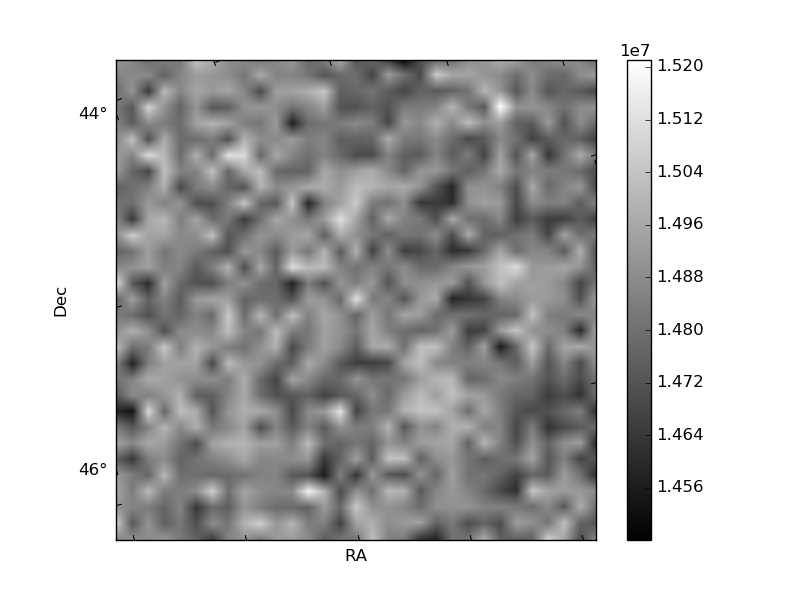
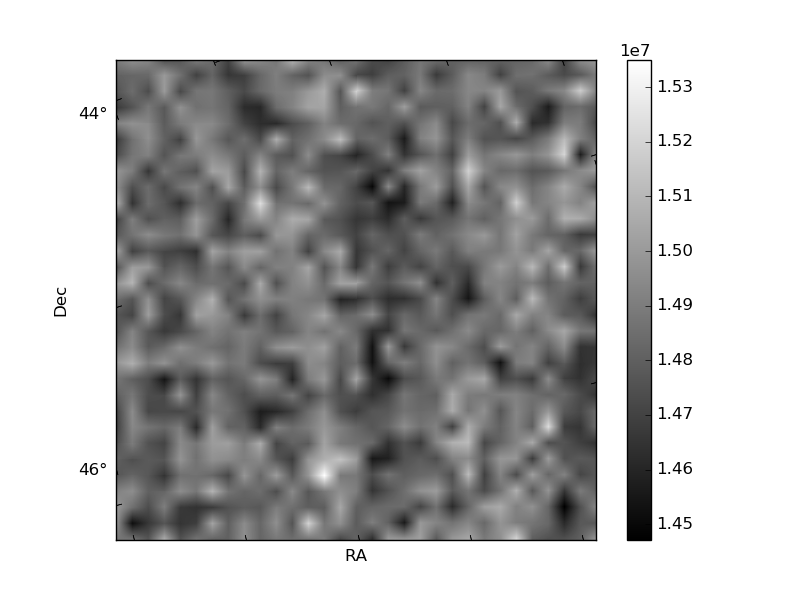
Histogram calculated using DETX and DETY for each event in the final _common_clean file
| Quadrant A | 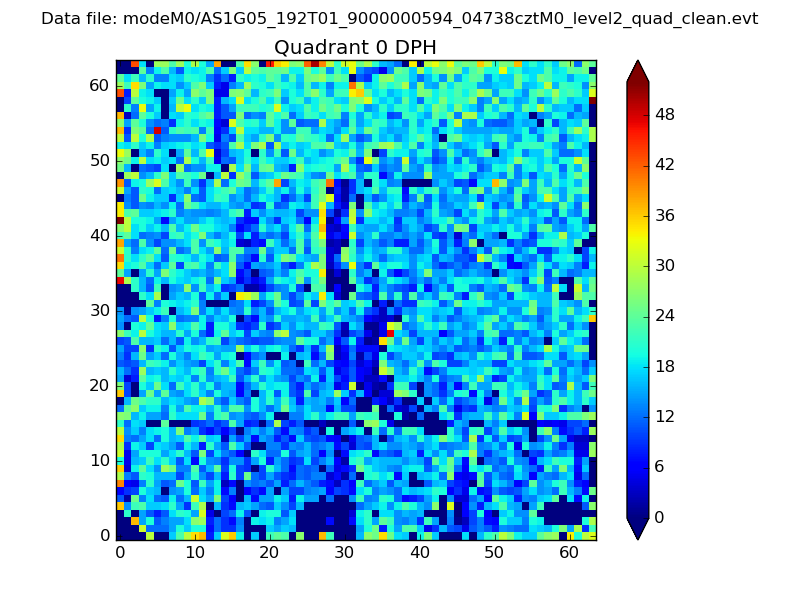 |
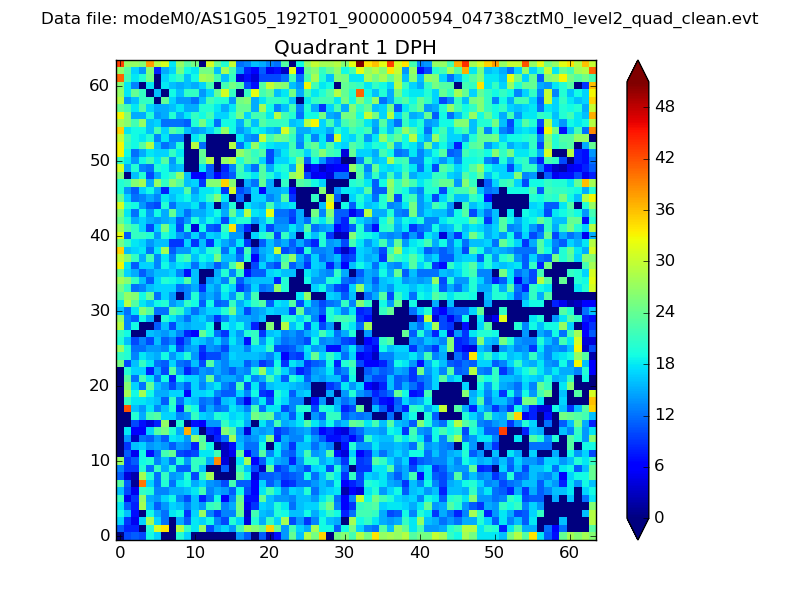 |
Quadrant B |
|---|---|---|---|
| Quadrant D | 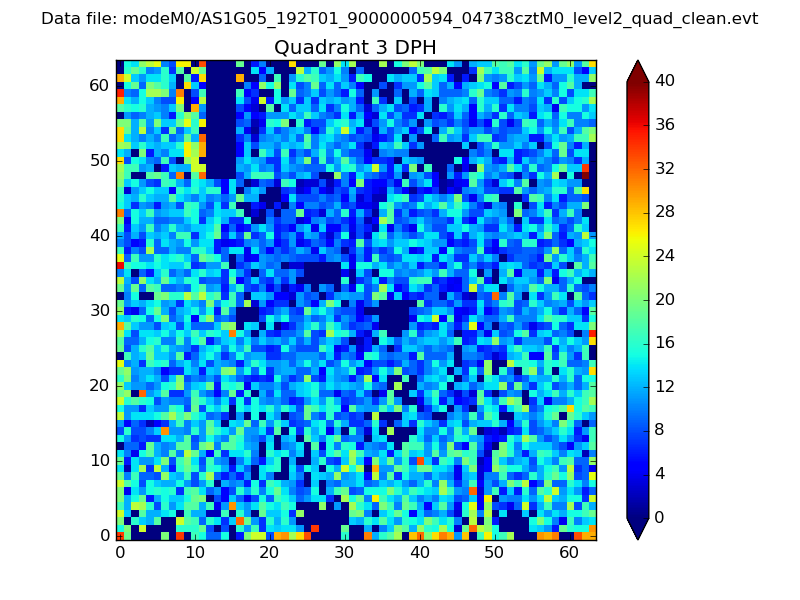 |
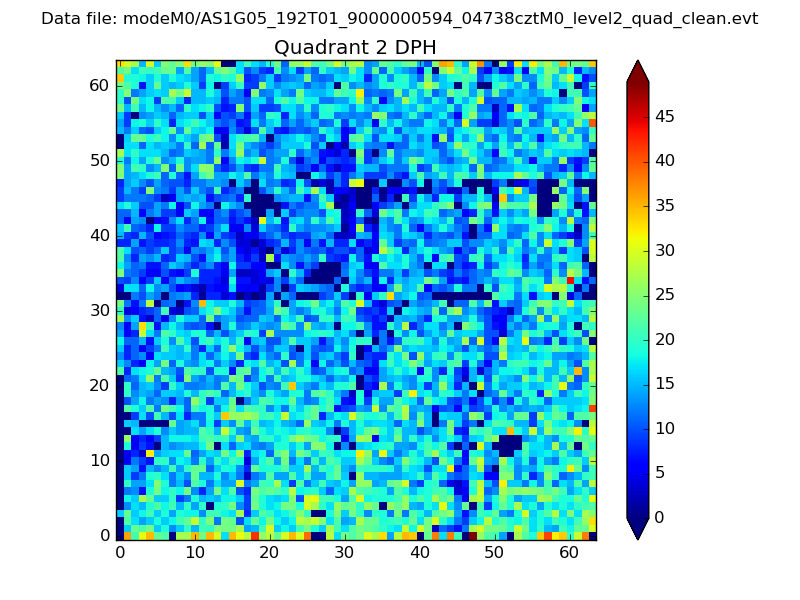 |
Quadrant C |
| Plot type | Count rate plots | Images |
|---|---|---|
| Comparison with Poisson distribution Blue bars denote a histogram of data divided into 1 sec bins. Red curve is a Poisson curve with rate = median count rate of data. |
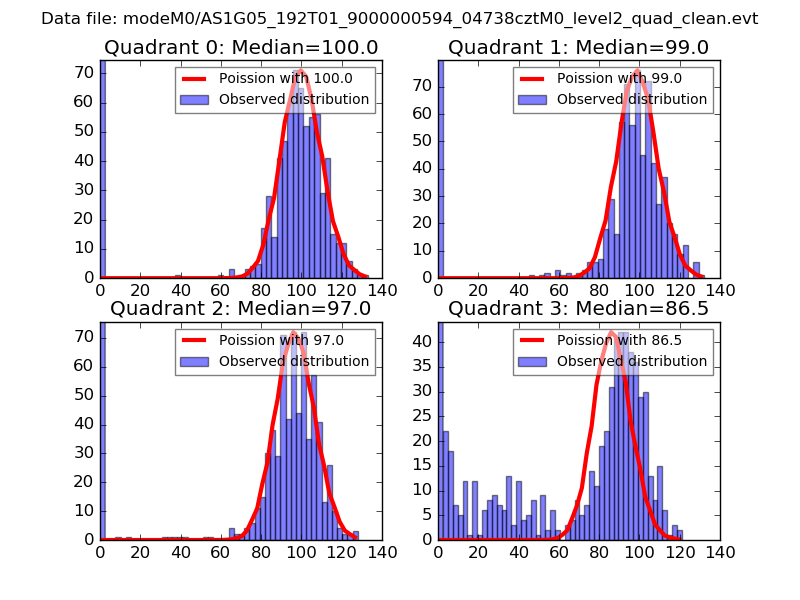 |
 |
| Quadrant-wise count rates Data is divided into 100 sec bins |
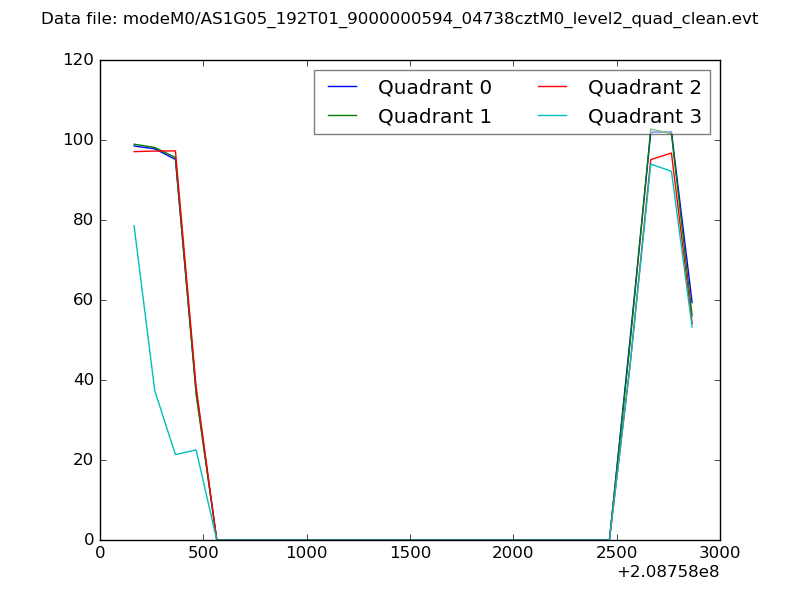 |
|
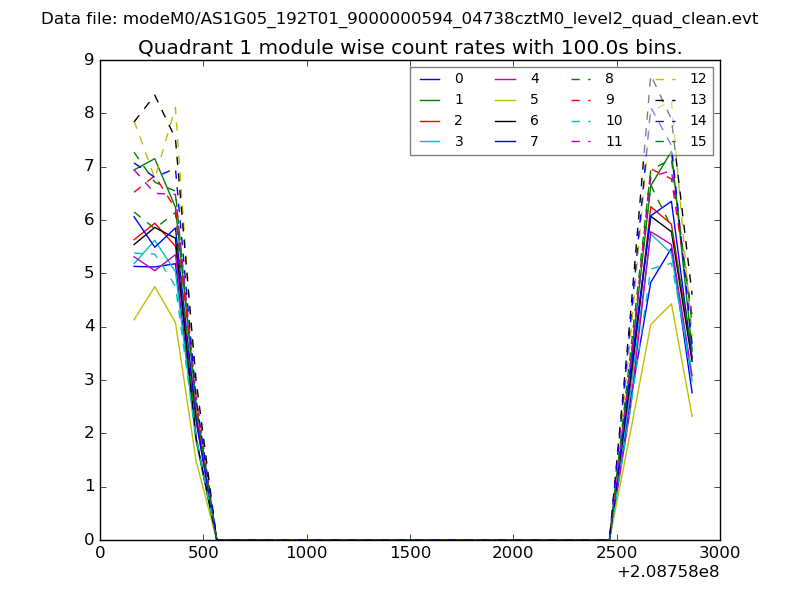
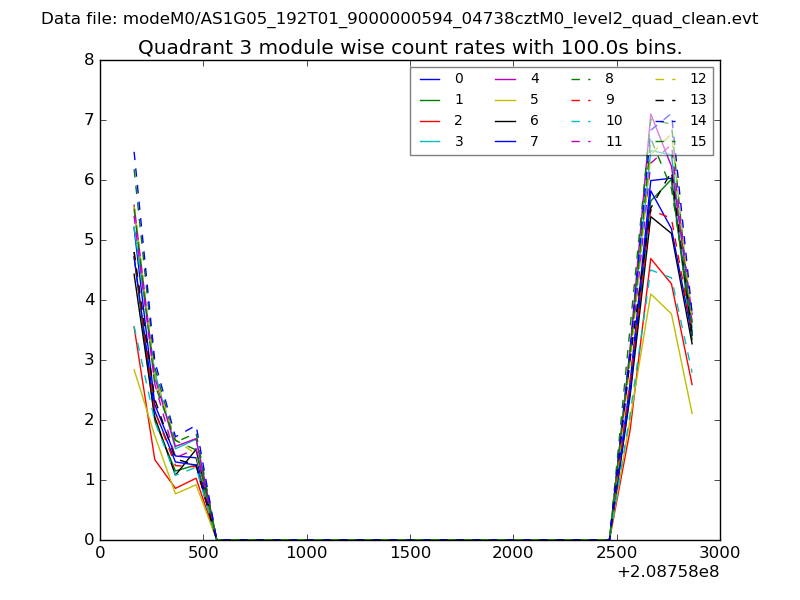
| Module-wise count rates for Quadrant A Data is divided into 100 sec bins |
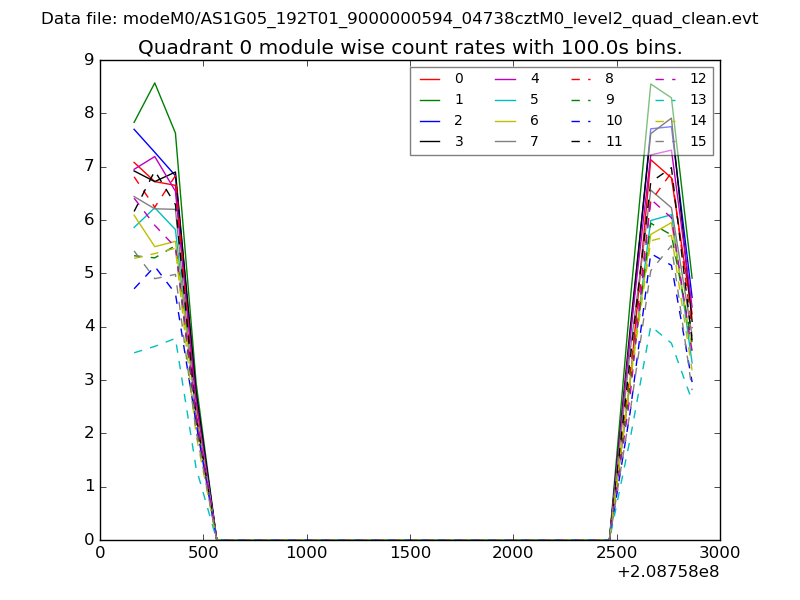 |
 |
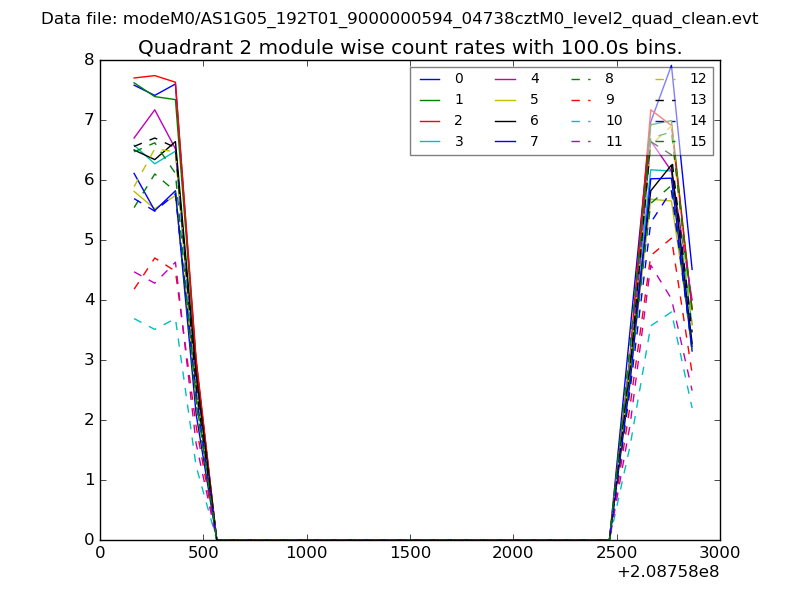
| Module-wise count rates for Quadrant B Data is divided into 100 sec bins |
 |
 |
| Module-wise count rates for Quadrant C Data is divided into 100 sec bins |
 |
 |
| Module-wise count rates for Quadrant D Data is divided into 100 sec bins |
 |
 |
| Parameter | Plot |
|---|---|
| CZT HV Monitor | 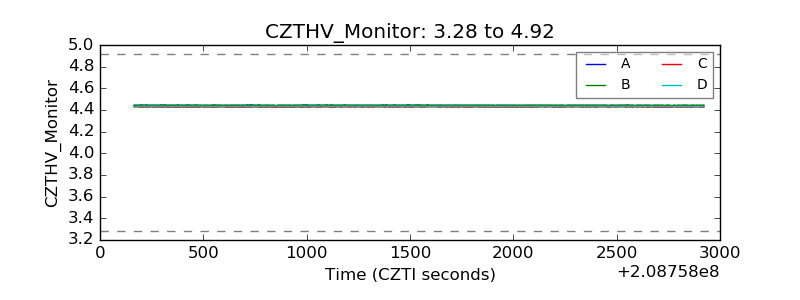 |
| D_VDD |  |
| Temperature 1 | 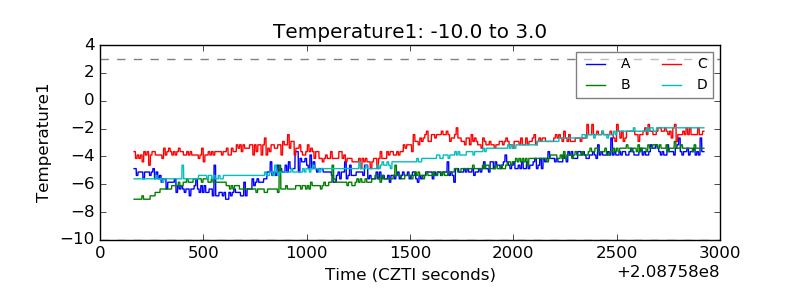 |
| Veto HV Monitor | 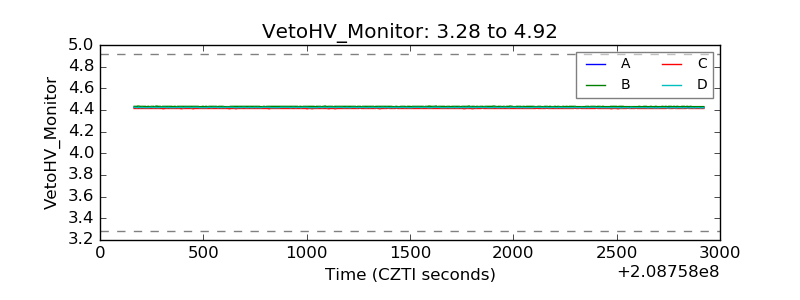 |
| Veto LLD | 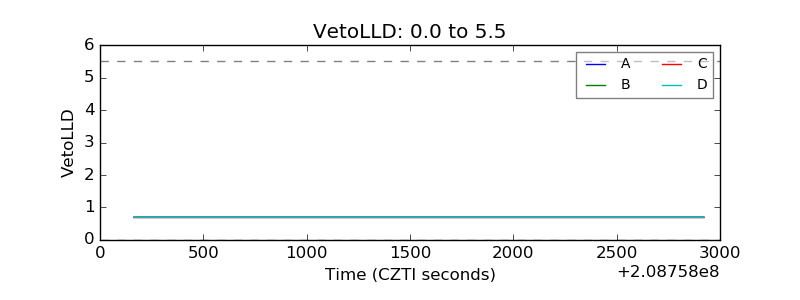 |
| Alpha Counter | 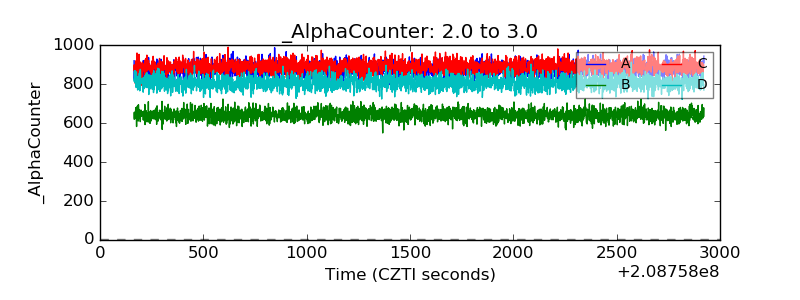 |
| _CPM_Rate | 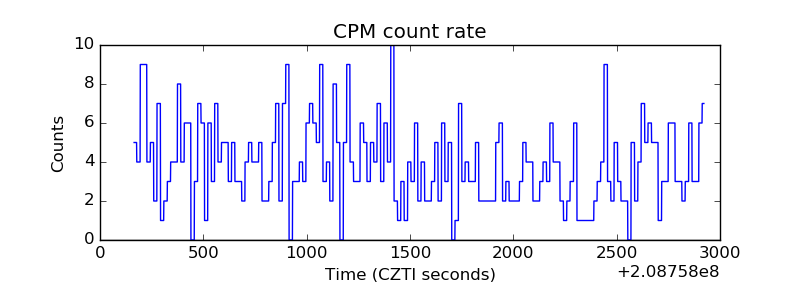 |
| CZT Counter | 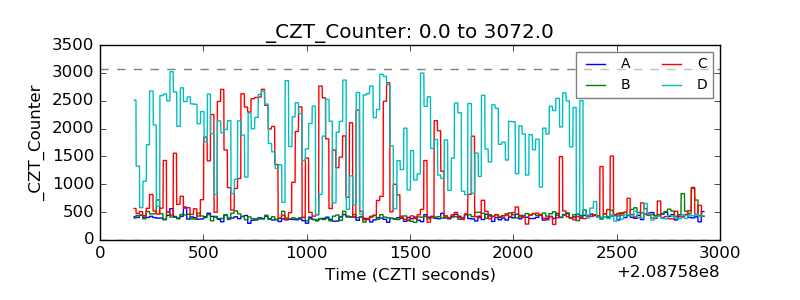 |
| +2.5 Volts monitor |  |
| +5 Volts monitor |  |
| _ROLL_ROT | 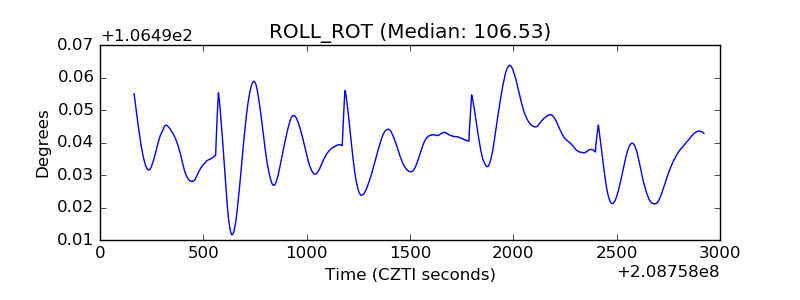 |
| _Roll_DEC | 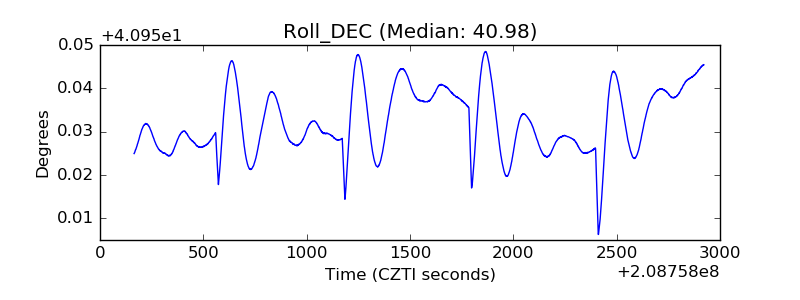 |
| _Roll_RA | 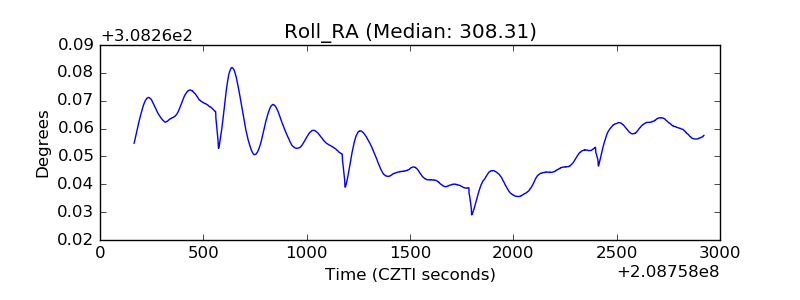 |
| Veto Counter | 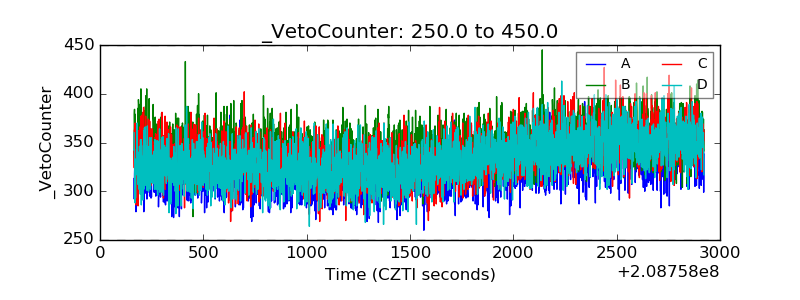 |