| Param | Original file | Final file |
|---|---|---|
| Filename | modeM0/AS1SLEW_01234_9000000593_04727cztM0_level2.evt | modeM0/AS1SLEW_01234_9000000593_04727cztM0_level2_quad_clean.evt |
| Size (bytes) | 90,817,920 | 3,625,920 |
| Size | 86.6 MB | 3.5 MB |
| Events in quadrant A | 473,874 | 6,239 |
| Events in quadrant B | 599,497 | 6,212 |
| Events in quadrant C | 628,768 | 6,043 |
| Events in quadrant D | 969,692 | 5,731 |
| Mode SS | |||
|---|---|---|---|
| Quadrant | BADHDUFLAG | Total packets | Discarded packets |
| A | 0 | 22 | 0 |
| B | 0 | 22 | 0 |
| C | 0 | 22 | 0 |
| D | 0 | 22 | 0 |
| Mode M0 | |||
|---|---|---|---|
| Quadrant | BADHDUFLAG | Total packets | Discarded packets |
| A | 0 | 2290 | 0 |
| B | 0 | 2558 | 0 |
| C | 0 | 2608 | 0 |
| D | 0 | 3701 | 0 |
| Quadrant | Total seconds | Saturated seconds | Saturation percentage |
|---|---|---|---|
| A | 1113 | 3 | 0.269542% |
| B | 1113 | 13 | 1.168014% |
| C | 1113 | 45 | 4.043127% |
| D | 1113 | 59 | 5.300988% |
Noise dominated data is calculated using 1-second bins in cleaned event files. If a bin has >2000 counts, and if more than 50% of those come from <1% of pixels, then it is considered to be noise-dominated and hence unusable.
| Quadrant | # 1 sec bins | Bins with >0 counts | Bins with >2000 counts | High rate bins dominated by noise | Noise dominated (total time) | Noise dominated (detector-on time) | Marked lightcurve |
|---|---|---|---|---|---|---|---|
| A | 1113 | 1113 | 3 | 3 | 0.27% | 0.27% | 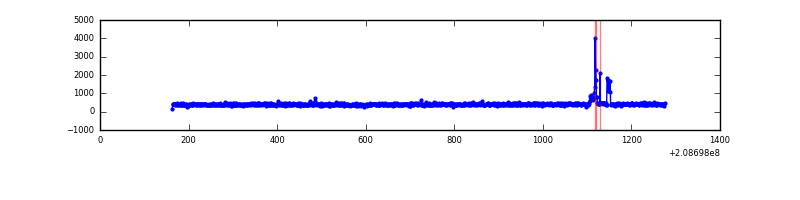 |
| B | 1113 | 1113 | 8 | 8 | 0.72% | 0.72% | 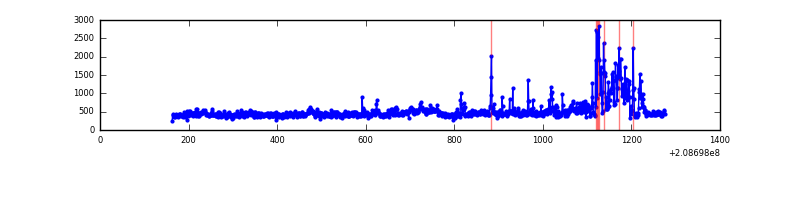 |
| C | 1113 | 1113 | 41 | 41 | 3.68% | 3.68% | 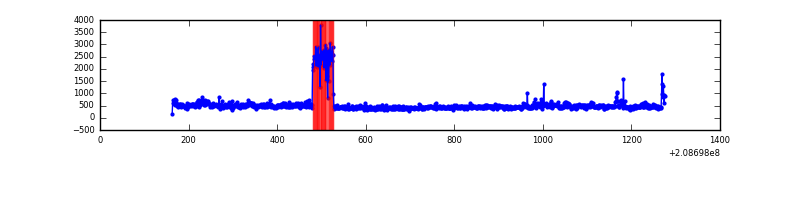 |
| D | 1113 | 1113 | 80 | 80 | 7.19% | 7.19% | 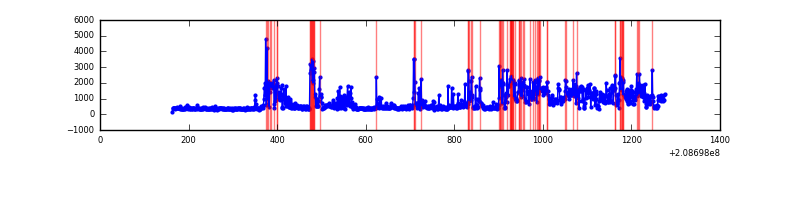 |
Top three noisy pixels from each quadrant. If the there are fewer than three noisy pixels in the level2.evt file, extra rows are filled as -1
| Pixel properties | Quadrant properties | ||||||
|---|---|---|---|---|---|---|---|
| Quadrant | DetID | PixID | Counts | Sigma | Mean | Median | Sigma |
| A | 0 | 118 | 22352 | 864.22 | 115 | 113 | 25.7 |
| A | 0 | 226 | 3285 | 123.27 | 115 | 113 | 25.7 |
| A | 13 | 251 | 1689 | 61.24 | 115 | 113 | 25.7 |
| B | 14 | 167 | 82046 | 3264.39 | 118 | 115 | 25.1 |
| B | 10 | 16 | 50171 | 1994.39 | 118 | 115 | 25.1 |
| B | 4 | 80 | 6415 | 251.01 | 118 | 115 | 25.1 |
| C | 14 | 48 | 191407 | 6813.35 | 111 | 112 | 28.1 |
| C | 8 | 208 | 2221 | 75.12 | 111 | 112 | 28.1 |
| C | 13 | 61 | 874 | 27.14 | 111 | 112 | 28.1 |
| D | 13 | 235 | 354650 | 12554.82 | 108 | 104 | 28.2 |
| D | 1 | 31 | 138409 | 4897.52 | 108 | 104 | 28.2 |
| D | 2 | 136 | 44897 | 1586.16 | 108 | 104 | 28.2 |
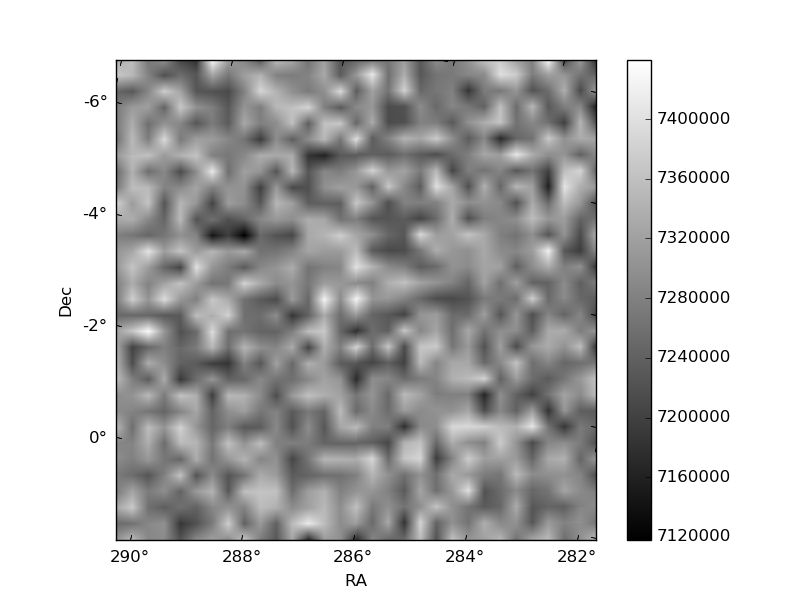
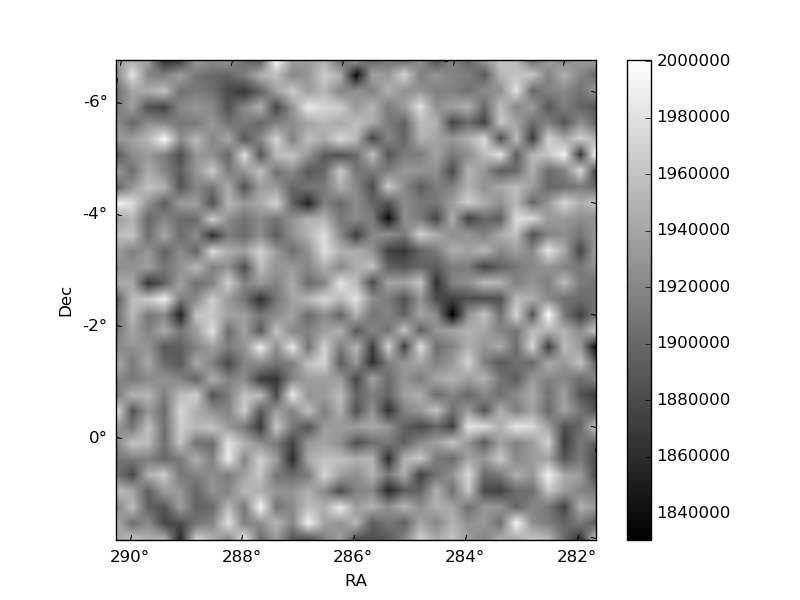
Histogram calculated using DETX and DETY for each event in the final _common_clean file
| Quadrant A | 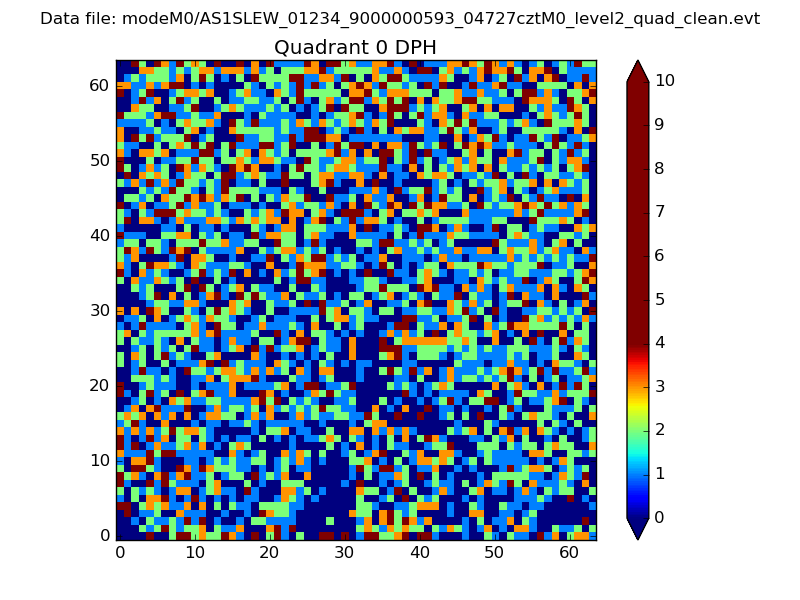 |
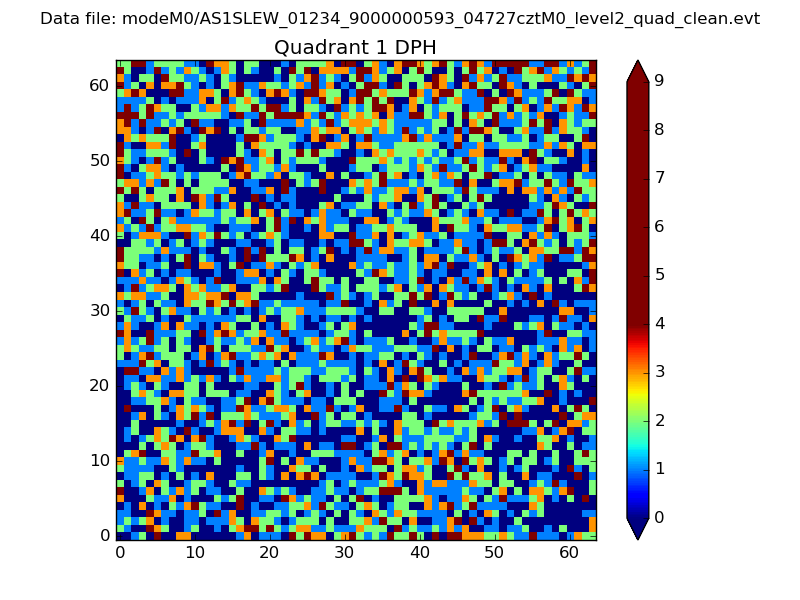 |
Quadrant B |
|---|---|---|---|
| Quadrant D | 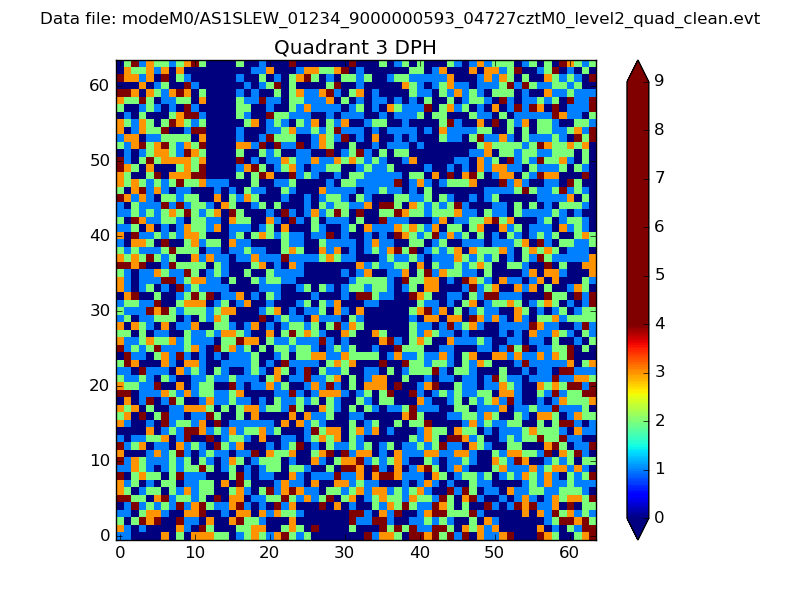 |
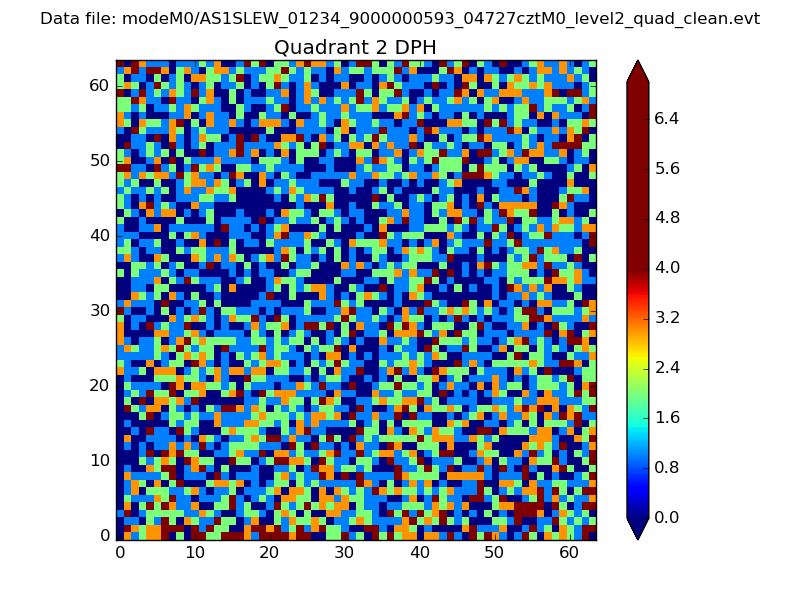 |
Quadrant C |
| Plot type | Count rate plots | Images |
|---|---|---|
| Comparison with Poisson distribution Blue bars denote a histogram of data divided into 1 sec bins. Red curve is a Poisson curve with rate = median count rate of data. |
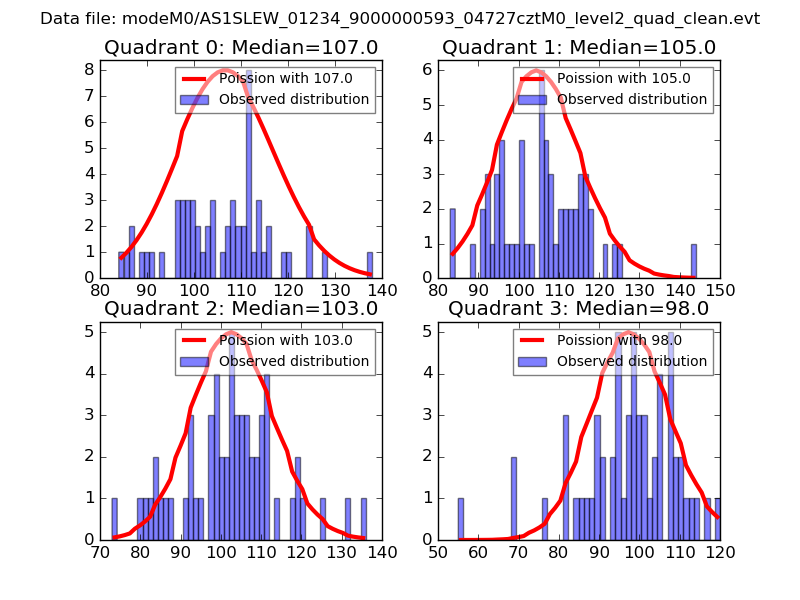 |
 |
| Quadrant-wise count rates Data is divided into 100 sec bins |
 |
|
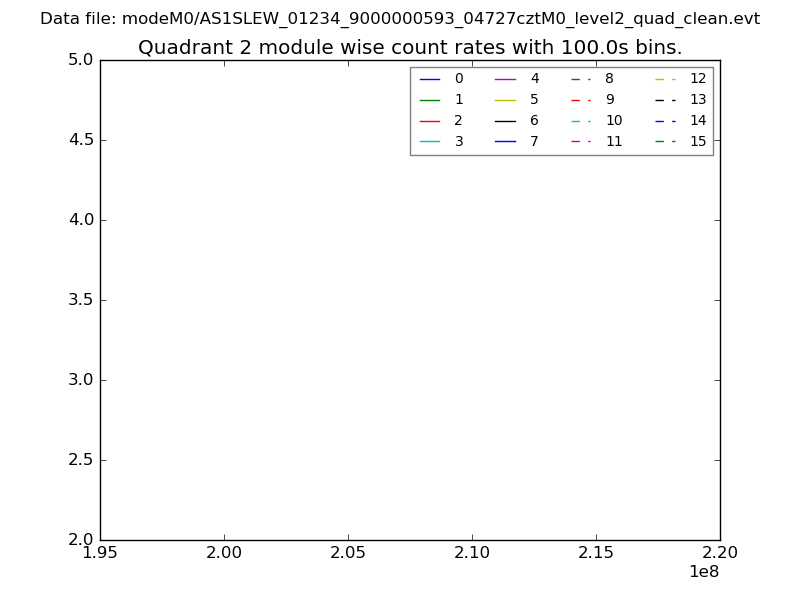
| Module-wise count rates for Quadrant A Data is divided into 100 sec bins |
 |
 |
| Module-wise count rates for Quadrant B Data is divided into 100 sec bins |
 |
 |
| Module-wise count rates for Quadrant C Data is divided into 100 sec bins |
 |
 |
| Module-wise count rates for Quadrant D Data is divided into 100 sec bins |
 |
 |
| Parameter | Plot |
|---|---|
| CZT HV Monitor | 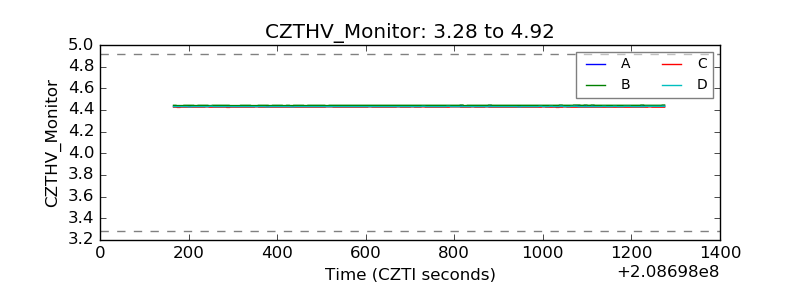 |
| D_VDD | 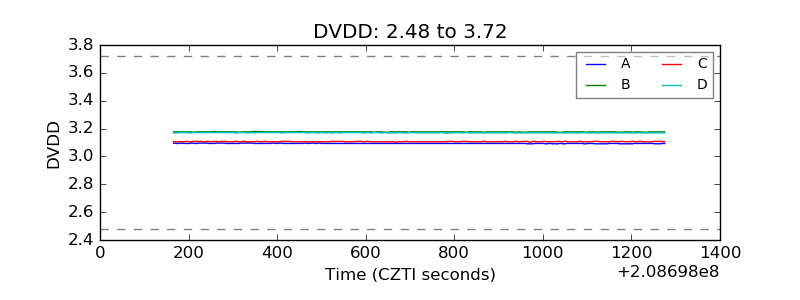 |
| Temperature 1 | 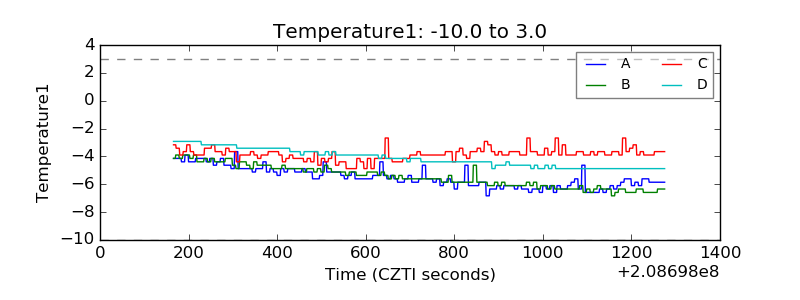 |
| Veto HV Monitor | 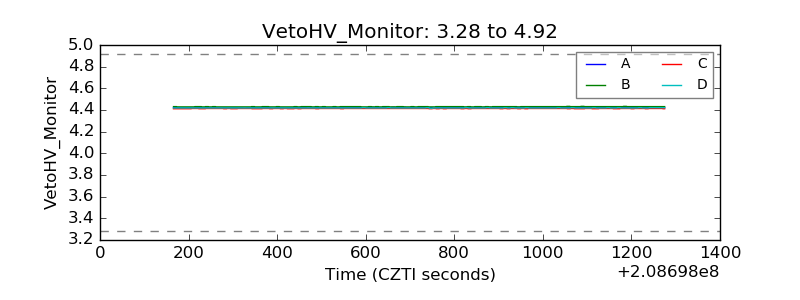 |
| Veto LLD | 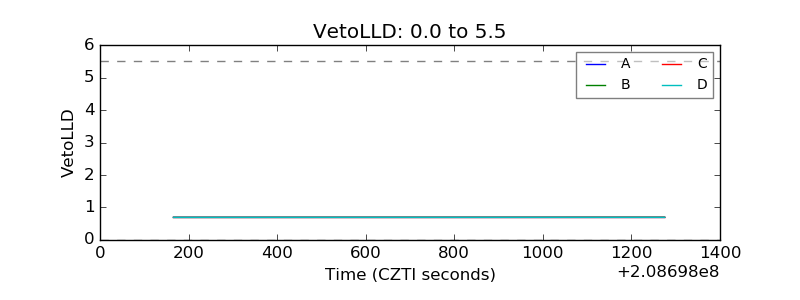 |
| Alpha Counter | 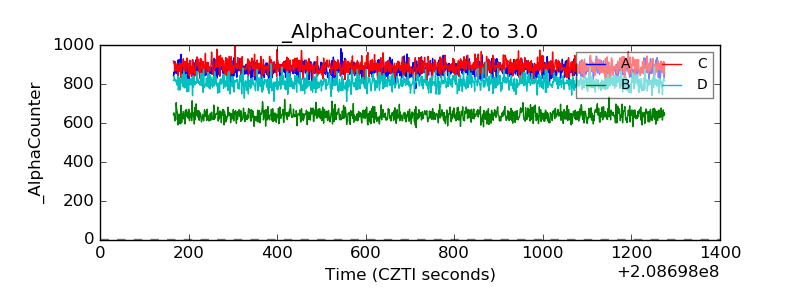 |
| _CPM_Rate | 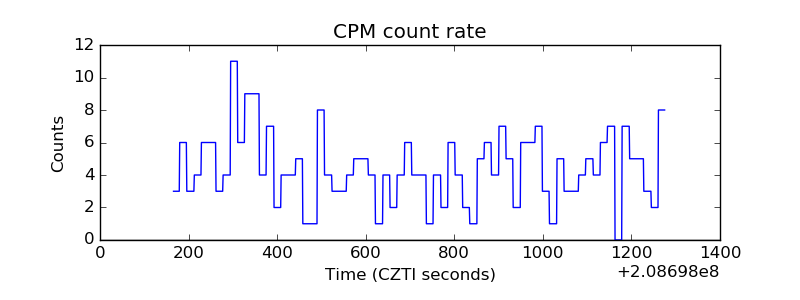 |
| CZT Counter | 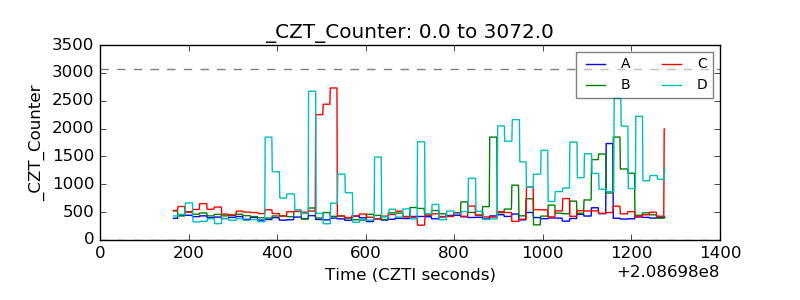 |
| +2.5 Volts monitor | 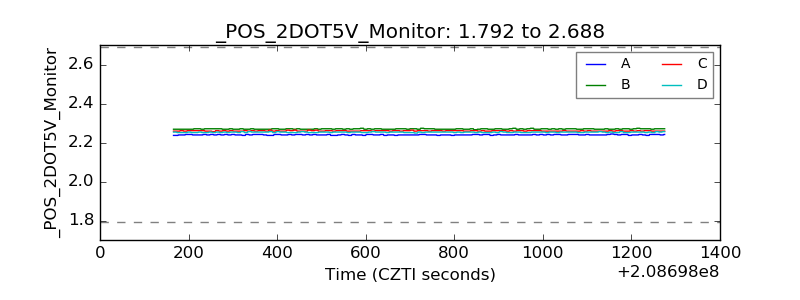 |
| +5 Volts monitor | 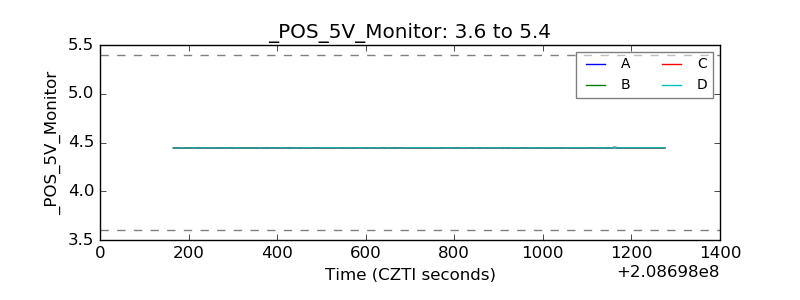 |
| _ROLL_ROT | 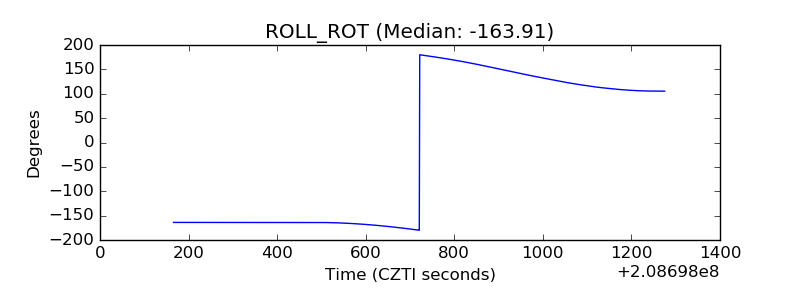 |
| _Roll_DEC | 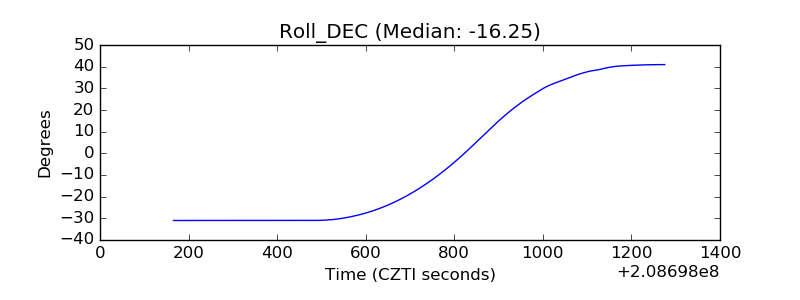 |
| _Roll_RA | 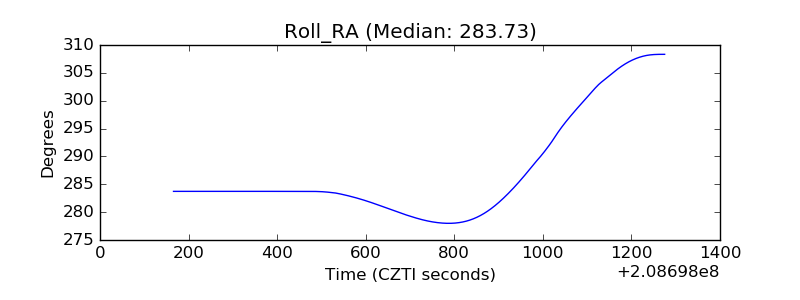 |
| Veto Counter | 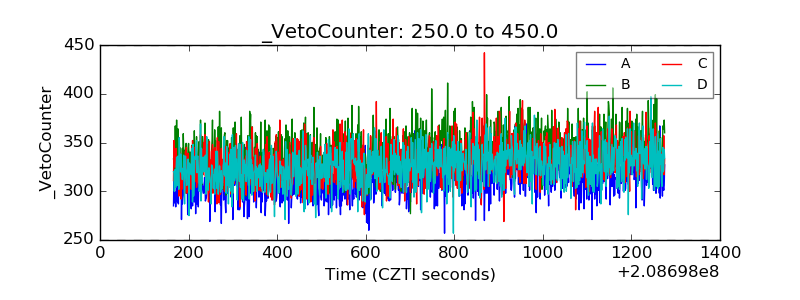 |