| Param | Original file | Final file |
|---|---|---|
| Filename | modeM0/AS1G05_195T01_9000000598cztM0_level2.fits | modeM0/AS1G05_195T01_9000000598cztM0_level2_quad_clean.evt |
| Size (bytes) | 617,728,320 | 630,748,800 |
| Size | 589.1 MB | 601.5 MB |
| Events in quadrant A | 3,682,342 | 3,731,060 |
| Events in quadrant B | 3,541,200 | 3,690,958 |
| Events in quadrant C | 3,635,614 | 3,641,577 |
| Events in quadrant D | 3,108,082 | 3,300,076 |
| Mode SS | |||
|---|---|---|---|
| Quadrant | BADHDUFLAG | Total packets | Discarded packets |
| A | 0 | 1410 | 0 |
| B | 0 | 1410 | 0 |
| C | 0 | 1408 | 0 |
| D | 0 | 1410 | 0 |
| Mode M9 | |||
|---|---|---|---|
| Quadrant | BADHDUFLAG | Total packets | Discarded packets |
| A | 0 | 106 | 0 |
| B | 0 | 106 | 0 |
| C | 0 | 106 | 0 |
| D | 0 | 106 | 0 |
| Mode M0 | |||
|---|---|---|---|
| Quadrant | BADHDUFLAG | Total packets | Discarded packets |
| A | 0 | 141856 | 0 |
| B | 0 | 155158 | 0 |
| C | 0 | 152540 | 0 |
| D | 0 | 167822 | 0 |
| Quadrant | Total seconds | Saturated seconds | Saturation percentage |
|---|---|---|---|
| A | 69099 | 758 | 1.096977% |
| B | 69087 | 1694 | 2.451981% |
| C | 69094 | 1451 | 2.100038% |
| D | 69076 | 2151 | 3.113961% |
Noise dominated data is calculated using 1-second bins in cleaned event files. If a bin has >2000 counts, and if more than 50% of those come from <1% of pixels, then it is considered to be noise-dominated and hence unusable.
| Quadrant | # 1 sec bins | Bins with >0 counts | Bins with >2000 counts | High rate bins dominated by noise | Noise dominated (total time) | Noise dominated (detector-on time) | Marked lightcurve |
|---|---|---|---|---|---|---|---|
| A | 79879 | 69127 | 0 | 0 | 0.00% | 0.00% |  |
| B | 79879 | 69104 | 0 | 0 | 0.00% | 0.00% |  |
| C | 79879 | 69128 | 0 | 0 | 0.00% | 0.00% |  |
| D | 79879 | 69059 | 0 | 0 | 0.00% | 0.00% |  |
Top three noisy pixels from each quadrant. If the there are fewer than three noisy pixels in the level2.evt file, extra rows are filled as -1
| Pixel properties | Quadrant properties | ||||||
|---|---|---|---|---|---|---|---|
| Quadrant | DetID | PixID | Counts | Sigma | Mean | Median | Sigma |
| A | 0 | 29 | 3726 | 11.44 | 956 | 889 | 248.0 |
| A | 14 | 188 | 3676 | 11.24 | 956 | 889 | 248.0 |
| A | 7 | 110 | 3160 | 9.16 | 956 | 889 | 248.0 |
| B | 2 | 9 | 3041 | 11.16 | 936 | 888 | 193.0 |
| B | 14 | 254 | 2564 | 8.68 | 936 | 888 | 193.0 |
| B | 12 | 226 | 2562 | 8.67 | 936 | 888 | 193.0 |
| C | 1 | 80 | 2711 | 7.15 | 958 | 883 | 255.6 |
| C | 1 | 81 | 2629 | 6.83 | 958 | 883 | 255.6 |
| C | 12 | 241 | 2513 | 6.38 | 958 | 883 | 255.6 |
| D | 11 | 82 | 2572 | 7.5 | 884 | 801 | 236.0 |
| D | 3 | 14 | 2362 | 6.61 | 884 | 801 | 236.0 |
| D | 4 | 160 | 2346 | 6.55 | 884 | 801 | 236.0 |
Histogram calculated using DETX and DETY for each event in the final _common_clean file
| Quadrant A |  |
 |
Quadrant B |
|---|---|---|---|
| Quadrant D |  |
 |
Quadrant C |
| Plot type | Count rate plots | Images |
|---|---|---|
| Comparison with Poisson distribution Blue bars denote a histogram of data divided into 1 sec bins. Red curve is a Poisson curve with rate = median count rate of data. |
 |
 |
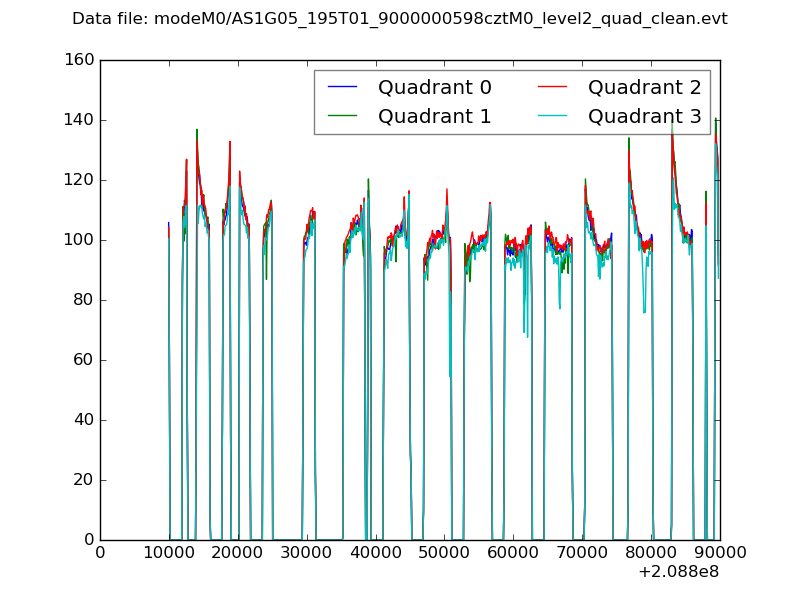
| Quadrant-wise count rates Data is divided into 100 sec bins |
 |
|
| Module-wise count rates for Quadrant A Data is divided into 100 sec bins |
 |
 |
| Module-wise count rates for Quadrant B Data is divided into 100 sec bins |
 |
 |
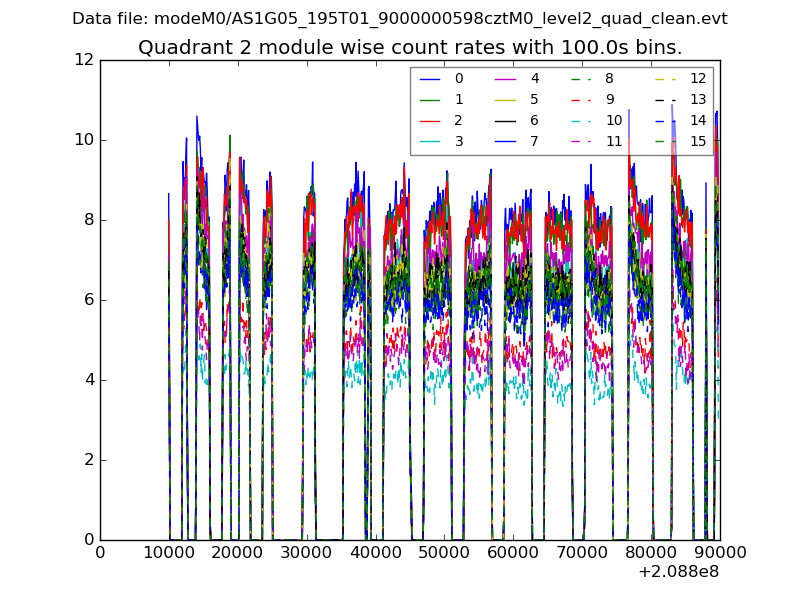
| Module-wise count rates for Quadrant C Data is divided into 100 sec bins |
 |
 |
| Module-wise count rates for Quadrant D Data is divided into 100 sec bins |
 |
 |
| Parameter | Plot |
|---|---|
| CZT HV Monitor |  |
| D_VDD |  |
| Temperature 1 | 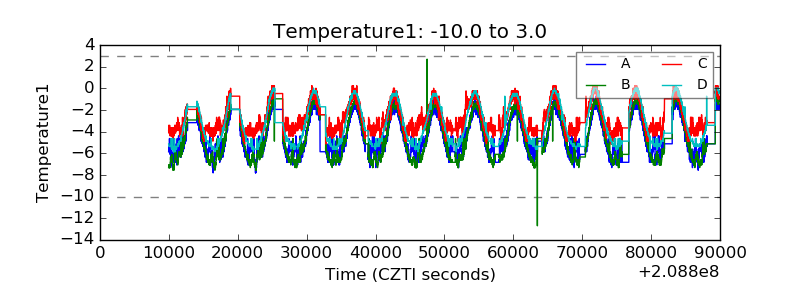 |
| Veto HV Monitor |  |
| Veto LLD |  |
| Alpha Counter |  |
| _CPM_Rate |  |
| CZT Counter |  |
| +2.5 Volts monitor |  |
| +5 Volts monitor |  |
| _ROLL_ROT |  |
| _Roll_DEC |  |
| _Roll_RA |  |
| Veto Counter |  |