| Param | Original file | Final file |
|---|---|---|
| Filename | modeM0/AS1G05_195T01_9000000598_04747cztM0_level2.evt | modeM0/AS1G05_195T01_9000000598_04747cztM0_level2_quad_clean.evt |
| Size (bytes) | 292,872,960 | 40,916,160 |
| Size | 279.3 MB | 39.0 MB |
| Events in quadrant A | 1,837,594 | 244,376 |
| Events in quadrant B | 2,144,846 | 244,020 |
| Events in quadrant C | 1,910,855 | 245,755 |
| Events in quadrant D | 2,705,561 | 224,502 |
| Mode SS | |||
|---|---|---|---|
| Quadrant | BADHDUFLAG | Total packets | Discarded packets |
| A | 0 | 82 | 0 |
| B | 0 | 82 | 0 |
| C | 0 | 82 | 0 |
| D | 0 | 82 | 0 |
| Mode M9 | |||
|---|---|---|---|
| Quadrant | BADHDUFLAG | Total packets | Discarded packets |
| A | 0 | 13 | 0 |
| B | 0 | 13 | 0 |
| C | 0 | 13 | 0 |
| D | 0 | 13 | 0 |
| Mode M0 | |||
|---|---|---|---|
| Quadrant | BADHDUFLAG | Total packets | Discarded packets |
| A | 0 | 8167 | 2 |
| B | 0 | 9039 | 1 |
| C | 0 | 8339 | 1 |
| D | 0 | 10856 | 1 |
| Quadrant | Total seconds | Saturated seconds | Saturation percentage |
|---|---|---|---|
| A | 3961 | 14 | 0.353446% |
| B | 3961 | 102 | 2.575107% |
| C | 3961 | 17 | 0.429185% |
| D | 3961 | 306 | 7.725322% |
Noise dominated data is calculated using 1-second bins in cleaned event files. If a bin has >2000 counts, and if more than 50% of those come from <1% of pixels, then it is considered to be noise-dominated and hence unusable.
| Quadrant | # 1 sec bins | Bins with >0 counts | Bins with >2000 counts | High rate bins dominated by noise | Noise dominated (total time) | Noise dominated (detector-on time) | Marked lightcurve |
|---|---|---|---|---|---|---|---|
| A | 5296 | 3962 | 0 | 0 | 0.00% | 0.00% | 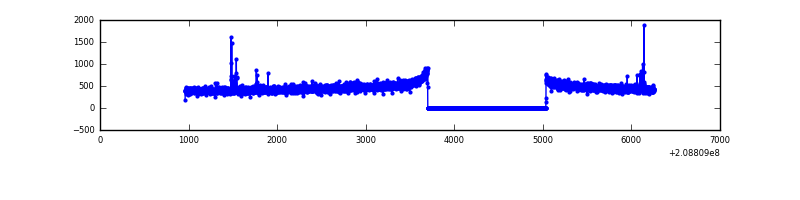 |
| B | 5296 | 3962 | 50 | 50 | 0.94% | 1.26% | 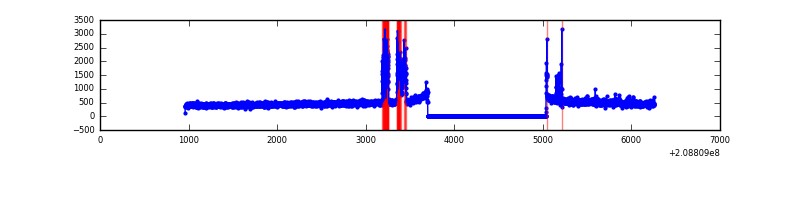 |
| C | 5296 | 3962 | 14 | 14 | 0.26% | 0.35% |  |
| D | 5296 | 3962 | 248 | 248 | 4.68% | 6.26% | 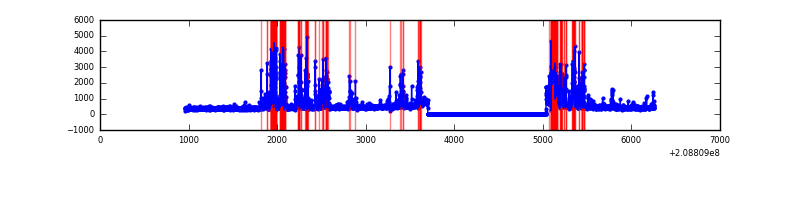 |
Top three noisy pixels from each quadrant. If the there are fewer than three noisy pixels in the level2.evt file, extra rows are filled as -1
| Pixel properties | Quadrant properties | ||||||
|---|---|---|---|---|---|---|---|
| Quadrant | DetID | PixID | Counts | Sigma | Mean | Median | Sigma |
| A | 10 | 17 | 8561 | 81.85 | 472 | 462 | 98.9 |
| A | 7 | 16 | 6442 | 60.44 | 472 | 462 | 98.9 |
| A | 0 | 226 | 4970 | 45.56 | 472 | 462 | 98.9 |
| B | 14 | 167 | 229715 | 2473.86 | 478 | 465 | 92.7 |
| B | 15 | 204 | 25742 | 272.77 | 478 | 465 | 92.7 |
| B | 5 | 200 | 16815 | 176.43 | 478 | 465 | 92.7 |
| C | 14 | 48 | 77076 | 711.91 | 461 | 462 | 107.6 |
| C | 8 | 128 | 11115 | 98.99 | 461 | 462 | 107.6 |
| C | 8 | 208 | 10346 | 91.84 | 461 | 462 | 107.6 |
| D | 13 | 239 | 509080 | 4830.76 | 435 | 422 | 105.3 |
| D | 1 | 31 | 264228 | 2505.38 | 435 | 422 | 105.3 |
| D | 12 | 217 | 133395 | 1262.85 | 435 | 422 | 105.3 |
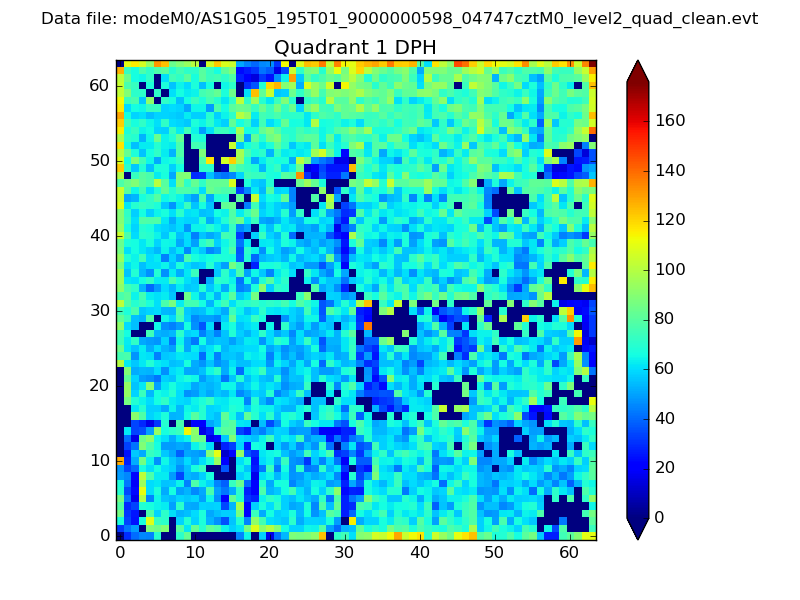
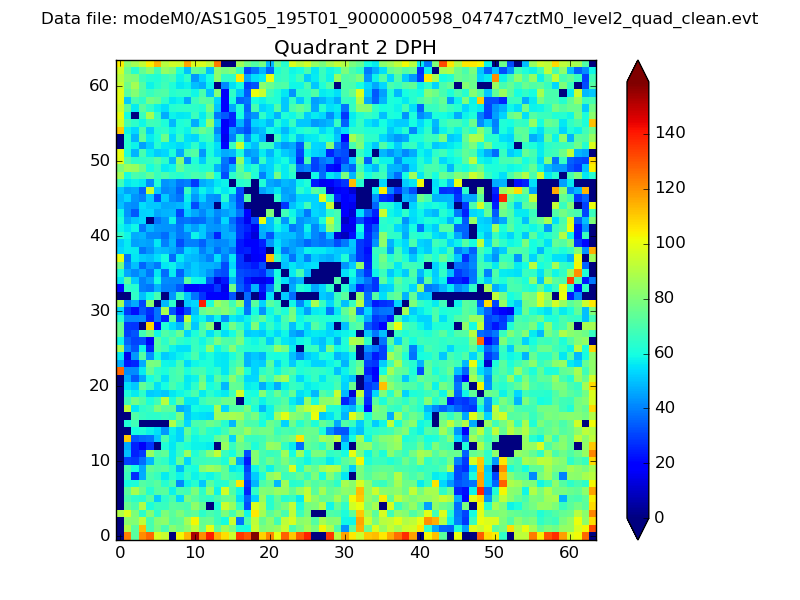
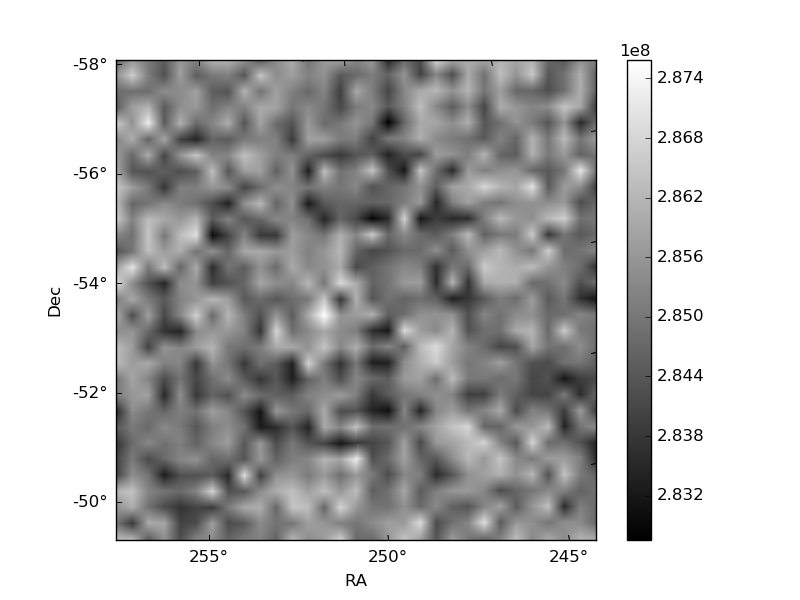
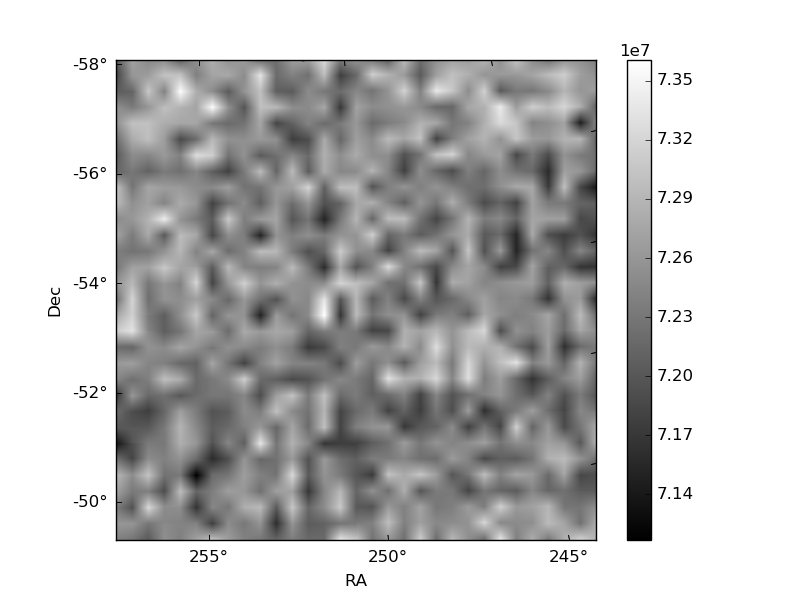
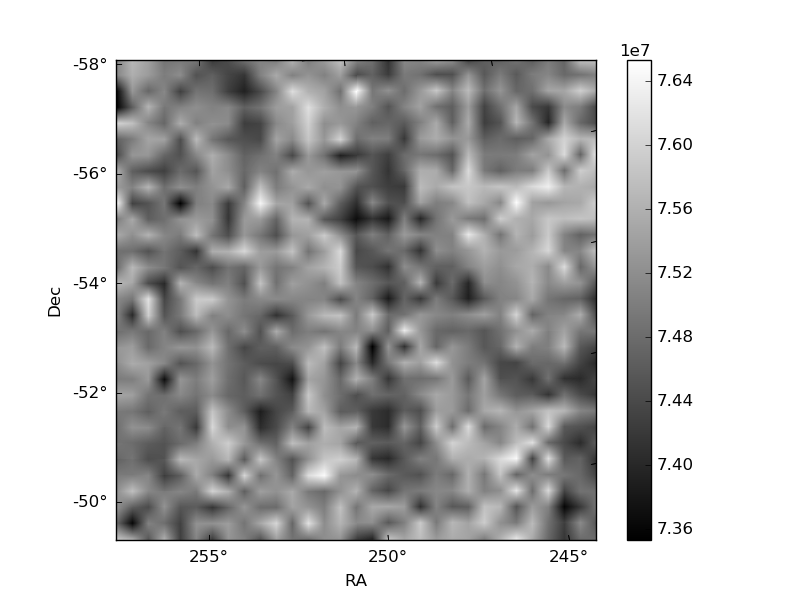
Histogram calculated using DETX and DETY for each event in the final _common_clean file
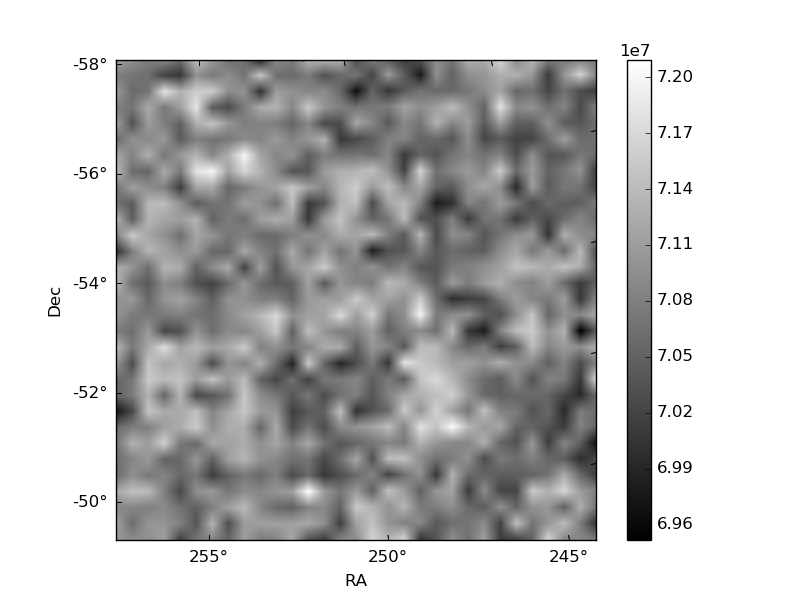
| Quadrant A | 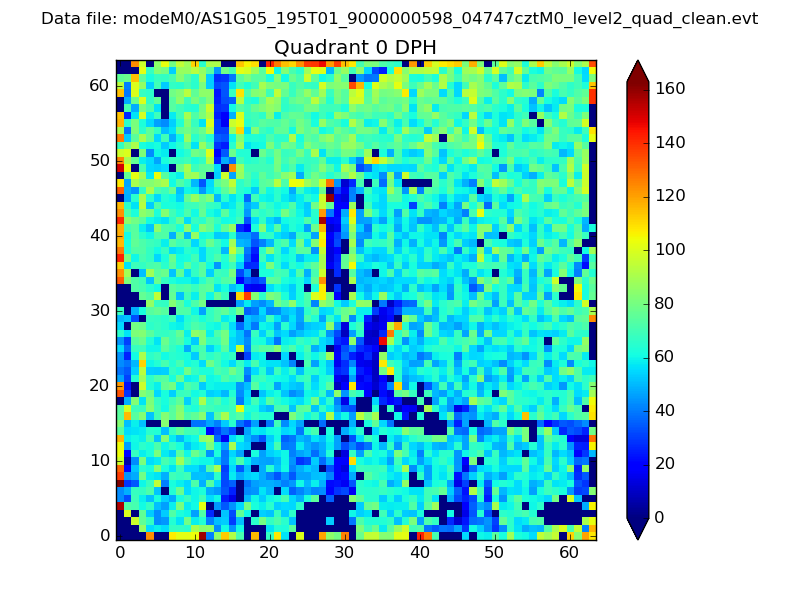 |
 |
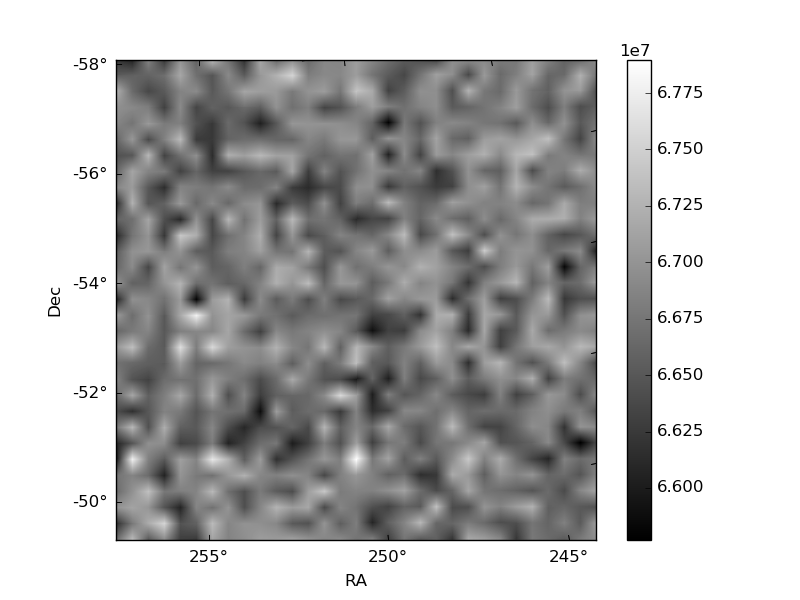
Quadrant B |
|---|---|---|---|
| Quadrant D | 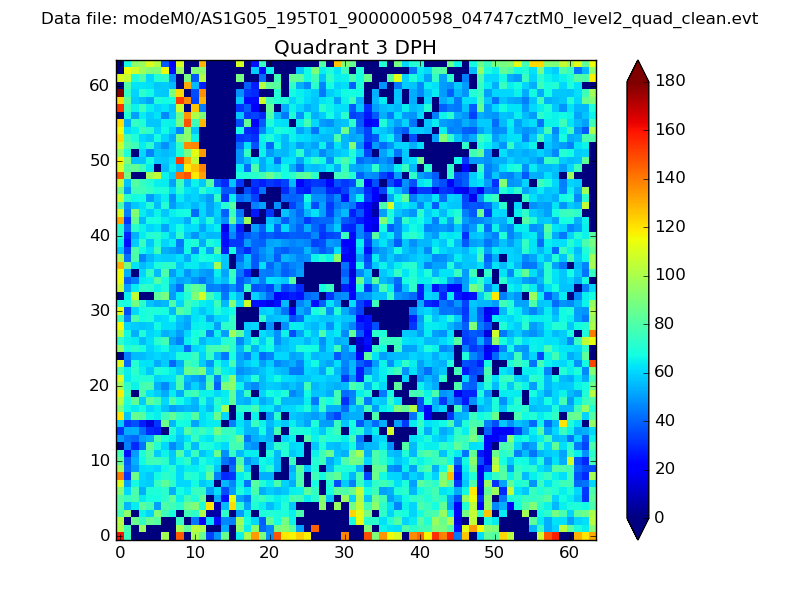 |
 |
Quadrant C |
| Plot type | Count rate plots | Images |
|---|---|---|
| Comparison with Poisson distribution Blue bars denote a histogram of data divided into 1 sec bins. Red curve is a Poisson curve with rate = median count rate of data. |
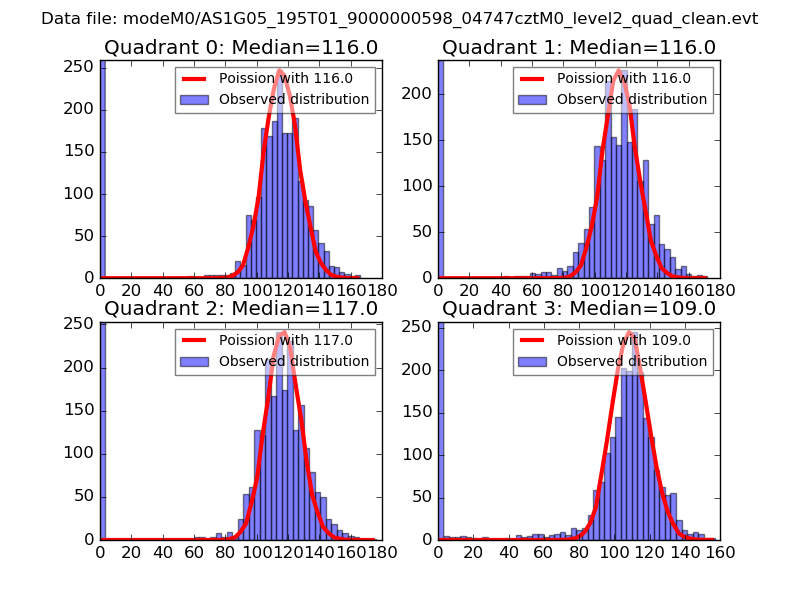 |
 |
| Quadrant-wise count rates Data is divided into 100 sec bins |
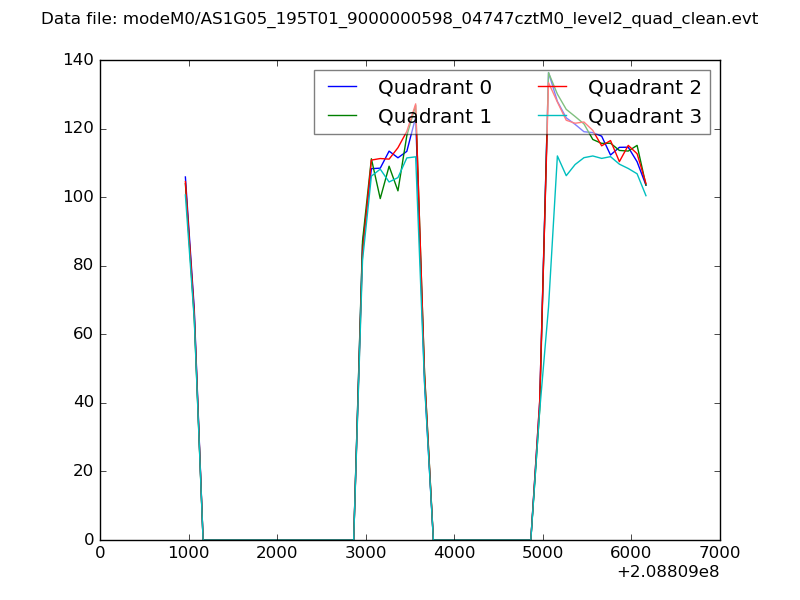 |
|
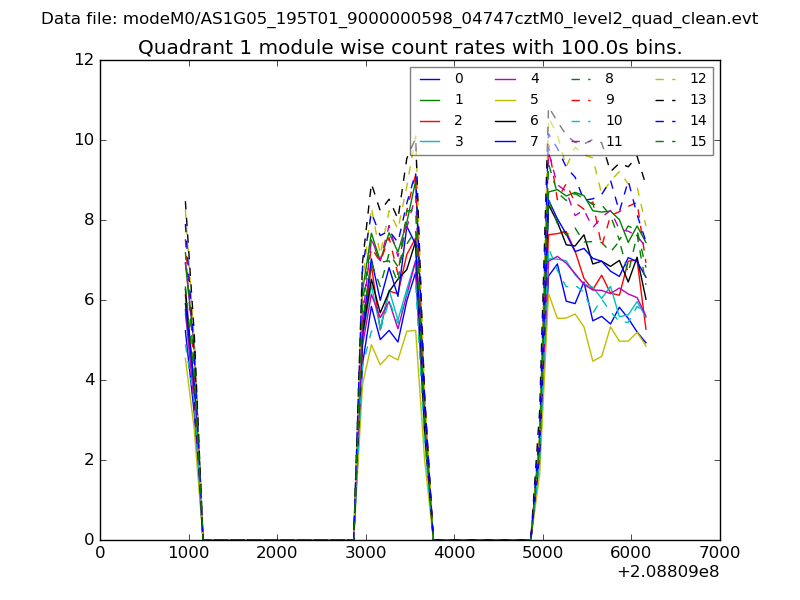
| Module-wise count rates for Quadrant A Data is divided into 100 sec bins |
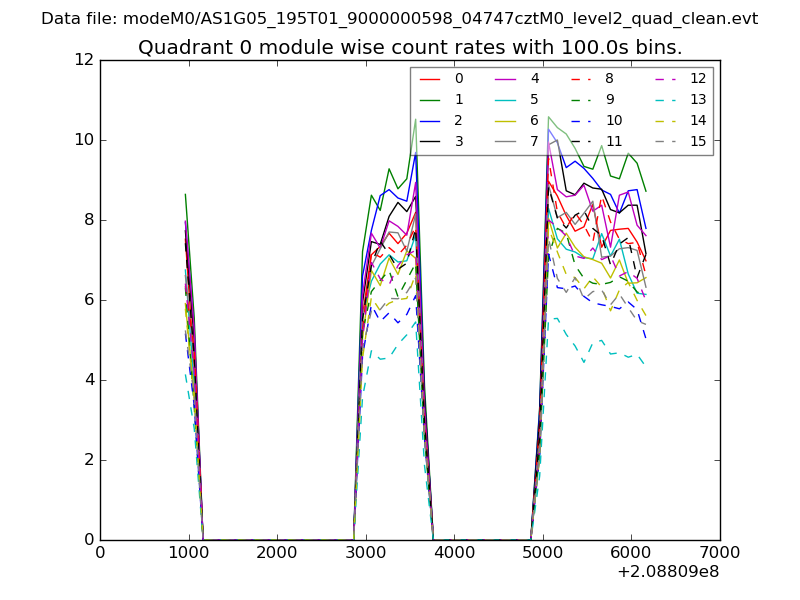 |
 |
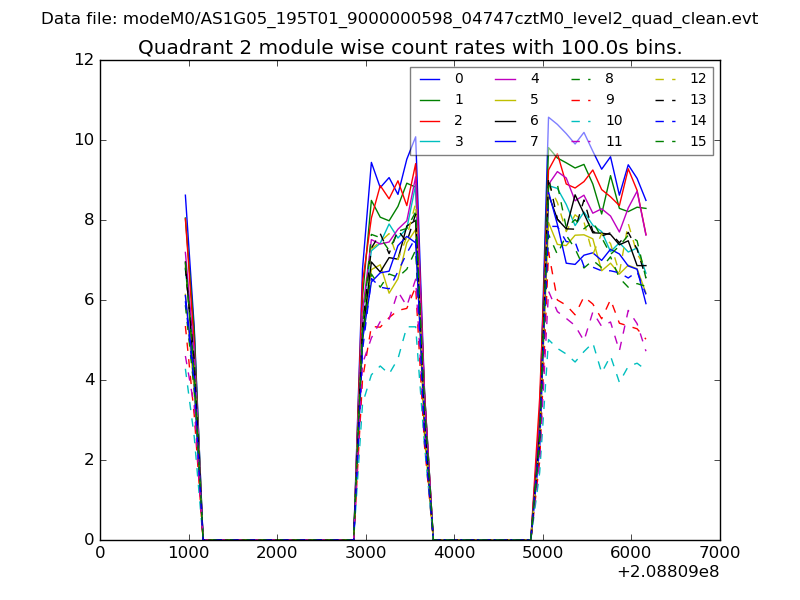
| Module-wise count rates for Quadrant B Data is divided into 100 sec bins |
 |
 |
| Module-wise count rates for Quadrant C Data is divided into 100 sec bins |
 |
 |
| Module-wise count rates for Quadrant D Data is divided into 100 sec bins |
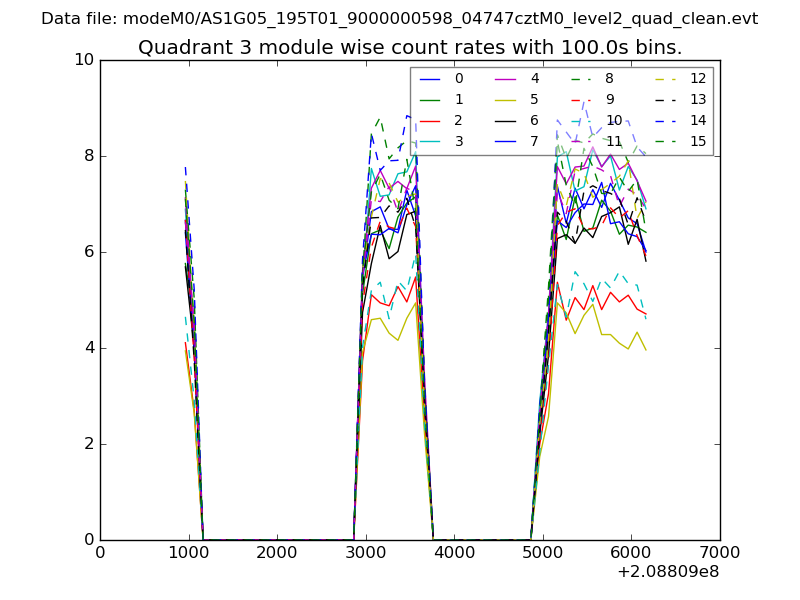 |
 |
| Parameter | Plot |
|---|---|
| CZT HV Monitor | 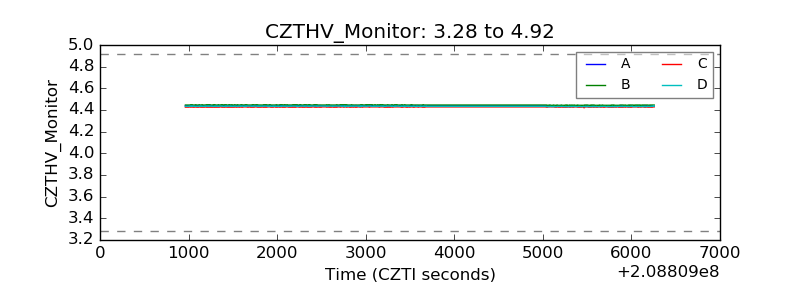 |
| D_VDD | 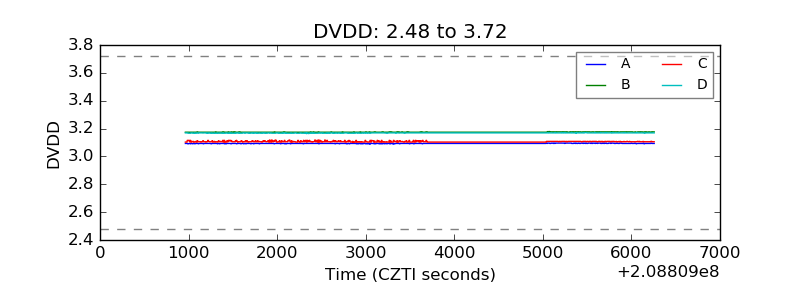 |
| Temperature 1 | 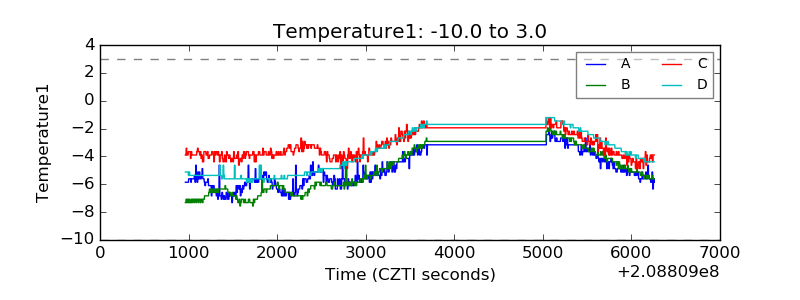 |
| Veto HV Monitor | 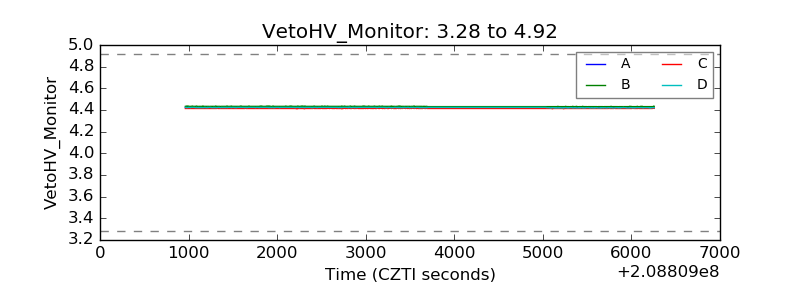 |
| Veto LLD | 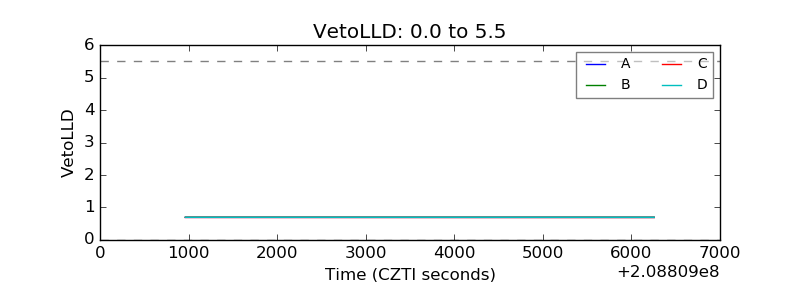 |
| Alpha Counter | 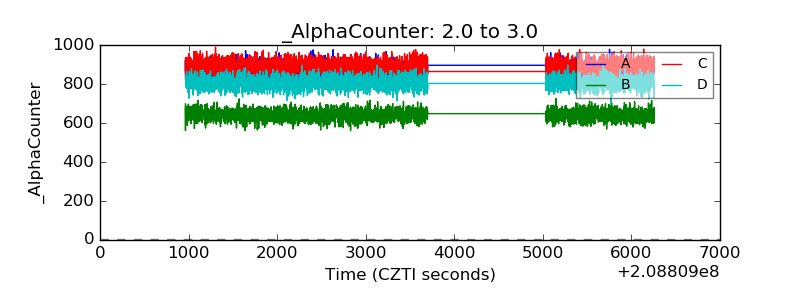 |
| _CPM_Rate | 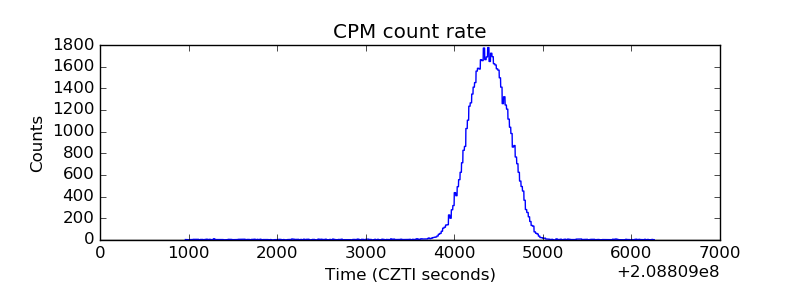 |
| CZT Counter | 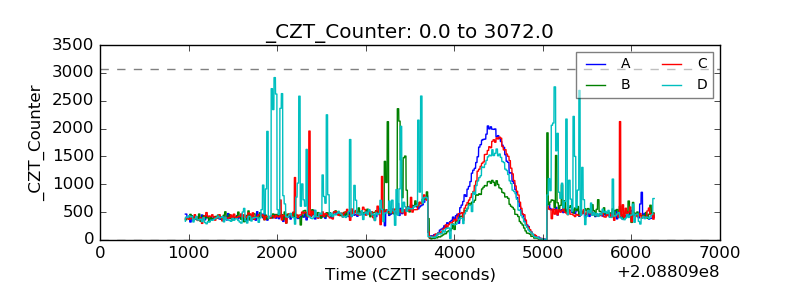 |
| +2.5 Volts monitor |  |
| +5 Volts monitor |  |
| _ROLL_ROT | 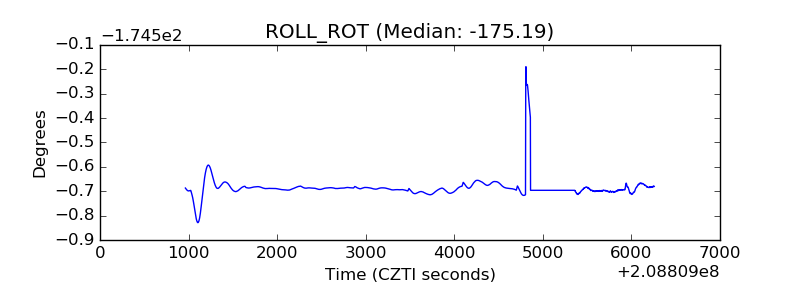 |
| _Roll_DEC | 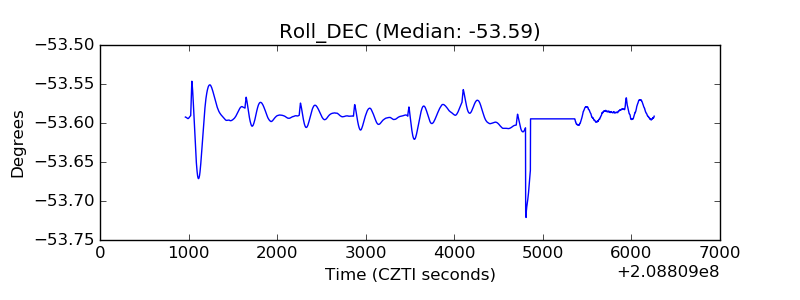 |
| _Roll_RA | 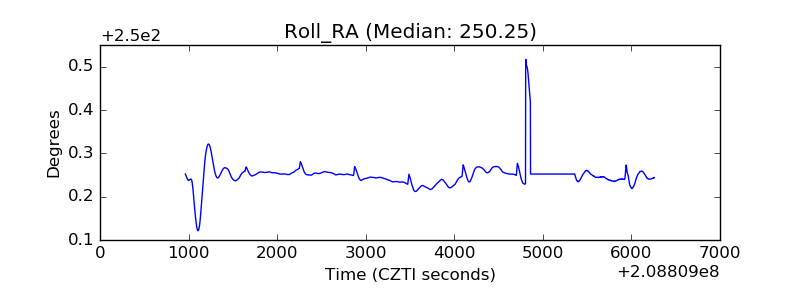 |
| Veto Counter | 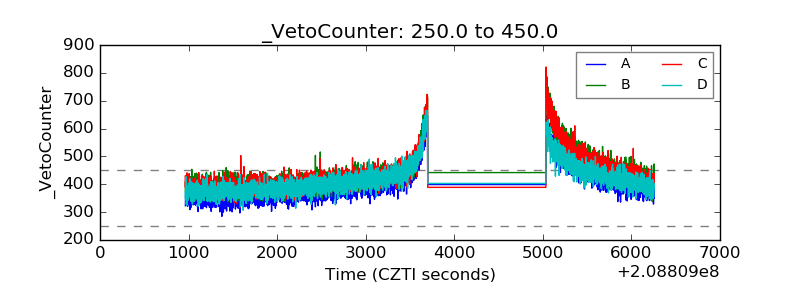 |