| Param | Original file | Final file |
|---|---|---|
| Filename | modeM0/AS1G05_195T01_9000000598_04748cztM0_level2.evt | modeM0/AS1G05_195T01_9000000598_04748cztM0_level2_quad_clean.evt |
| Size (bytes) | 419,595,840 | 79,868,160 |
| Size | 400.2 MB | 76.2 MB |
| Events in quadrant A | 2,851,493 | 499,156 |
| Events in quadrant B | 3,142,617 | 504,564 |
| Events in quadrant C | 2,978,463 | 505,305 |
| Events in quadrant D | 3,307,747 | 471,303 |
| Mode SS | |||
|---|---|---|---|
| Quadrant | BADHDUFLAG | Total packets | Discarded packets |
| A | 0 | 126 | 0 |
| B | 0 | 126 | 0 |
| C | 0 | 126 | 0 |
| D | 0 | 126 | 0 |
| Mode M9 | |||
|---|---|---|---|
| Quadrant | BADHDUFLAG | Total packets | Discarded packets |
| A | 0 | 18 | 0 |
| B | 0 | 18 | 0 |
| C | 0 | 18 | 0 |
| D | 0 | 19 | 0 |
| Mode M0 | |||
|---|---|---|---|
| Quadrant | BADHDUFLAG | Total packets | Discarded packets |
| A | 0 | 12937 | 3 |
| B | 0 | 13575 | 2 |
| C | 0 | 13300 | 2 |
| D | 0 | 14486 | 2 |
| Quadrant | Total seconds | Saturated seconds | Saturation percentage |
|---|---|---|---|
| A | 6283 | 26 | 0.413815% |
| B | 6283 | 66 | 1.050454% |
| C | 6283 | 21 | 0.334235% |
| D | 6283 | 163 | 2.594302% |
Noise dominated data is calculated using 1-second bins in cleaned event files. If a bin has >2000 counts, and if more than 50% of those come from <1% of pixels, then it is considered to be noise-dominated and hence unusable.
| Quadrant | # 1 sec bins | Bins with >0 counts | Bins with >2000 counts | High rate bins dominated by noise | Noise dominated (total time) | Noise dominated (detector-on time) | Marked lightcurve |
|---|---|---|---|---|---|---|---|
| A | 7563 | 6284 | 0 | 0 | 0.00% | 0.00% | 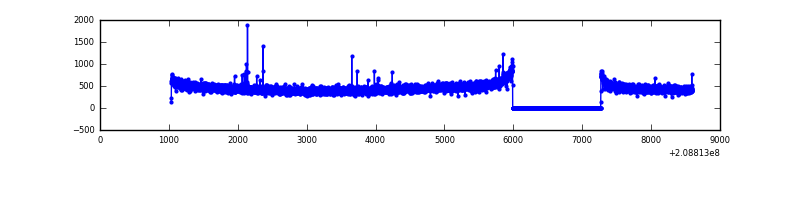 |
| B | 7563 | 6284 | 19 | 19 | 0.25% | 0.30% | 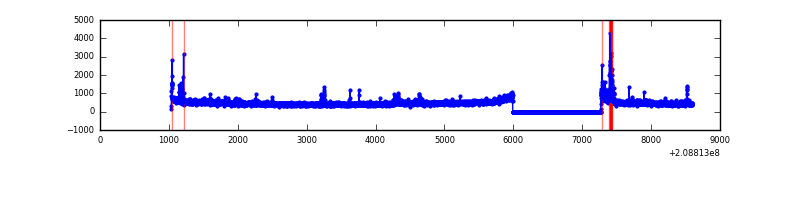 |
| C | 7563 | 6284 | 9 | 9 | 0.12% | 0.14% | 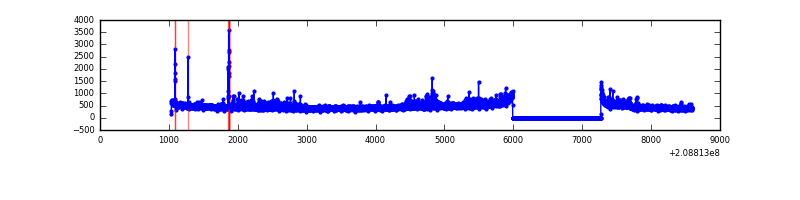 |
| D | 7563 | 6284 | 128 | 128 | 1.69% | 2.04% | 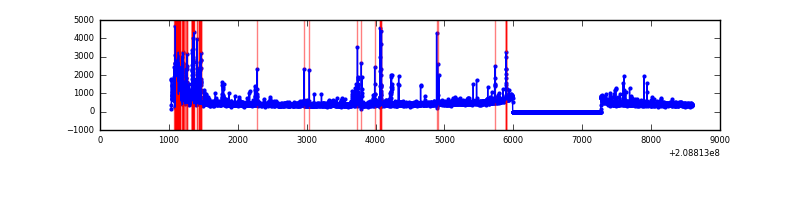 |
Top three noisy pixels from each quadrant. If the there are fewer than three noisy pixels in the level2.evt file, extra rows are filled as -1
| Pixel properties | Quadrant properties | ||||||
|---|---|---|---|---|---|---|---|
| Quadrant | DetID | PixID | Counts | Sigma | Mean | Median | Sigma |
| A | 0 | 226 | 7722 | 46.35 | 735 | 719 | 151.1 |
| A | 12 | 194 | 7455 | 44.58 | 735 | 719 | 151.1 |
| A | 15 | 174 | 4539 | 25.28 | 735 | 719 | 151.1 |
| B | 14 | 167 | 130969 | 914.78 | 747 | 731 | 142.4 |
| B | 15 | 204 | 30392 | 208.34 | 747 | 731 | 142.4 |
| B | 10 | 16 | 27822 | 190.28 | 747 | 731 | 142.4 |
| C | 14 | 48 | 170226 | 1024.44 | 713 | 718 | 165.5 |
| C | 12 | 4 | 16509 | 95.43 | 713 | 718 | 165.5 |
| C | 8 | 208 | 7525 | 41.14 | 713 | 718 | 165.5 |
| D | 1 | 31 | 232047 | 1397.24 | 693 | 672 | 165.6 |
| D | 12 | 217 | 145148 | 872.47 | 693 | 672 | 165.6 |
| D | 13 | 239 | 81041 | 485.34 | 693 | 672 | 165.6 |
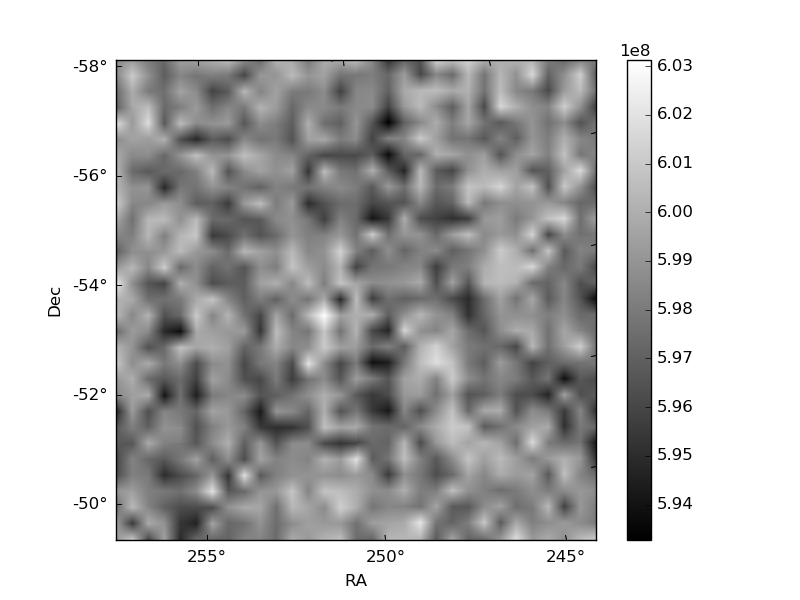
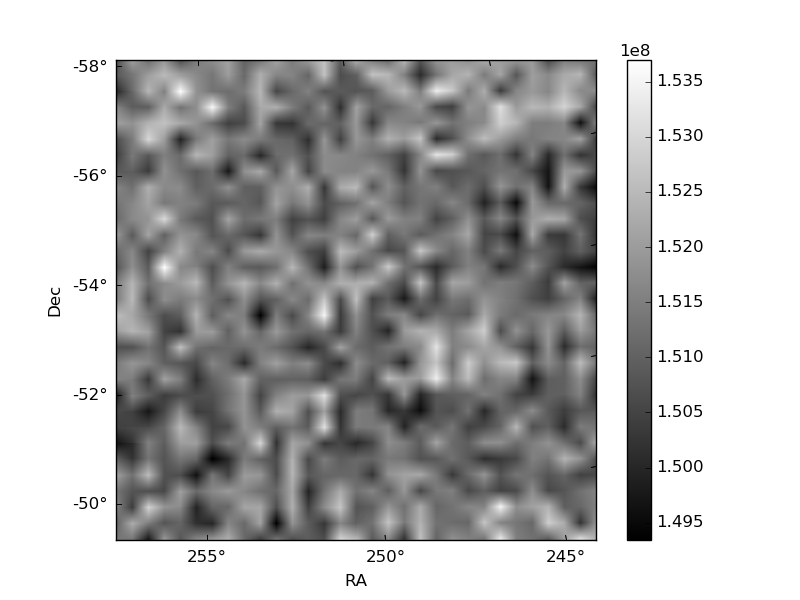
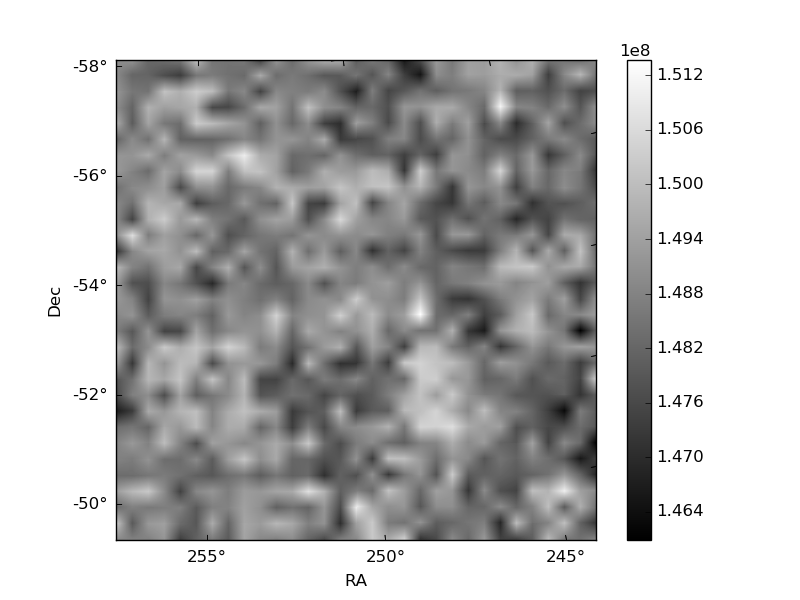
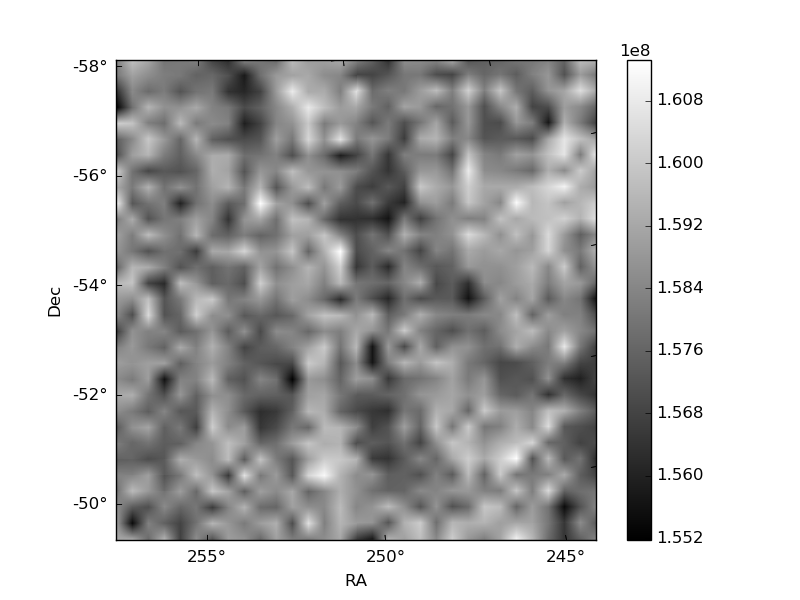
Histogram calculated using DETX and DETY for each event in the final _common_clean file
| Quadrant A | 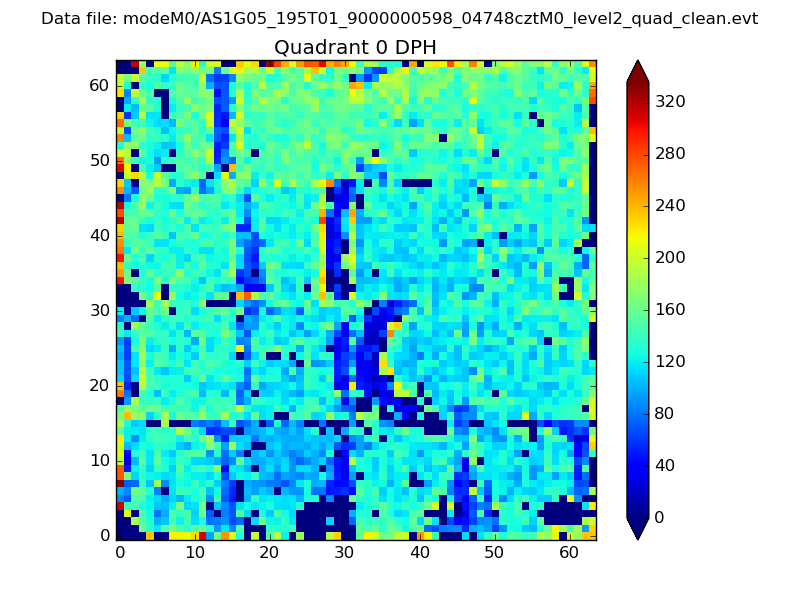 |
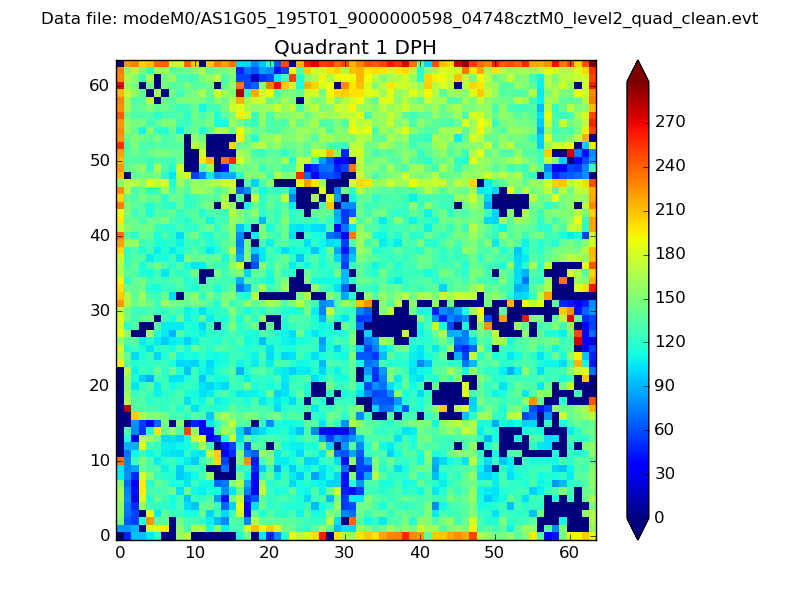 |
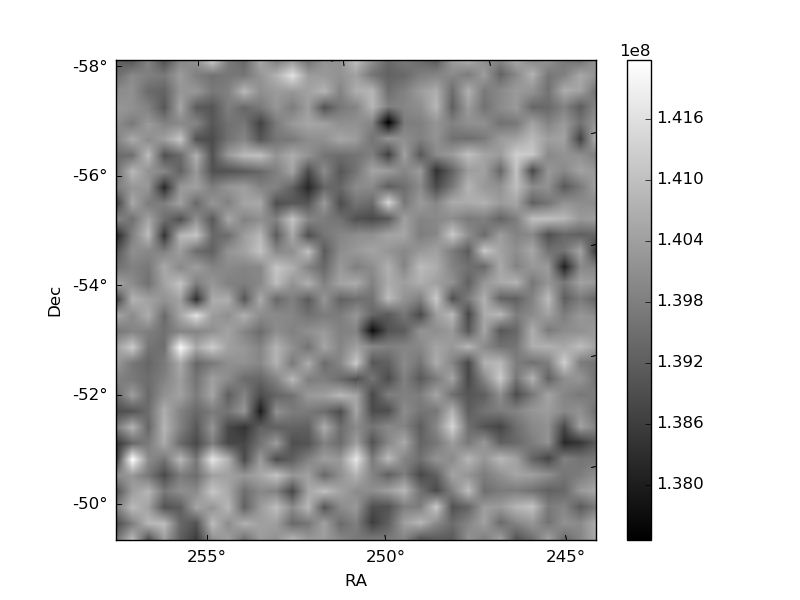
Quadrant B |
|---|---|---|---|
| Quadrant D | 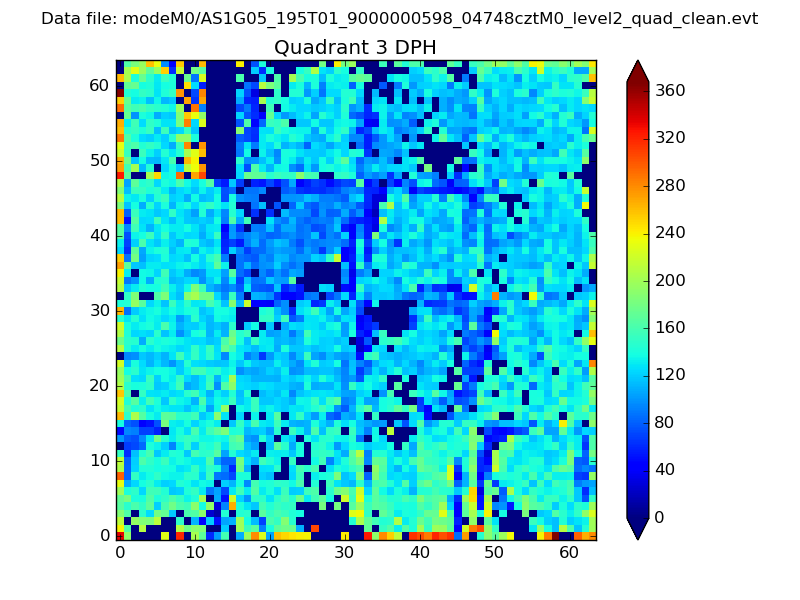 |
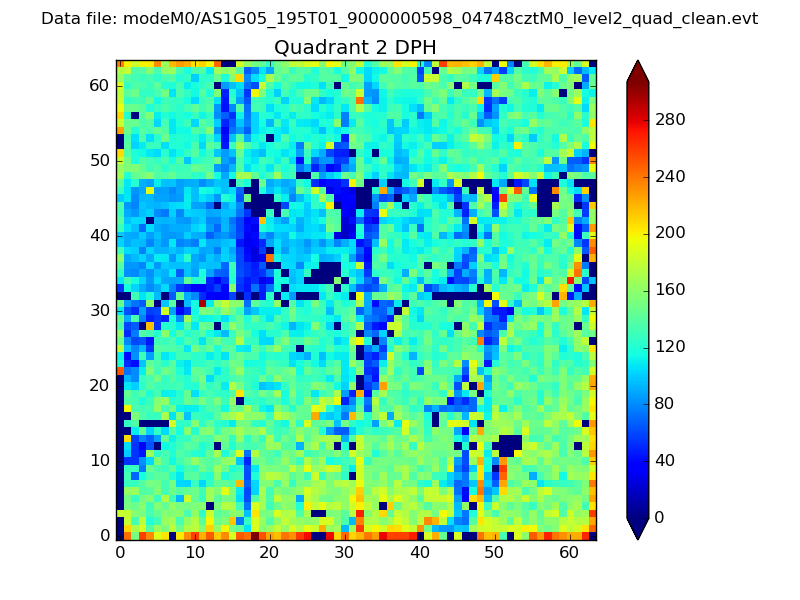 |
Quadrant C |
| Plot type | Count rate plots | Images |
|---|---|---|
| Comparison with Poisson distribution Blue bars denote a histogram of data divided into 1 sec bins. Red curve is a Poisson curve with rate = median count rate of data. |
 |
 |
| Quadrant-wise count rates Data is divided into 100 sec bins |
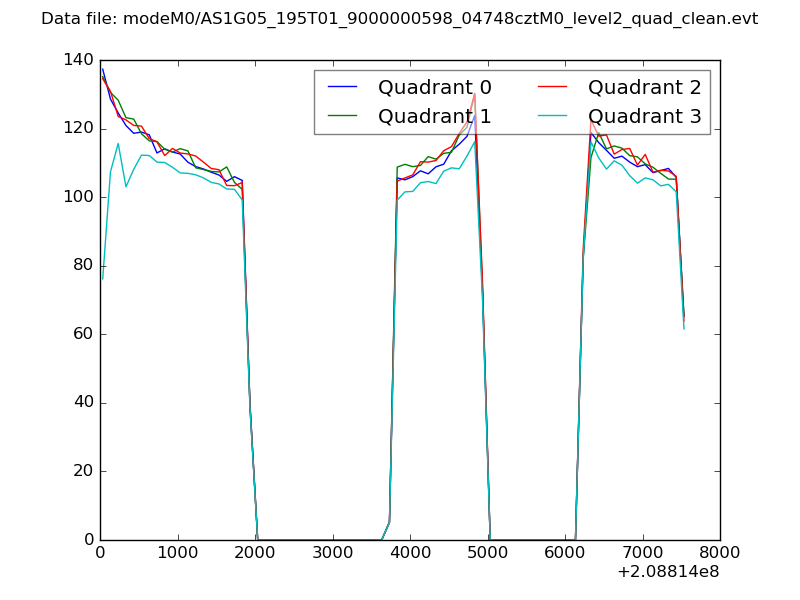 |
|
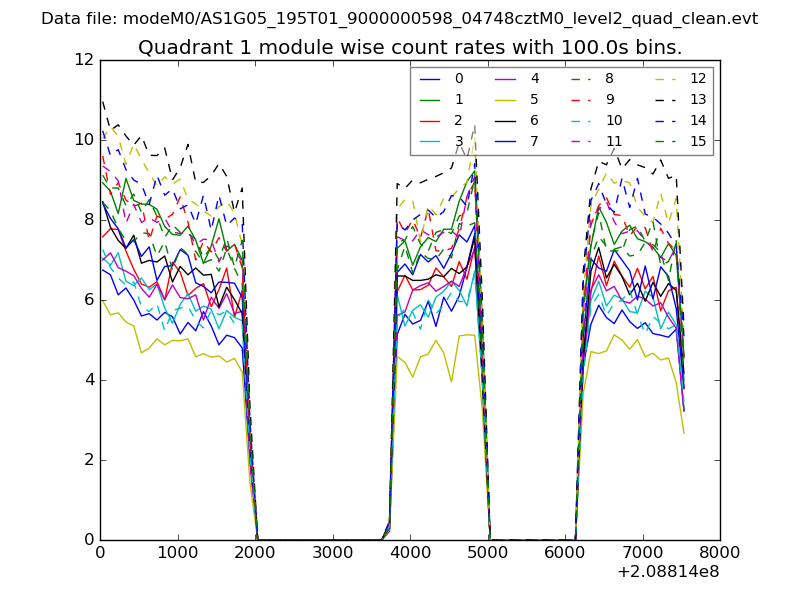
| Module-wise count rates for Quadrant A Data is divided into 100 sec bins |
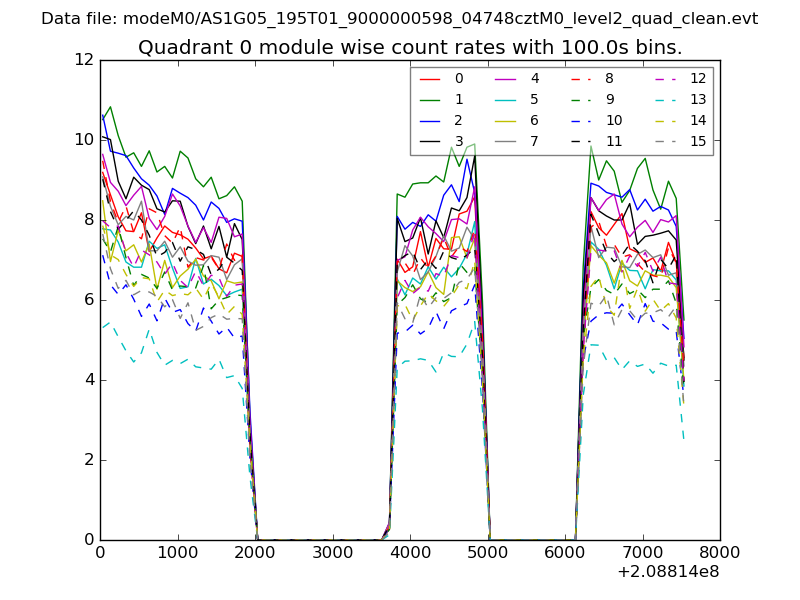 |
 |
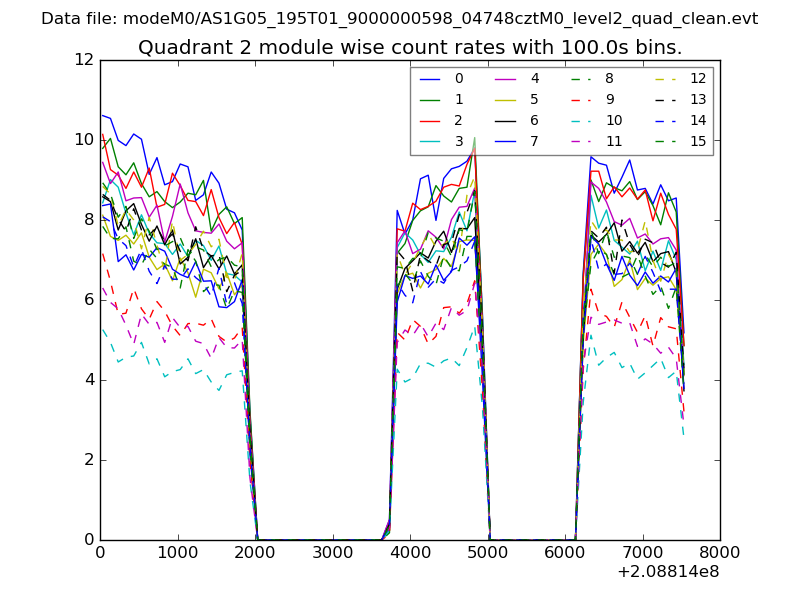
| Module-wise count rates for Quadrant B Data is divided into 100 sec bins |
 |
 |
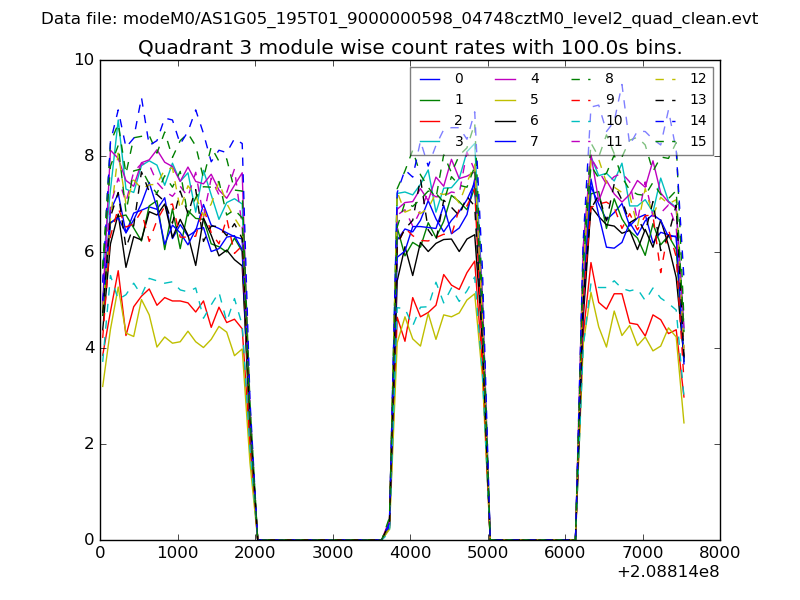
| Module-wise count rates for Quadrant C Data is divided into 100 sec bins |
 |
 |
| Module-wise count rates for Quadrant D Data is divided into 100 sec bins |
 |
 |
| Parameter | Plot |
|---|---|
| CZT HV Monitor | 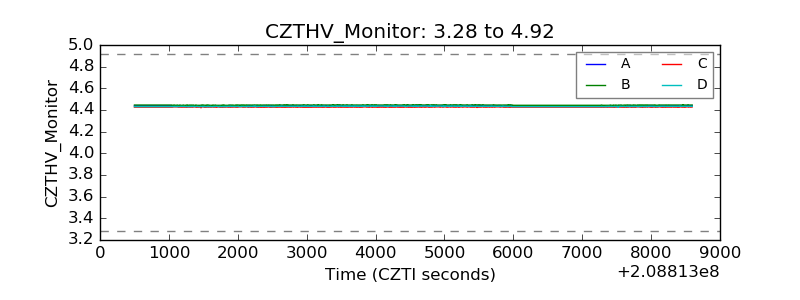 |
| D_VDD | 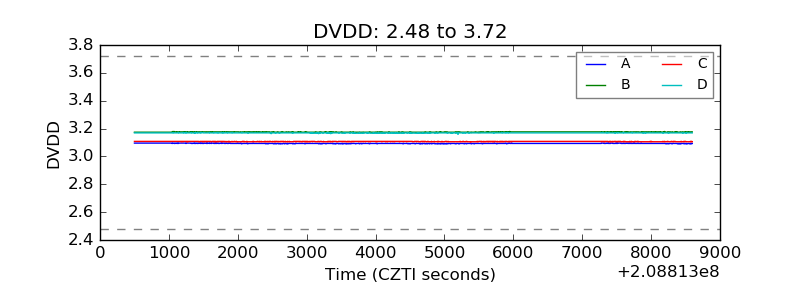 |
| Temperature 1 | 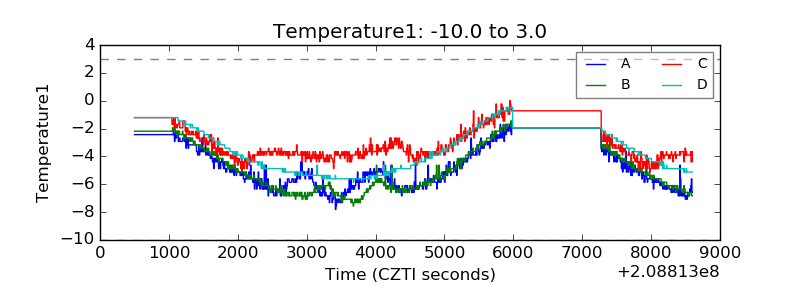 |
| Veto HV Monitor | 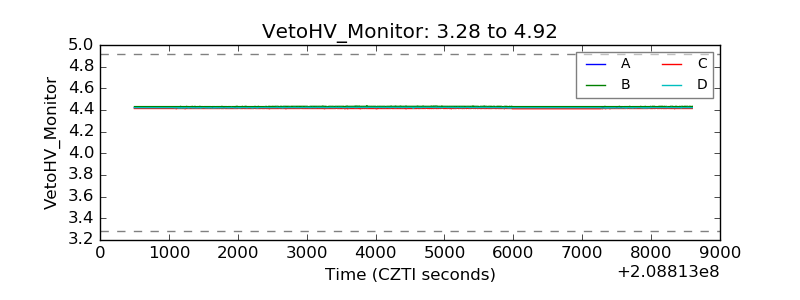 |
| Veto LLD | 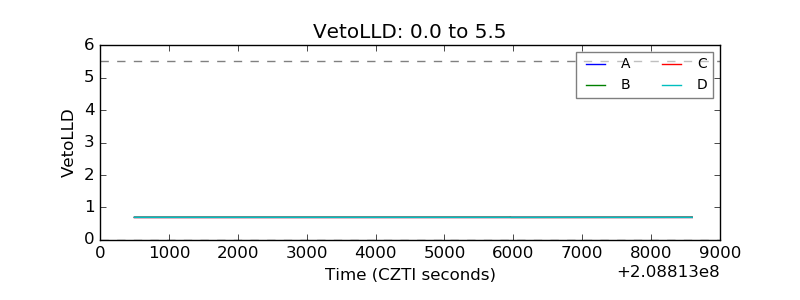 |
| Alpha Counter | 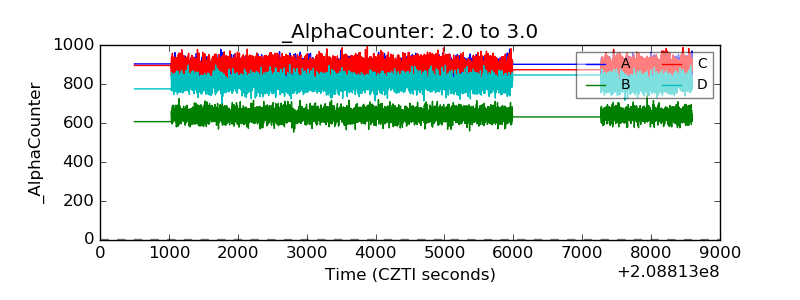 |
| _CPM_Rate | 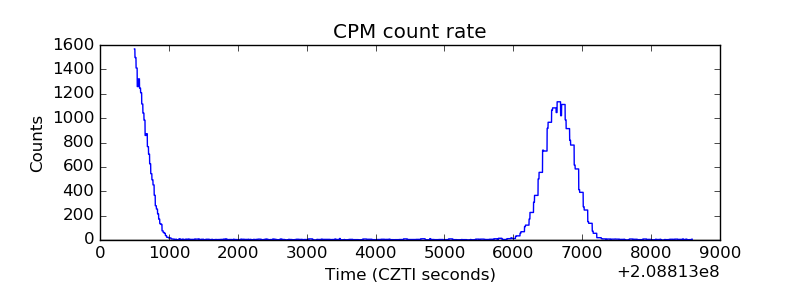 |
| CZT Counter | 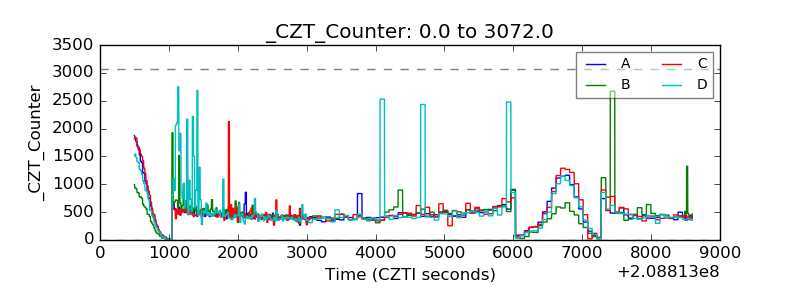 |
| +2.5 Volts monitor |  |
| +5 Volts monitor |  |
| _ROLL_ROT | 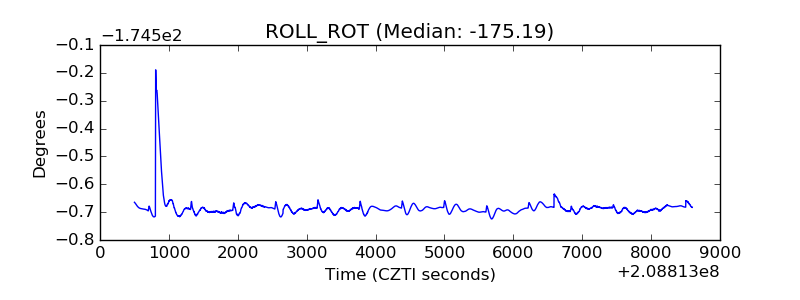 |
| _Roll_DEC | 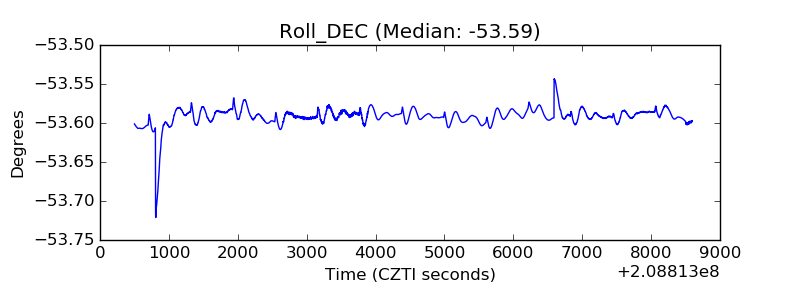 |
| _Roll_RA | 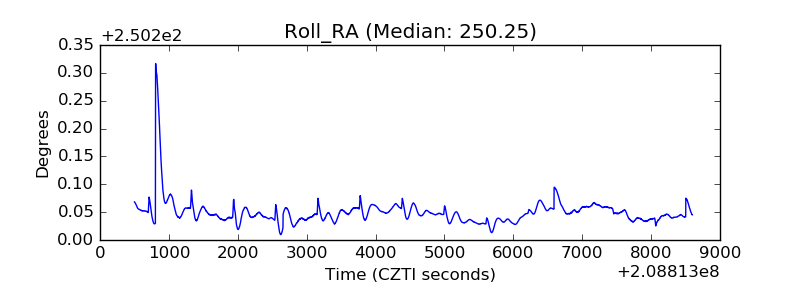 |
| Veto Counter | 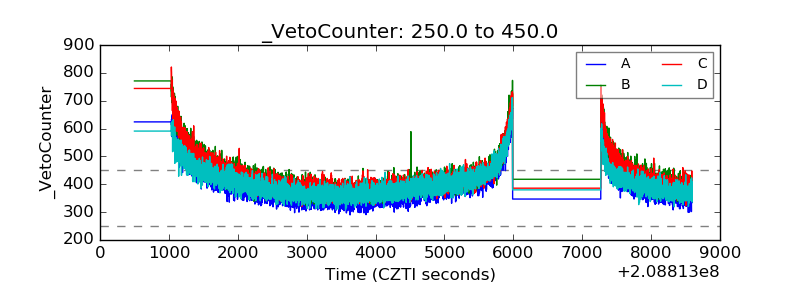 |