| Param | Original file | Final file |
|---|---|---|
| Filename | modeM0/AS1G05_195T01_9000000598_04750cztM0_level2.evt | modeM0/AS1G05_195T01_9000000598_04750cztM0_level2_quad_clean.evt |
| Size (bytes) | 484,885,440 | 81,622,080 |
| Size | 462.4 MB | 77.8 MB |
| Events in quadrant A | 3,193,170 | 496,176 |
| Events in quadrant B | 3,789,281 | 492,736 |
| Events in quadrant C | 3,647,735 | 503,562 |
| Events in quadrant D | 3,567,825 | 480,308 |
| Mode SS | |||
|---|---|---|---|
| Quadrant | BADHDUFLAG | Total packets | Discarded packets |
| A | 0 | 146 | 0 |
| B | 0 | 146 | 0 |
| C | 0 | 146 | 0 |
| D | 0 | 146 | 0 |
| Mode M9 | |||
|---|---|---|---|
| Quadrant | BADHDUFLAG | Total packets | Discarded packets |
| A | 0 | 20 | 0 |
| B | 0 | 20 | 0 |
| C | 0 | 20 | 0 |
| D | 0 | 20 | 0 |
| Mode M0 | |||
|---|---|---|---|
| Quadrant | BADHDUFLAG | Total packets | Discarded packets |
| A | 0 | 14733 | 3 |
| B | 0 | 16118 | 2 |
| C | 0 | 15707 | 2 |
| D | 0 | 16044 | 2 |
| Quadrant | Total seconds | Saturated seconds | Saturation percentage |
|---|---|---|---|
| A | 7168 | 46 | 0.641741% |
| B | 7168 | 143 | 1.994978% |
| C | 7168 | 66 | 0.920759% |
| D | 7168 | 139 | 1.939174% |
Noise dominated data is calculated using 1-second bins in cleaned event files. If a bin has >2000 counts, and if more than 50% of those come from <1% of pixels, then it is considered to be noise-dominated and hence unusable.
| Quadrant | # 1 sec bins | Bins with >0 counts | Bins with >2000 counts | High rate bins dominated by noise | Noise dominated (total time) | Noise dominated (detector-on time) | Marked lightcurve |
|---|---|---|---|---|---|---|---|
| A | 9118 | 7170 | 1 | 1 | 0.01% | 0.01% | 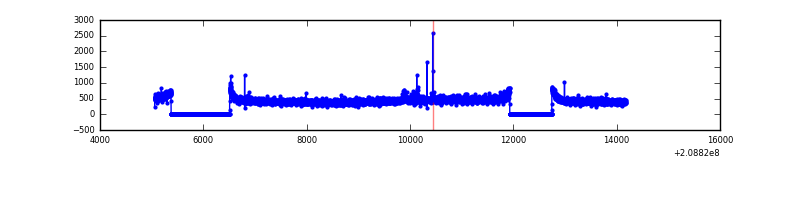 |
| B | 9118 | 7170 | 54 | 54 | 0.59% | 0.75% | 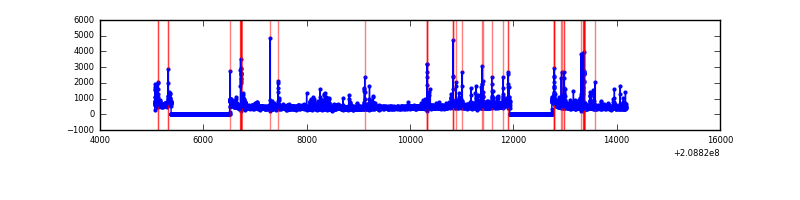 |
| C | 9118 | 7170 | 19 | 19 | 0.21% | 0.26% | 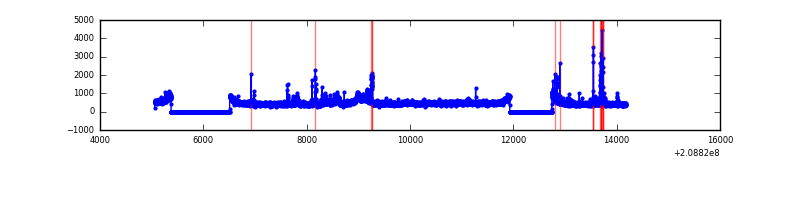 |
| D | 9118 | 7170 | 94 | 94 | 1.03% | 1.31% |  |
Top three noisy pixels from each quadrant. If the there are fewer than three noisy pixels in the level2.evt file, extra rows are filled as -1
| Pixel properties | Quadrant properties | ||||||
|---|---|---|---|---|---|---|---|
| Quadrant | DetID | PixID | Counts | Sigma | Mean | Median | Sigma |
| A | 0 | 50 | 20039 | 114.12 | 820 | 802 | 168.6 |
| A | 7 | 16 | 9711 | 52.85 | 820 | 802 | 168.6 |
| A | 12 | 194 | 8383 | 44.97 | 820 | 802 | 168.6 |
| B | 10 | 16 | 277313 | 1737.41 | 828 | 808 | 159.1 |
| B | 14 | 167 | 147860 | 923.99 | 828 | 808 | 159.1 |
| B | 15 | 204 | 56689 | 351.13 | 828 | 808 | 159.1 |
| C | 14 | 48 | 492958 | 2660.33 | 799 | 800 | 185.0 |
| C | 9 | 237 | 13825 | 70.41 | 799 | 800 | 185.0 |
| C | 12 | 4 | 12183 | 61.53 | 799 | 800 | 185.0 |
| D | 13 | 235 | 211944 | 1118.52 | 788 | 764 | 188.8 |
| D | 1 | 31 | 133834 | 704.81 | 788 | 764 | 188.8 |
| D | 13 | 239 | 75115 | 393.8 | 788 | 764 | 188.8 |
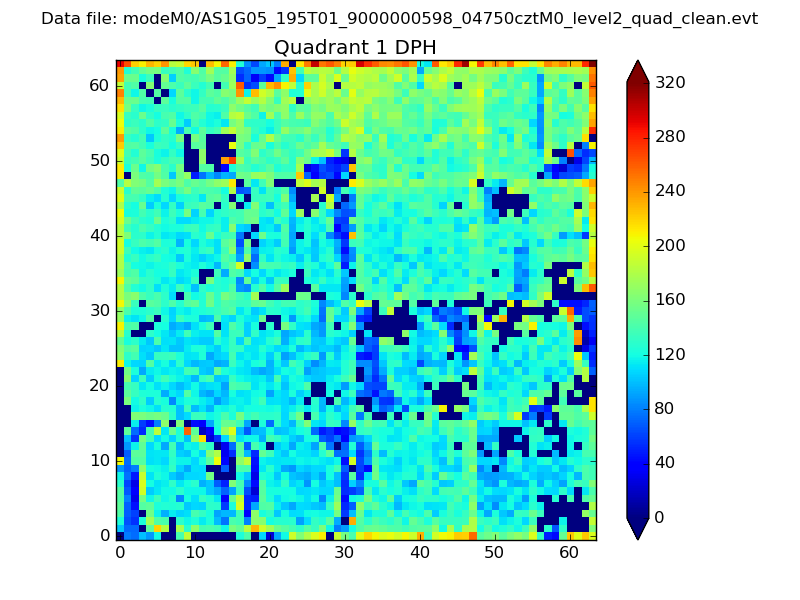
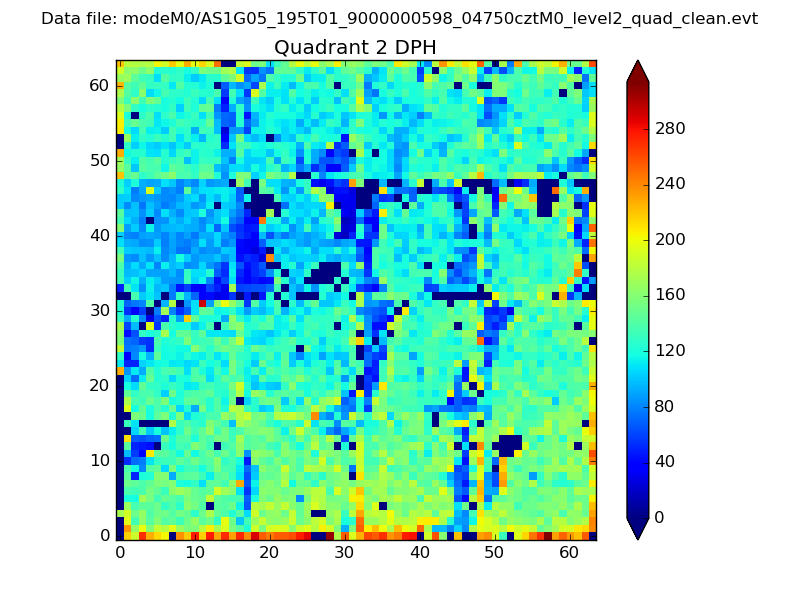
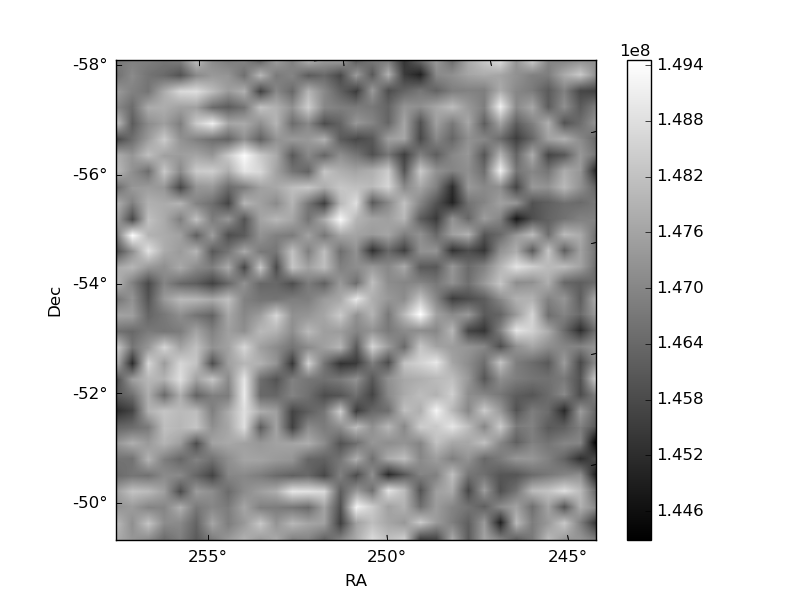
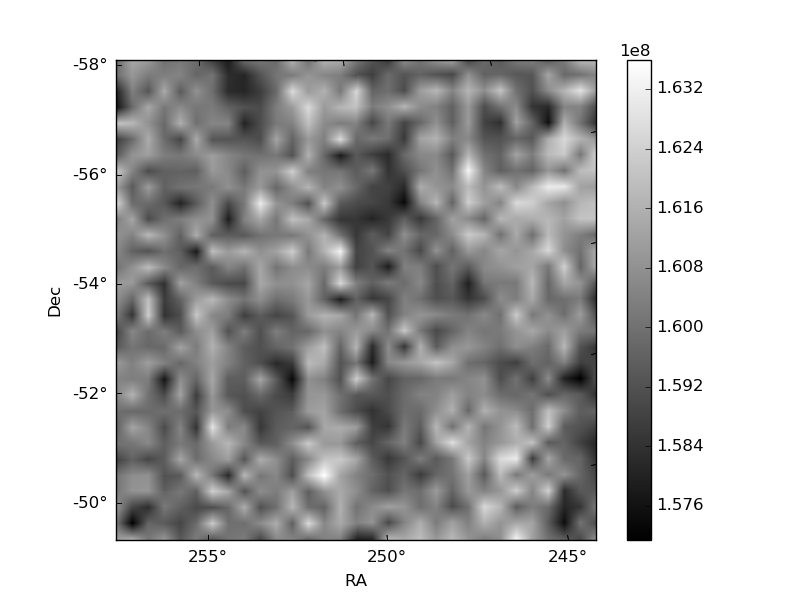
Histogram calculated using DETX and DETY for each event in the final _common_clean file
| Quadrant A | 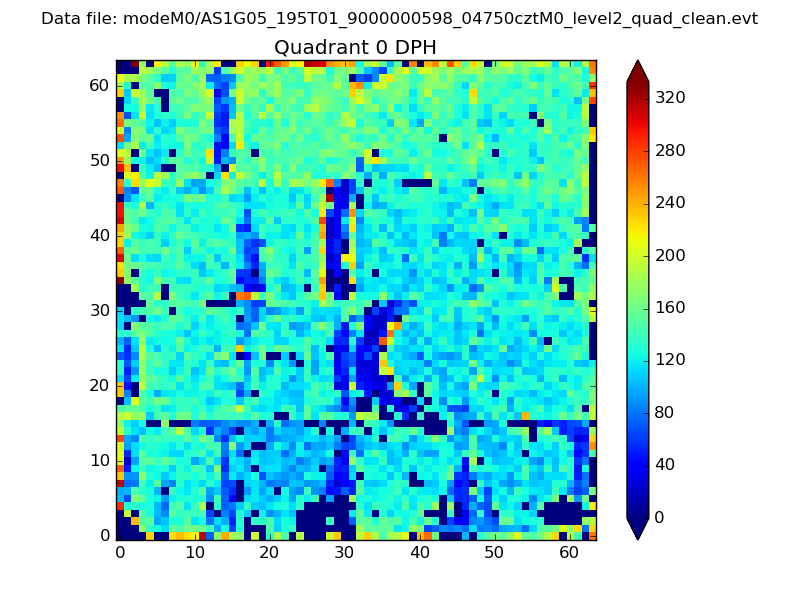 |
 |
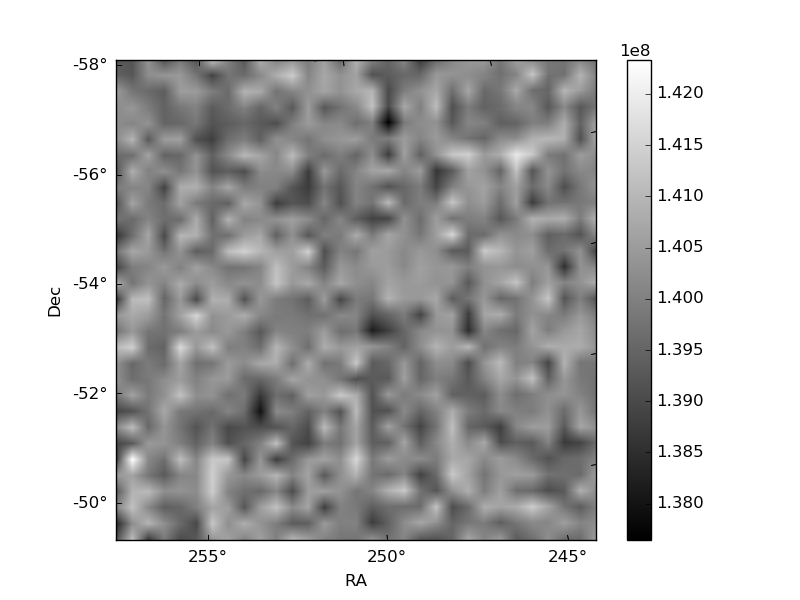
Quadrant B |
|---|---|---|---|
| Quadrant D | 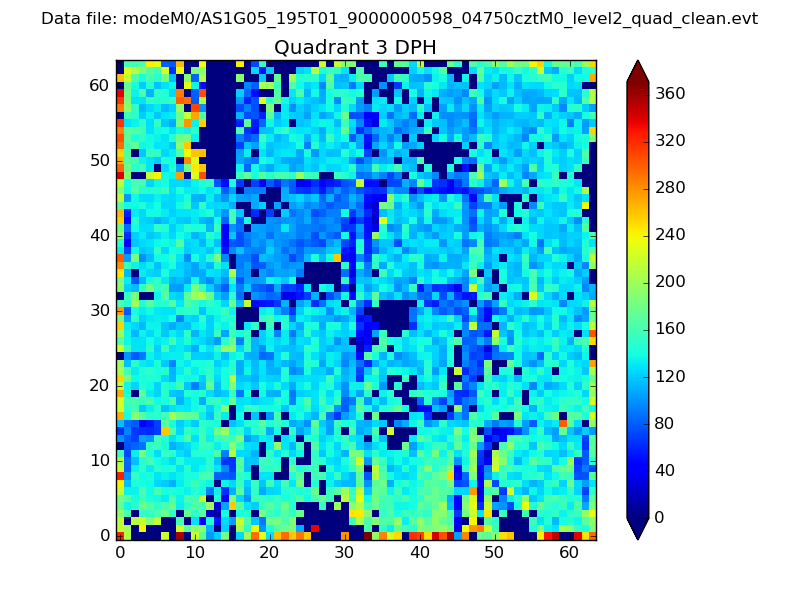 |
 |
Quadrant C |
| Plot type | Count rate plots | Images |
|---|---|---|
| Comparison with Poisson distribution Blue bars denote a histogram of data divided into 1 sec bins. Red curve is a Poisson curve with rate = median count rate of data. |
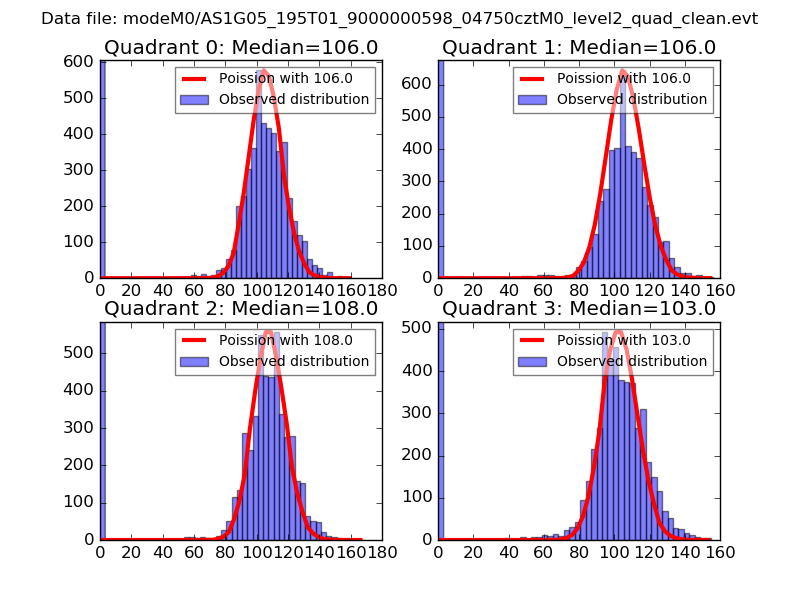 |
 |
| Quadrant-wise count rates Data is divided into 100 sec bins |
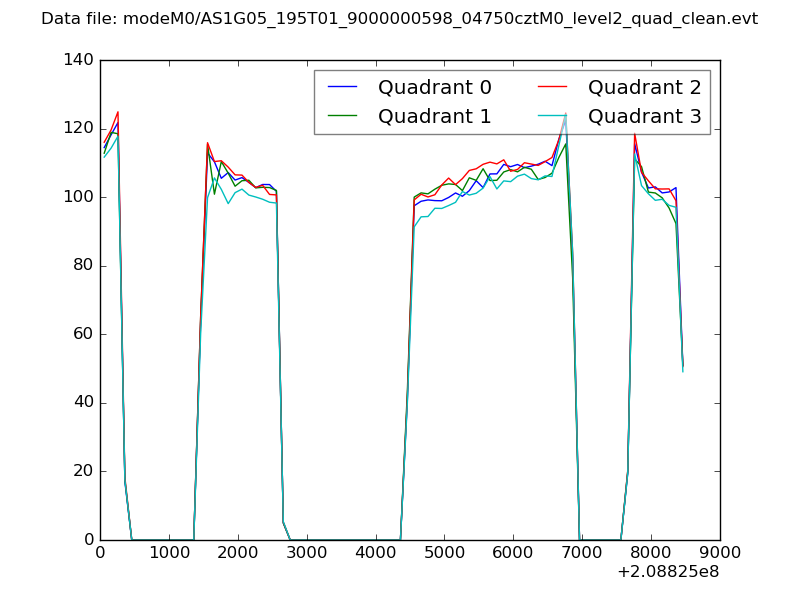 |
|
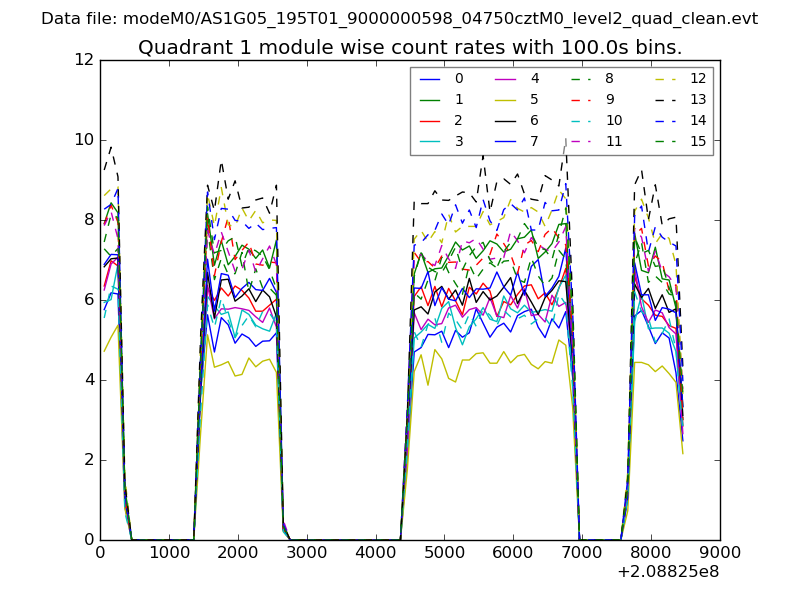
| Module-wise count rates for Quadrant A Data is divided into 100 sec bins |
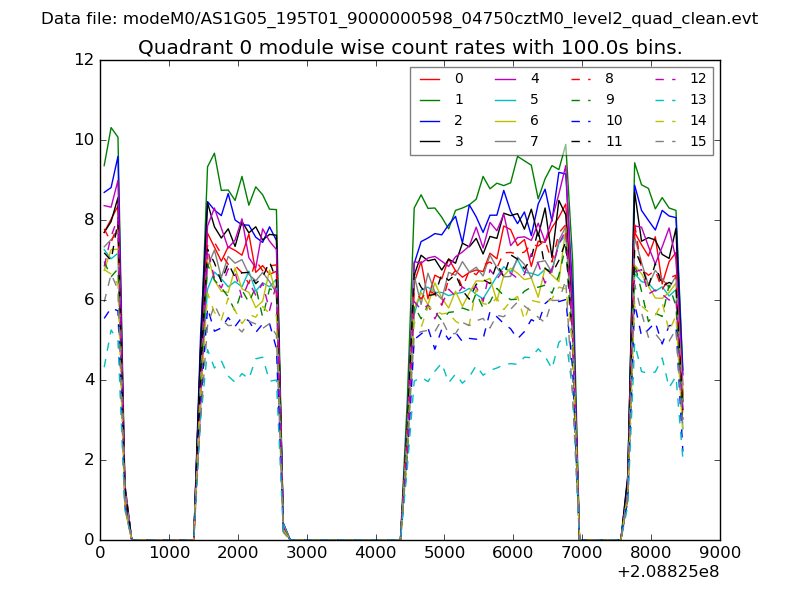 |
 |
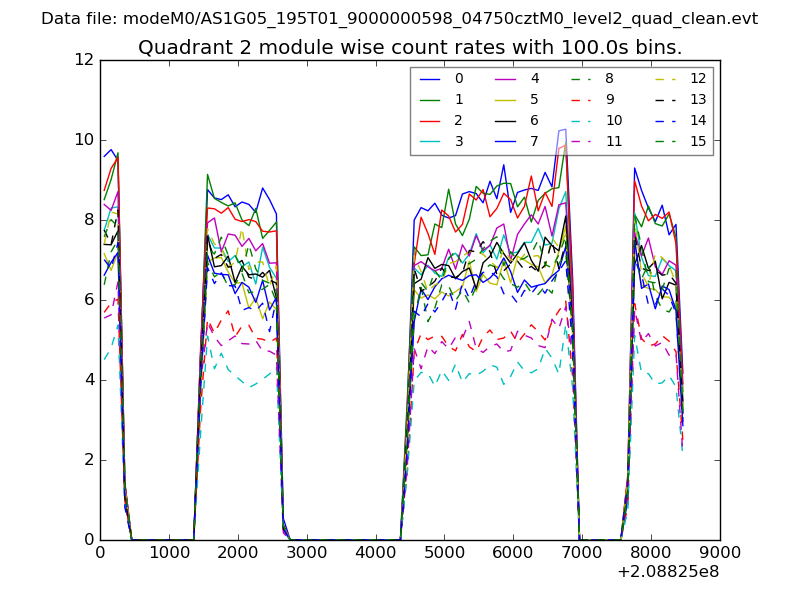
| Module-wise count rates for Quadrant B Data is divided into 100 sec bins |
 |
 |
| Module-wise count rates for Quadrant C Data is divided into 100 sec bins |
 |
 |
| Module-wise count rates for Quadrant D Data is divided into 100 sec bins |
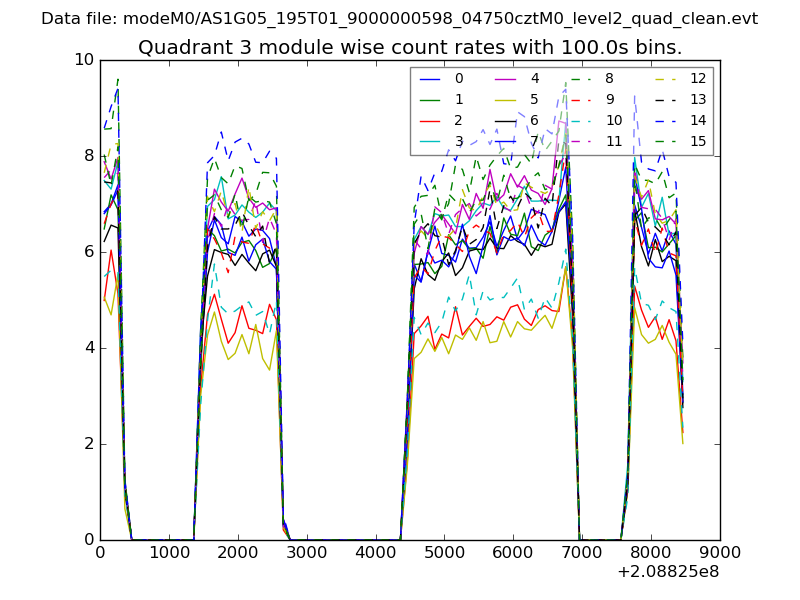 |
 |
| Parameter | Plot |
|---|---|
| CZT HV Monitor | 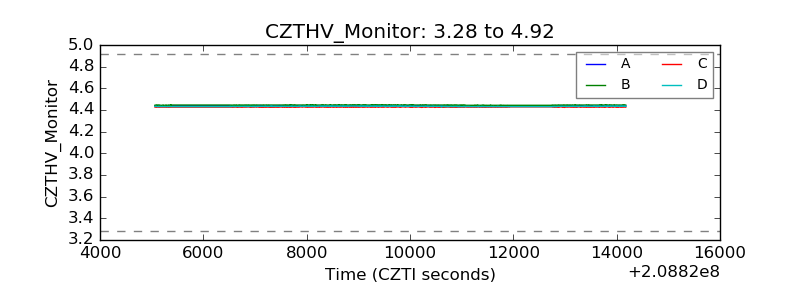 |
| D_VDD | 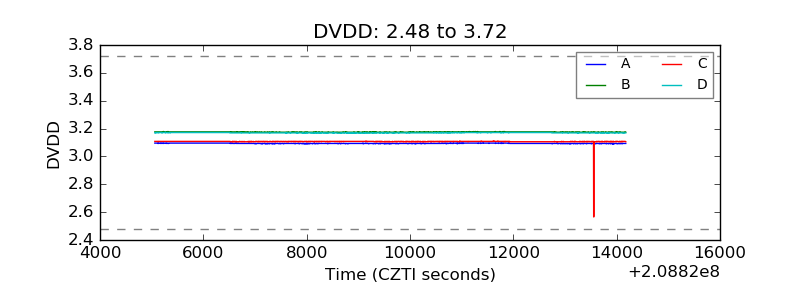 |
| Temperature 1 | 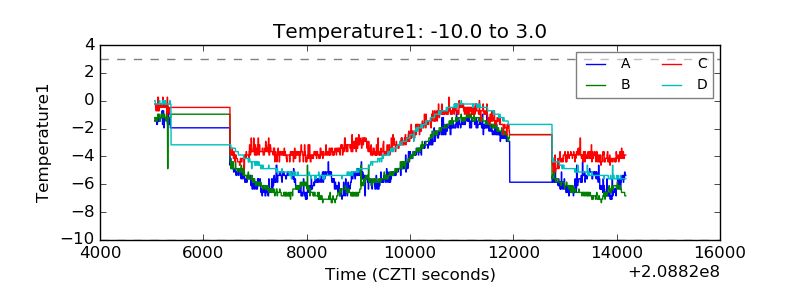 |
| Veto HV Monitor | 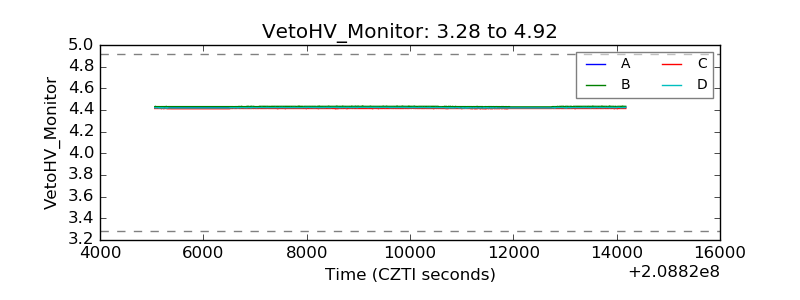 |
| Veto LLD | 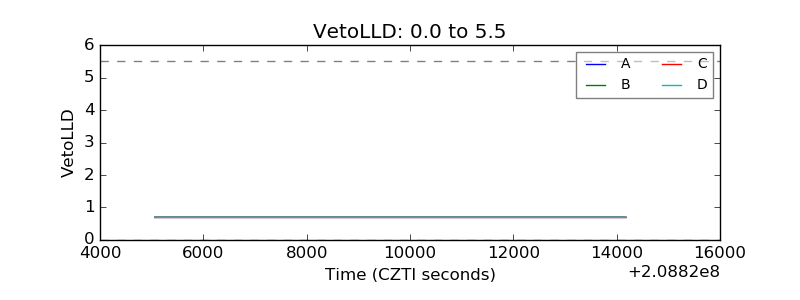 |
| Alpha Counter | 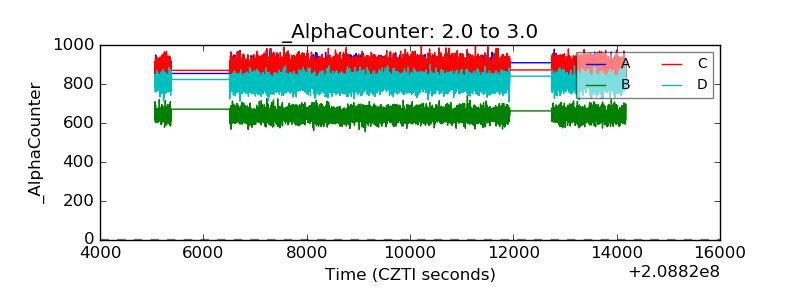 |
| _CPM_Rate | 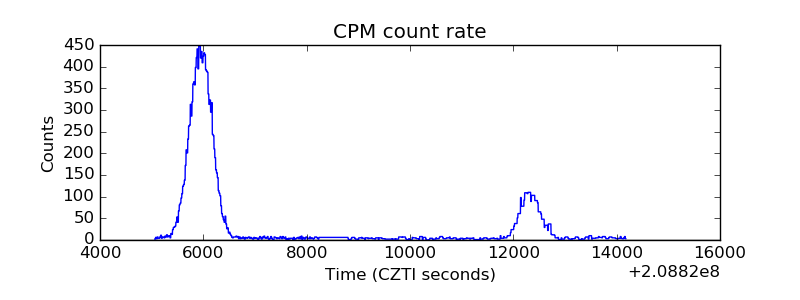 |
| CZT Counter | 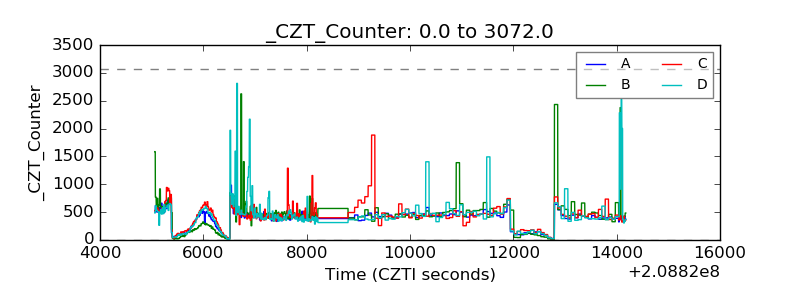 |
| +2.5 Volts monitor |  |
| +5 Volts monitor |  |
| _ROLL_ROT | 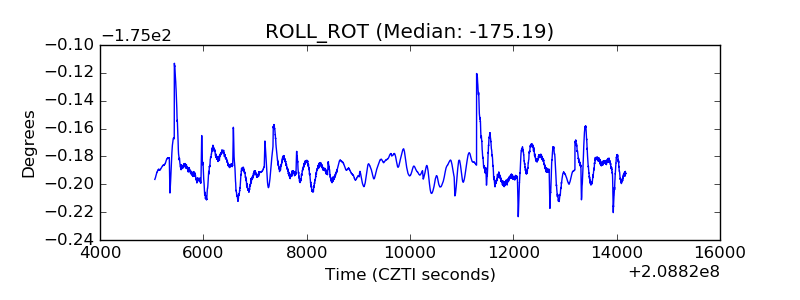 |
| _Roll_DEC | 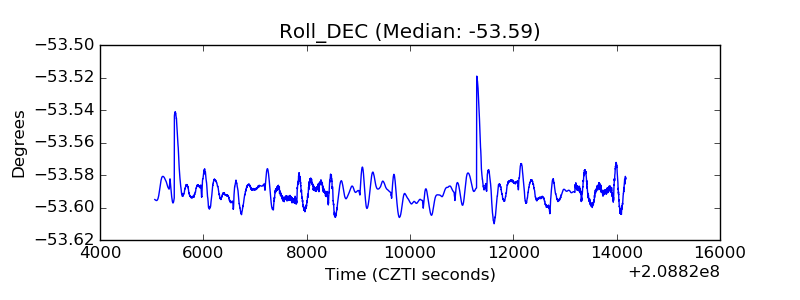 |
| _Roll_RA | 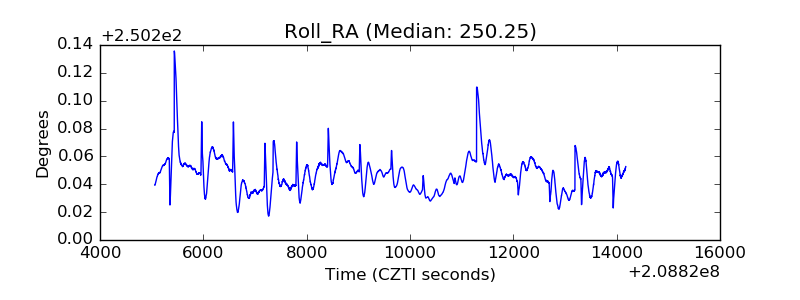 |
| Veto Counter | 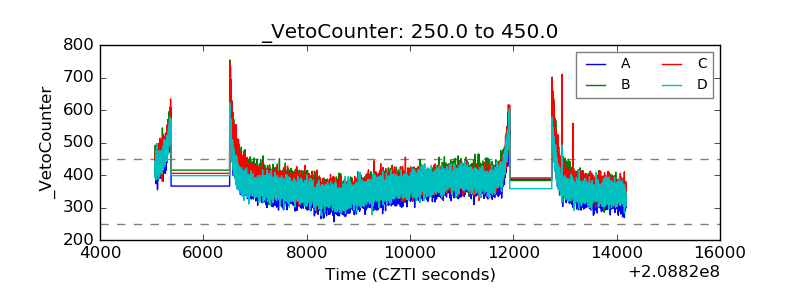 |