| Param | Original file | Final file |
|---|---|---|
| Filename | modeM0/AS1G05_195T01_9000000598_04751cztM0_level2.evt | modeM0/AS1G05_195T01_9000000598_04751cztM0_level2_quad_clean.evt |
| Size (bytes) | 588,441,600 | 87,693,120 |
| Size | 561.2 MB | 83.6 MB |
| Events in quadrant A | 3,685,098 | 525,812 |
| Events in quadrant B | 4,537,163 | 518,311 |
| Events in quadrant C | 5,061,378 | 529,213 |
| Events in quadrant D | 3,982,090 | 513,530 |
| Mode SS | |||
|---|---|---|---|
| Quadrant | BADHDUFLAG | Total packets | Discarded packets |
| A | 0 | 168 | 0 |
| B | 0 | 168 | 0 |
| C | 0 | 168 | 0 |
| D | 0 | 168 | 0 |
| Mode M9 | |||
|---|---|---|---|
| Quadrant | BADHDUFLAG | Total packets | Discarded packets |
| A | 0 | 12 | 0 |
| B | 0 | 12 | 0 |
| C | 0 | 12 | 0 |
| D | 0 | 12 | 0 |
| Mode M0 | |||
|---|---|---|---|
| Quadrant | BADHDUFLAG | Total packets | Discarded packets |
| A | 0 | 16971 | 3 |
| B | 0 | 19103 | 2 |
| C | 0 | 20799 | 2 |
| D | 0 | 18024 | 2 |
| Quadrant | Total seconds | Saturated seconds | Saturation percentage |
|---|---|---|---|
| A | 8179 | 100 | 1.222643% |
| B | 8179 | 261 | 3.191099% |
| C | 8179 | 419 | 5.122876% |
| D | 8179 | 137 | 1.675021% |
Noise dominated data is calculated using 1-second bins in cleaned event files. If a bin has >2000 counts, and if more than 50% of those come from <1% of pixels, then it is considered to be noise-dominated and hence unusable.
| Quadrant | # 1 sec bins | Bins with >0 counts | Bins with >2000 counts | High rate bins dominated by noise | Noise dominated (total time) | Noise dominated (detector-on time) | Marked lightcurve |
|---|---|---|---|---|---|---|---|
| A | 9399 | 8181 | 0 | 0 | 0.00% | 0.00% | 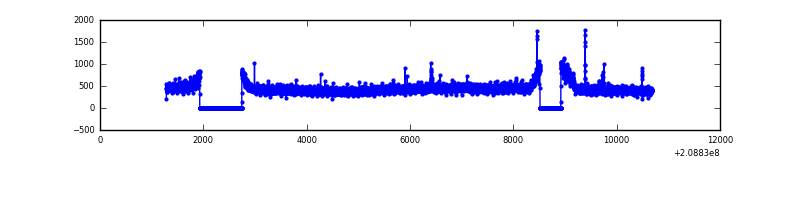 |
| B | 9399 | 8181 | 109 | 109 | 1.16% | 1.33% | 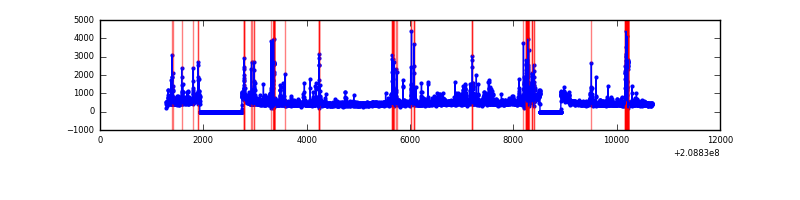 |
| C | 9399 | 8181 | 296 | 296 | 3.15% | 3.62% | 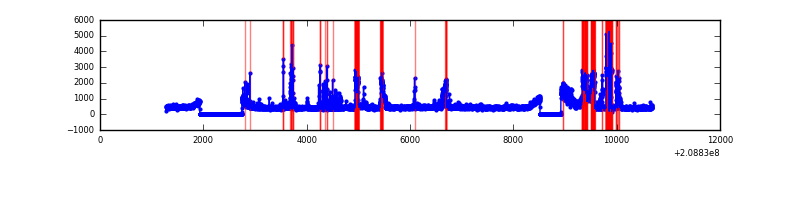 |
| D | 9399 | 8181 | 54 | 54 | 0.57% | 0.66% | 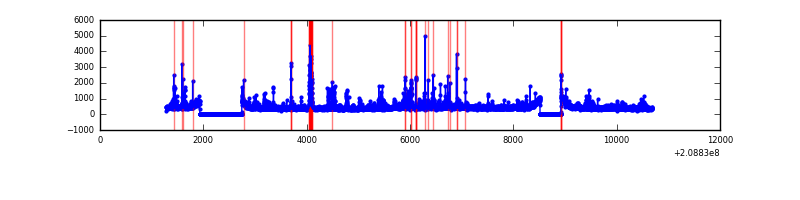 |
Top three noisy pixels from each quadrant. If the there are fewer than three noisy pixels in the level2.evt file, extra rows are filled as -1
| Pixel properties | Quadrant properties | ||||||
|---|---|---|---|---|---|---|---|
| Quadrant | DetID | PixID | Counts | Sigma | Mean | Median | Sigma |
| A | 0 | 149 | 38693 | 195.24 | 940 | 918 | 193.5 |
| A | 0 | 226 | 12697 | 60.88 | 940 | 918 | 193.5 |
| A | 7 | 16 | 9741 | 45.6 | 940 | 918 | 193.5 |
| B | 10 | 16 | 552749 | 3014.42 | 945 | 921 | 183.1 |
| B | 15 | 204 | 92640 | 501.02 | 945 | 921 | 183.1 |
| B | 4 | 80 | 90326 | 488.38 | 945 | 921 | 183.1 |
| C | 14 | 48 | 1465257 | 6984.68 | 902 | 903 | 209.7 |
| C | 9 | 237 | 49136 | 230.06 | 902 | 903 | 209.7 |
| C | 12 | 4 | 12221 | 53.98 | 902 | 903 | 209.7 |
| D | 13 | 235 | 224402 | 1014.56 | 906 | 875 | 220.3 |
| D | 2 | 136 | 88141 | 396.09 | 906 | 875 | 220.3 |
| D | 2 | 234 | 76803 | 344.63 | 906 | 875 | 220.3 |
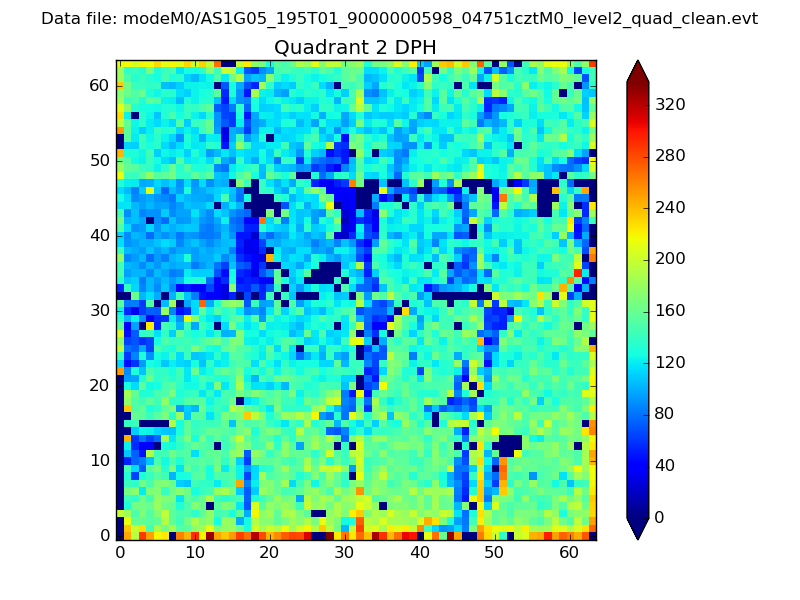
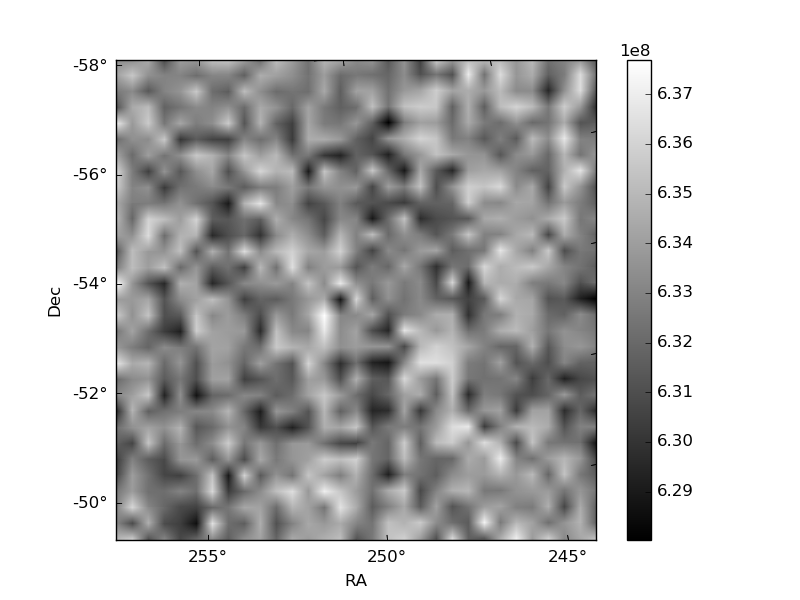
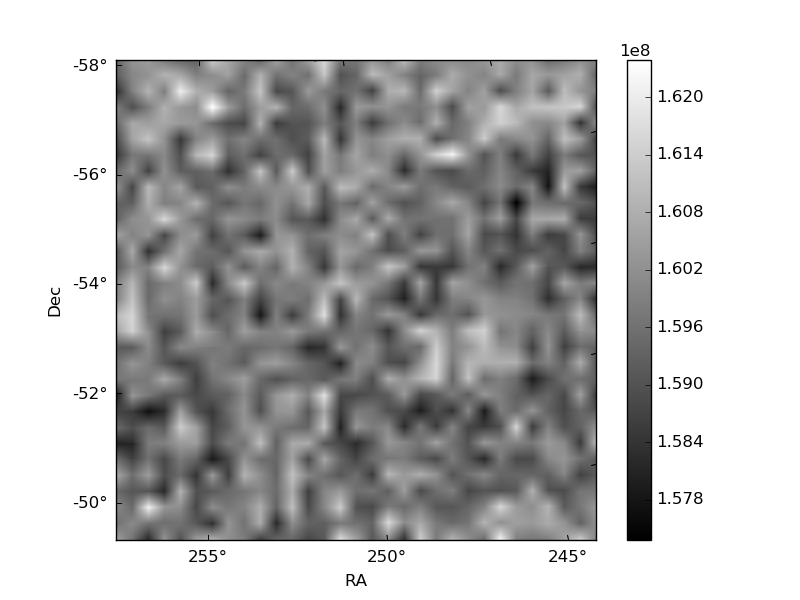
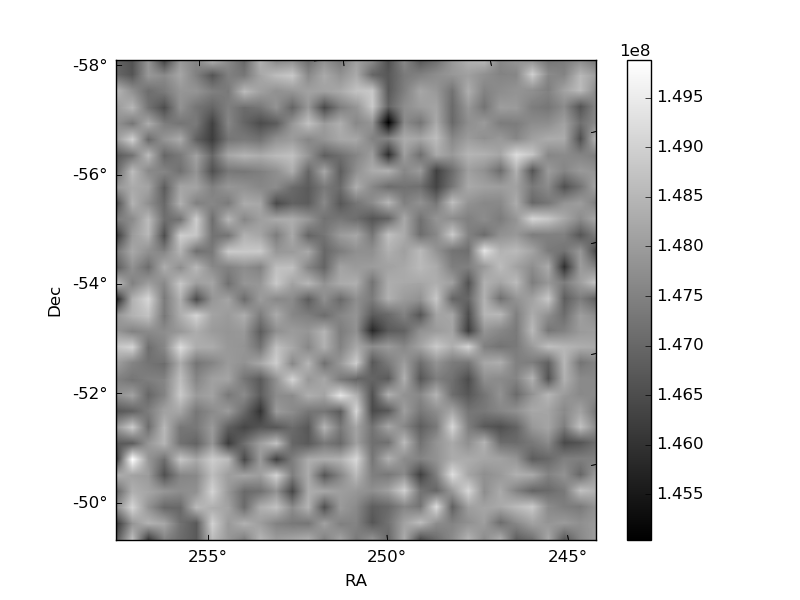
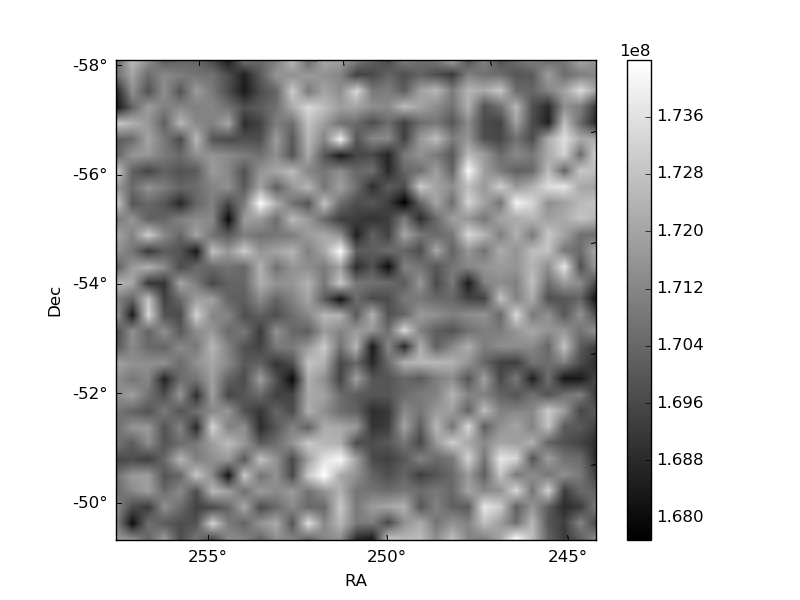
Histogram calculated using DETX and DETY for each event in the final _common_clean file
| Quadrant A | 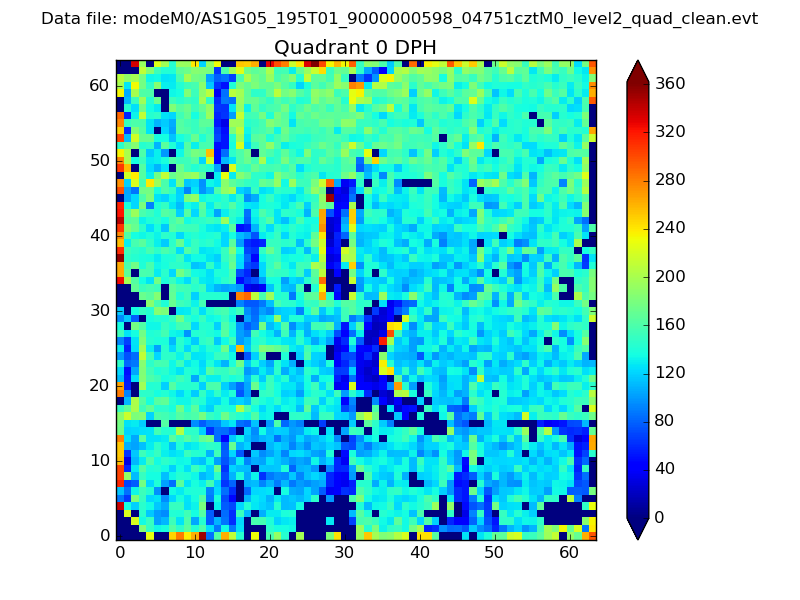 |
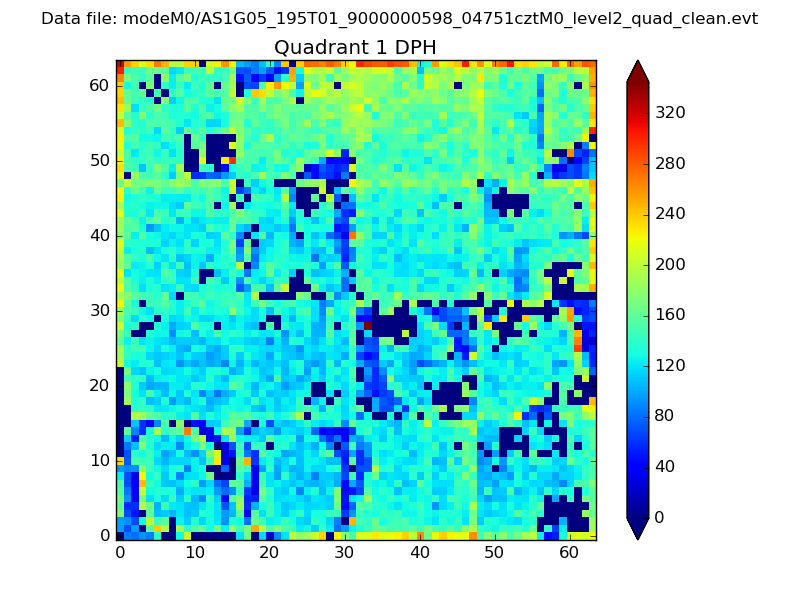 |
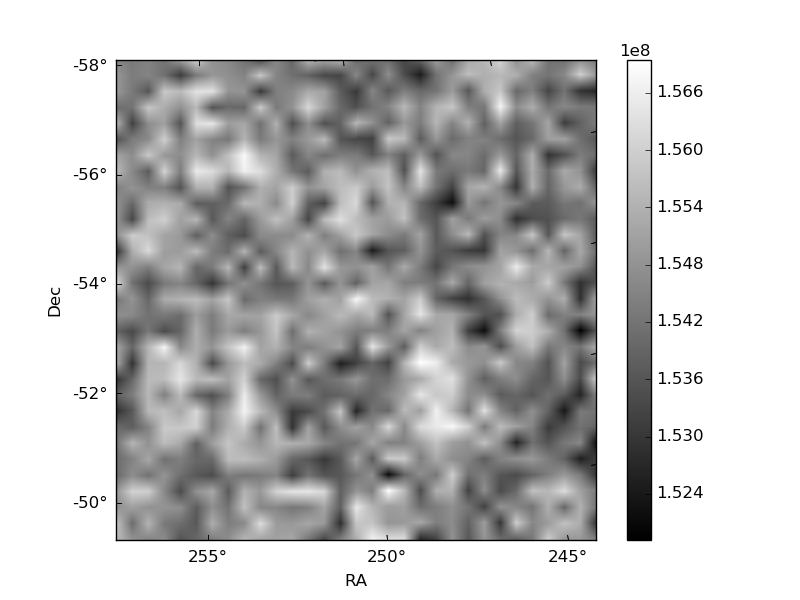
Quadrant B |
|---|---|---|---|
| Quadrant D | 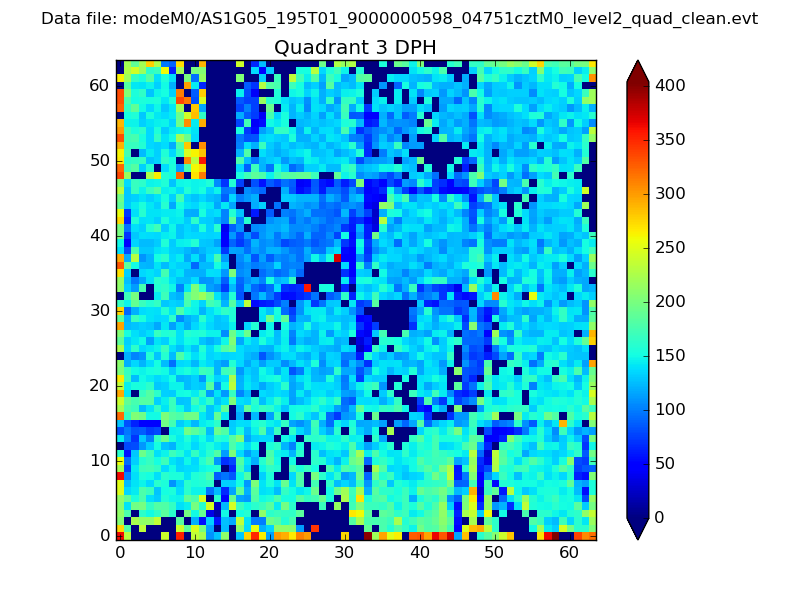 |
 |
Quadrant C |
| Plot type | Count rate plots | Images |
|---|---|---|
| Comparison with Poisson distribution Blue bars denote a histogram of data divided into 1 sec bins. Red curve is a Poisson curve with rate = median count rate of data. |
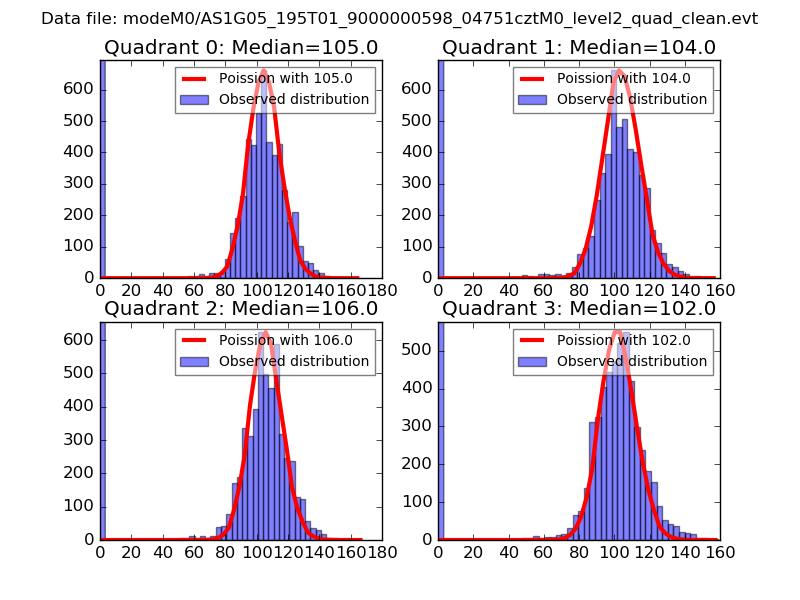 |
 |
| Quadrant-wise count rates Data is divided into 100 sec bins |
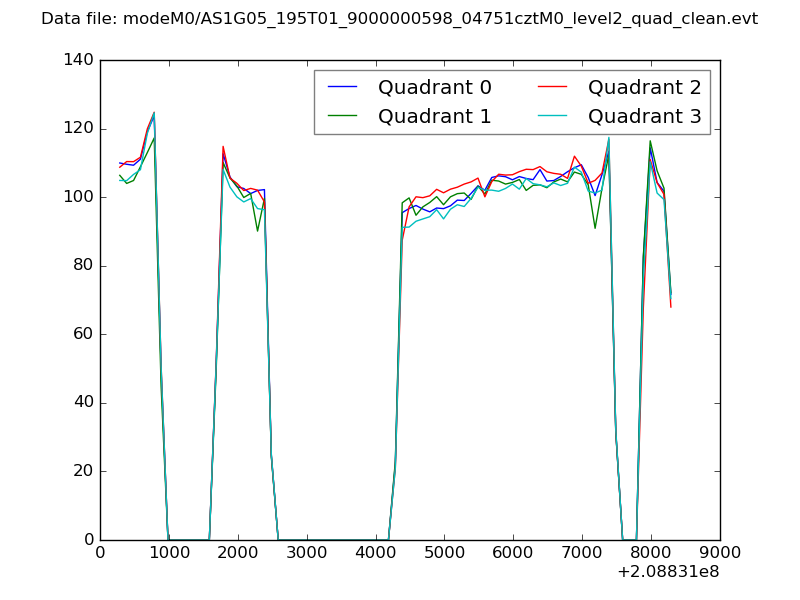 |
|
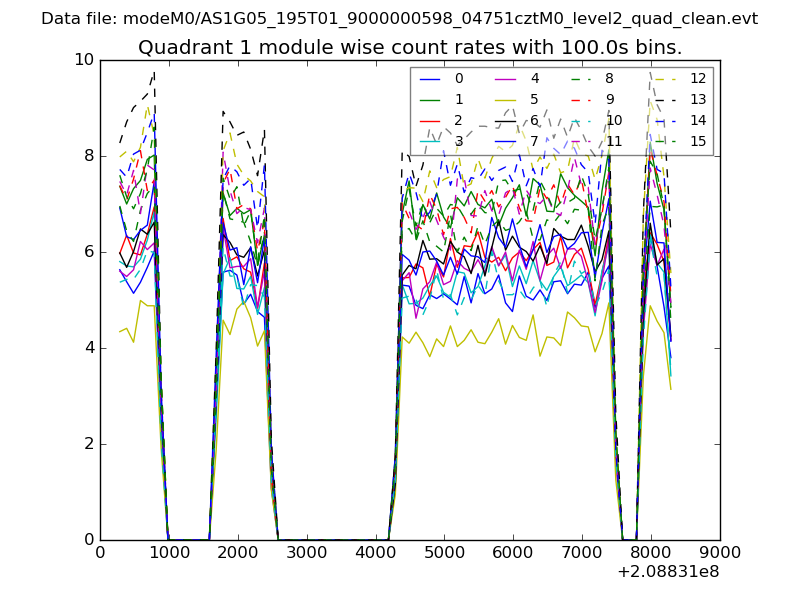
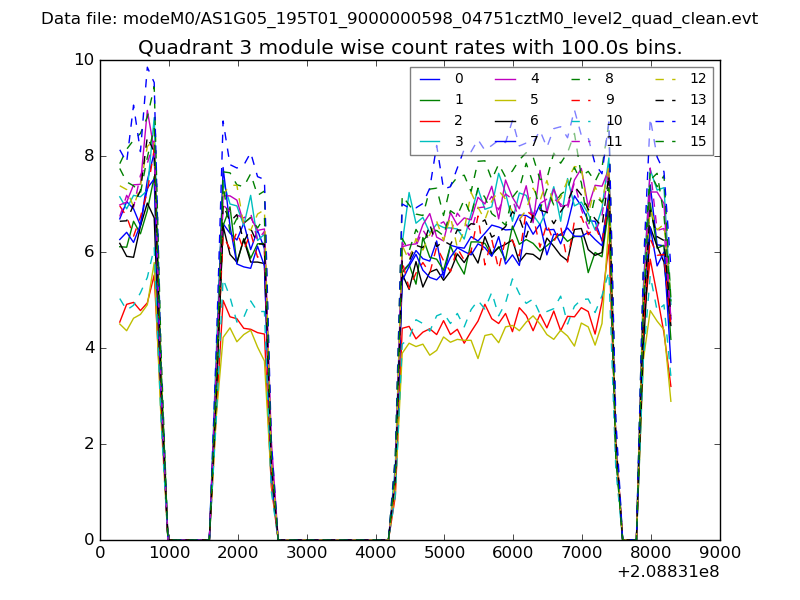
| Module-wise count rates for Quadrant A Data is divided into 100 sec bins |
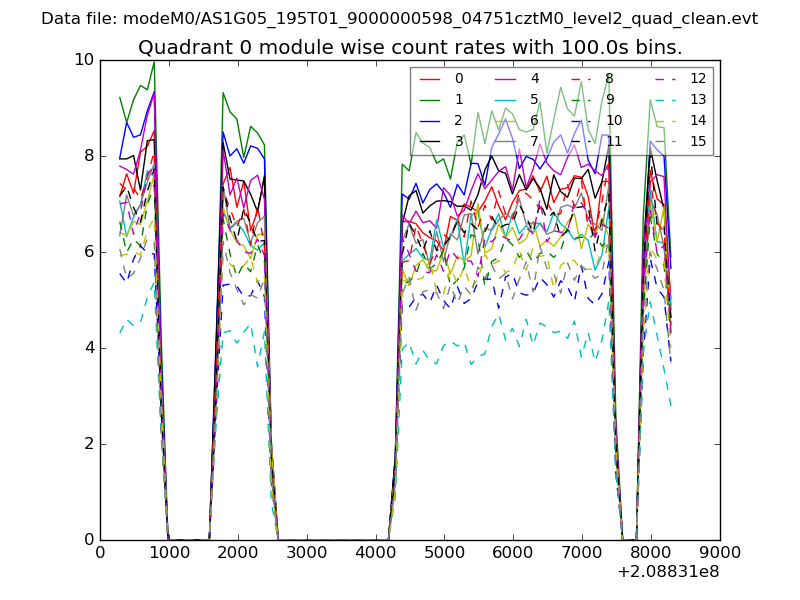 |
 |
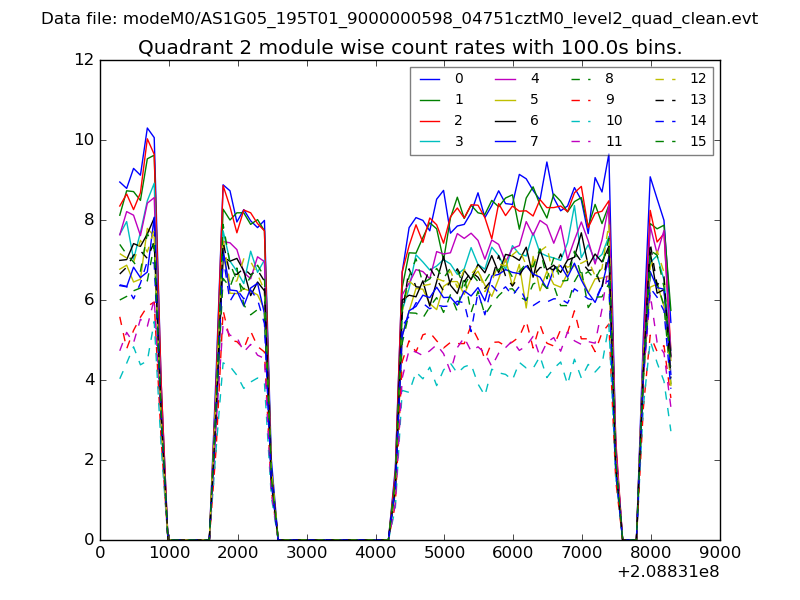
| Module-wise count rates for Quadrant B Data is divided into 100 sec bins |
 |
 |
| Module-wise count rates for Quadrant C Data is divided into 100 sec bins |
 |
 |
| Module-wise count rates for Quadrant D Data is divided into 100 sec bins |
 |
 |
| Parameter | Plot |
|---|---|
| CZT HV Monitor | 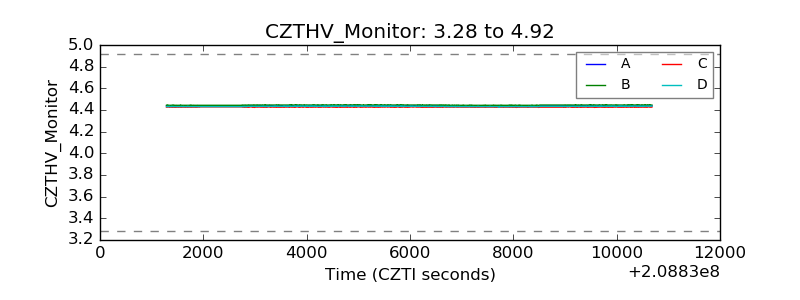 |
| D_VDD | 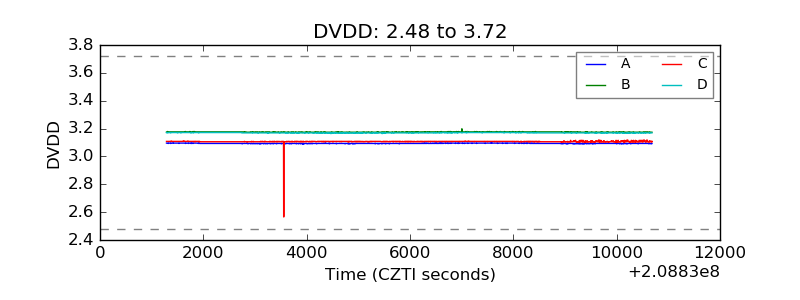 |
| Temperature 1 | 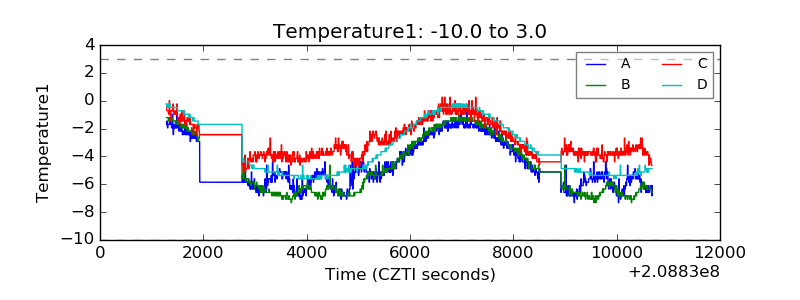 |
| Veto HV Monitor | 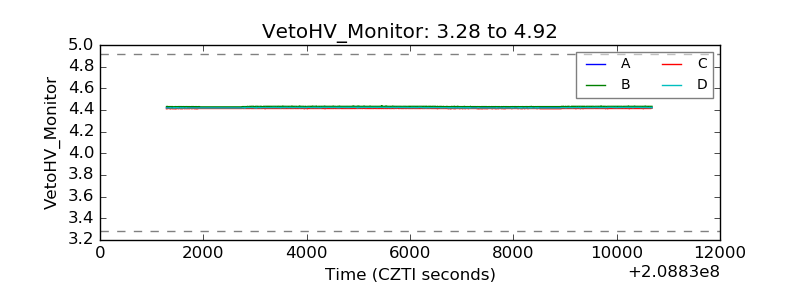 |
| Veto LLD | 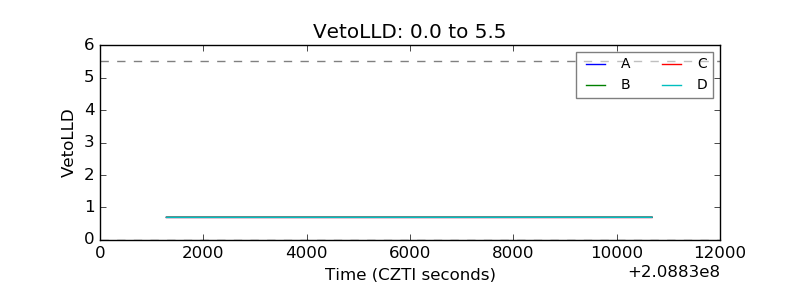 |
| Alpha Counter | 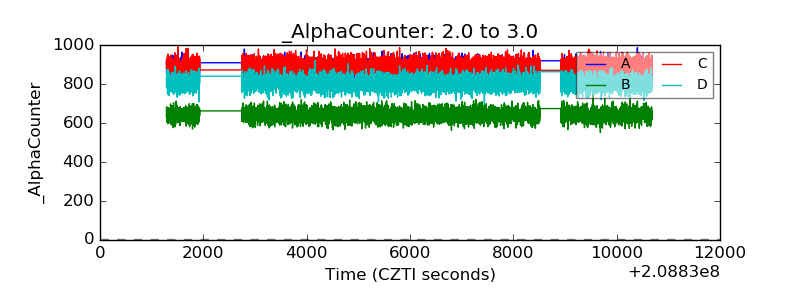 |
| _CPM_Rate | 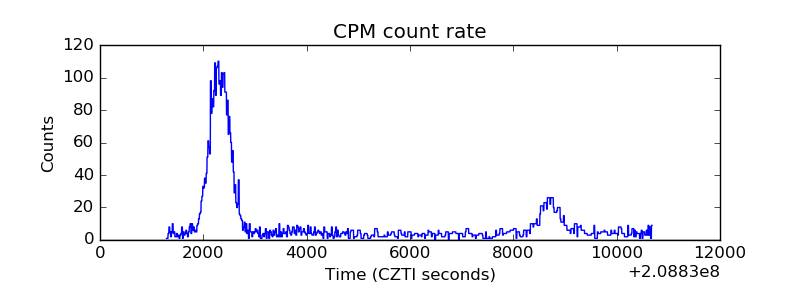 |
| CZT Counter | 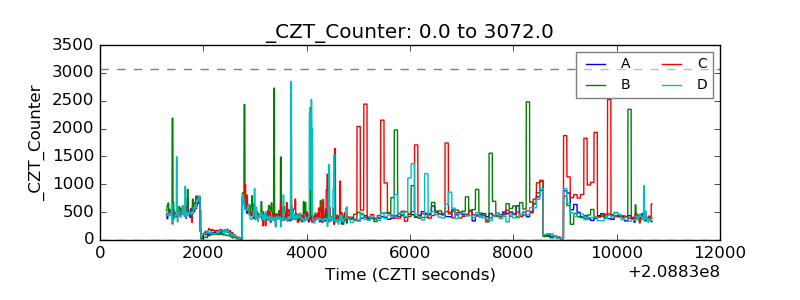 |
| +2.5 Volts monitor |  |
| +5 Volts monitor |  |
| _ROLL_ROT | 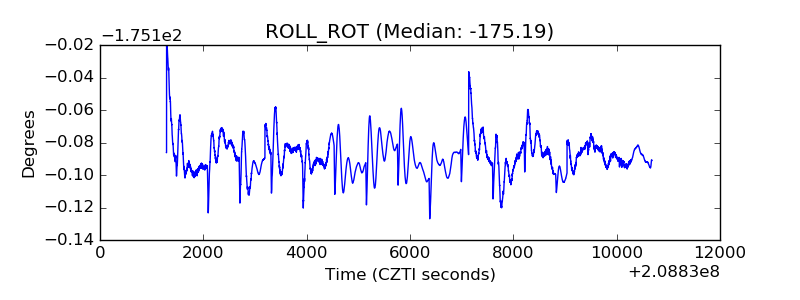 |
| _Roll_DEC | 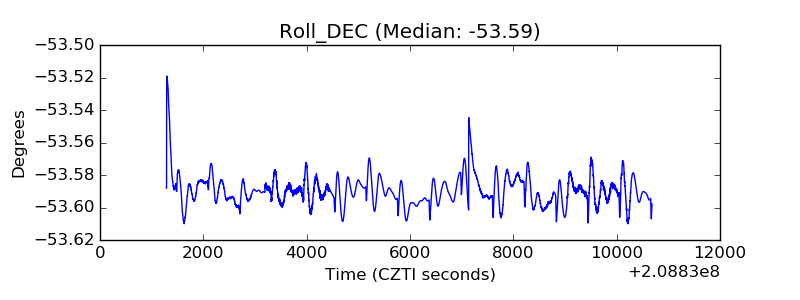 |
| _Roll_RA | 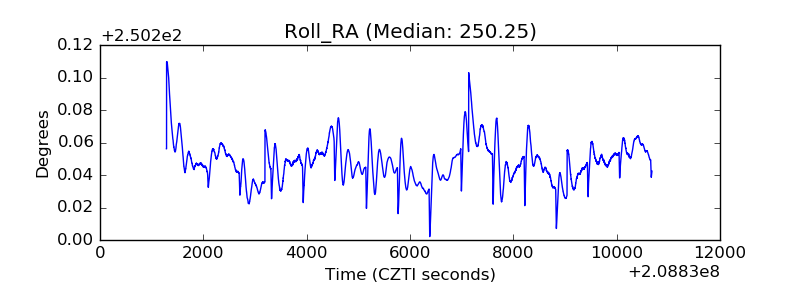 |
| Veto Counter | 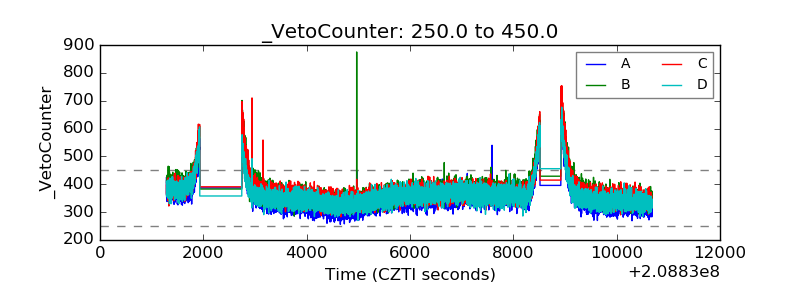 |