| Param | Original file | Final file |
|---|---|---|
| Filename | modeM0/AS1G05_195T01_9000000598_04752cztM0_level2.evt | modeM0/AS1G05_195T01_9000000598_04752cztM0_level2_quad_clean.evt |
| Size (bytes) | 495,901,440 | 68,284,800 |
| Size | 472.9 MB | 65.1 MB |
| Events in quadrant A | 3,262,121 | 392,463 |
| Events in quadrant B | 3,932,119 | 389,215 |
| Events in quadrant C | 3,897,791 | 396,982 |
| Events in quadrant D | 3,432,615 | 383,059 |
| Mode SS | |||
|---|---|---|---|
| Quadrant | BADHDUFLAG | Total packets | Discarded packets |
| A | 0 | 148 | 0 |
| B | 0 | 148 | 0 |
| C | 0 | 148 | 0 |
| D | 0 | 148 | 0 |
| Mode M0 | |||
|---|---|---|---|
| Quadrant | BADHDUFLAG | Total packets | Discarded packets |
| A | 0 | 15091 | 3 |
| B | 0 | 16681 | 2 |
| C | 0 | 16809 | 2 |
| D | 0 | 15817 | 2 |
| Quadrant | Total seconds | Saturated seconds | Saturation percentage |
|---|---|---|---|
| A | 7250 | 166 | 2.289655% |
| B | 7250 | 303 | 4.179310% |
| C | 7250 | 350 | 4.827586% |
| D | 7250 | 201 | 2.772414% |
Noise dominated data is calculated using 1-second bins in cleaned event files. If a bin has >2000 counts, and if more than 50% of those come from <1% of pixels, then it is considered to be noise-dominated and hence unusable.
| Quadrant | # 1 sec bins | Bins with >0 counts | Bins with >2000 counts | High rate bins dominated by noise | Noise dominated (total time) | Noise dominated (detector-on time) | Marked lightcurve |
|---|---|---|---|---|---|---|---|
| A | 7385 | 7253 | 3 | 3 | 0.04% | 0.04% | 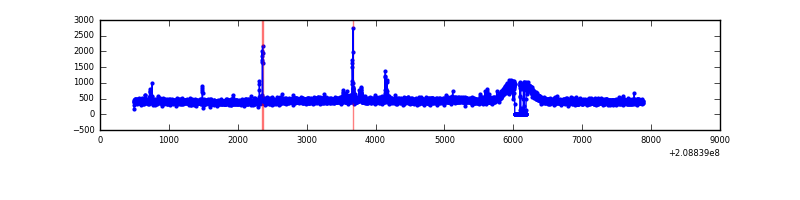 |
| B | 7385 | 7253 | 103 | 103 | 1.39% | 1.42% | 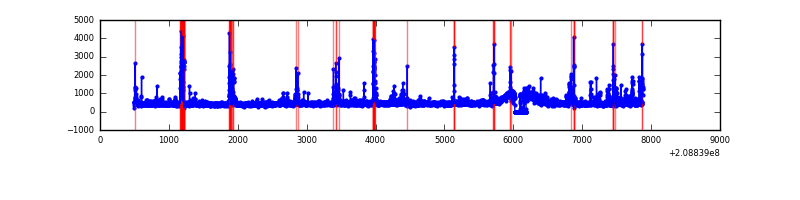 |
| C | 7385 | 7253 | 165 | 165 | 2.23% | 2.27% | 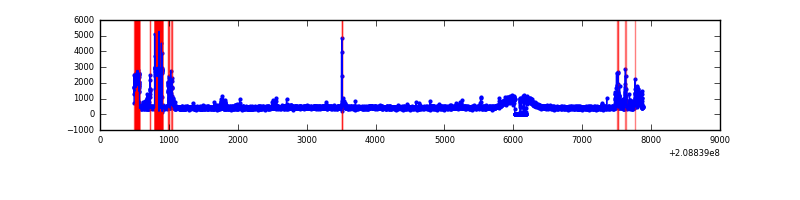 |
| D | 7385 | 7253 | 28 | 28 | 0.38% | 0.39% | 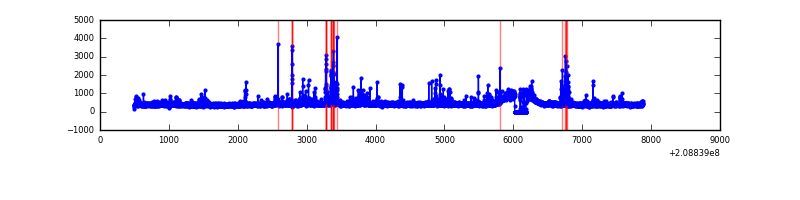 |
Top three noisy pixels from each quadrant. If the there are fewer than three noisy pixels in the level2.evt file, extra rows are filled as -1
| Pixel properties | Quadrant properties | ||||||
|---|---|---|---|---|---|---|---|
| Quadrant | DetID | PixID | Counts | Sigma | Mean | Median | Sigma |
| A | 0 | 149 | 29419 | 165.7 | 830 | 807 | 172.7 |
| A | 0 | 230 | 12977 | 70.48 | 830 | 807 | 172.7 |
| A | 0 | 226 | 11729 | 63.25 | 830 | 807 | 172.7 |
| B | 10 | 16 | 449792 | 2782.19 | 835 | 813 | 161.4 |
| B | 4 | 80 | 145954 | 899.4 | 835 | 813 | 161.4 |
| B | 14 | 167 | 44266 | 269.27 | 835 | 813 | 161.4 |
| C | 14 | 48 | 684653 | 3625.94 | 805 | 809 | 188.6 |
| C | 9 | 237 | 32734 | 169.28 | 805 | 809 | 188.6 |
| C | 8 | 128 | 17385 | 87.89 | 805 | 809 | 188.6 |
| D | 2 | 234 | 147121 | 750.29 | 804 | 779 | 195.0 |
| D | 2 | 136 | 123609 | 629.75 | 804 | 779 | 195.0 |
| D | 13 | 235 | 64918 | 328.84 | 804 | 779 | 195.0 |
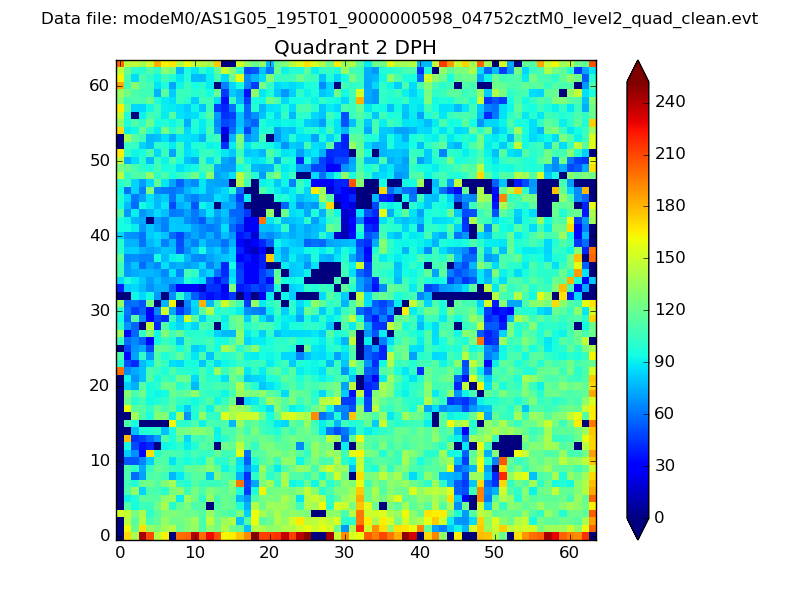
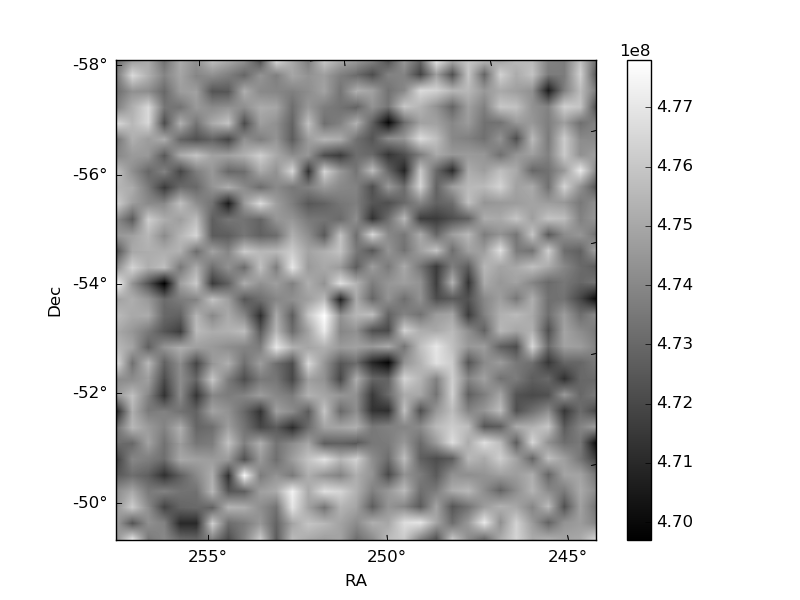
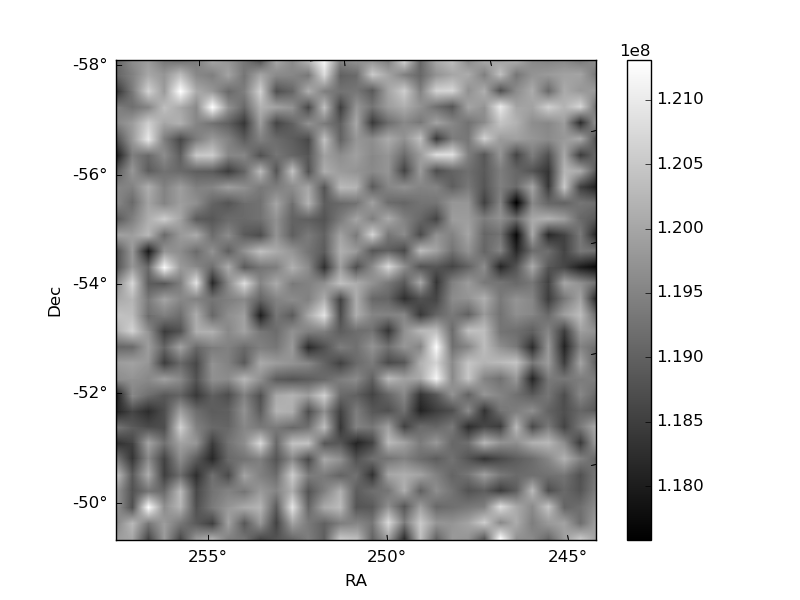
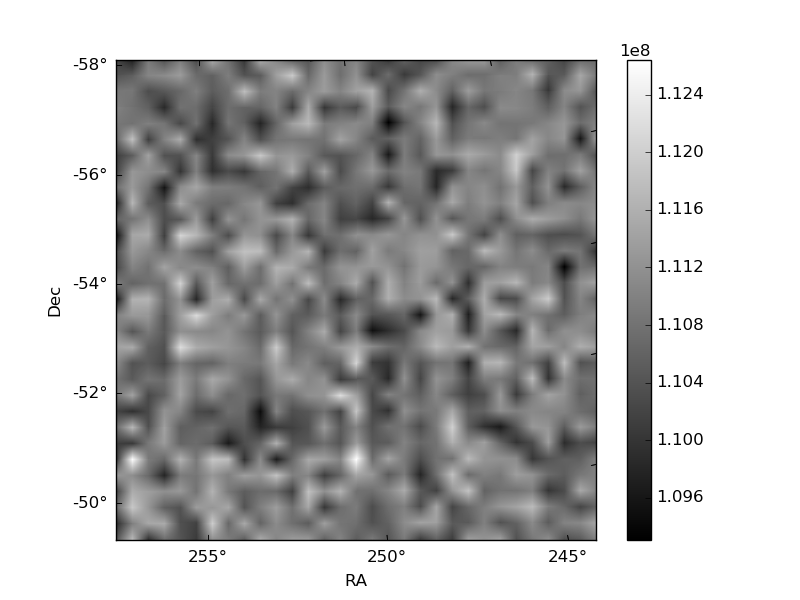
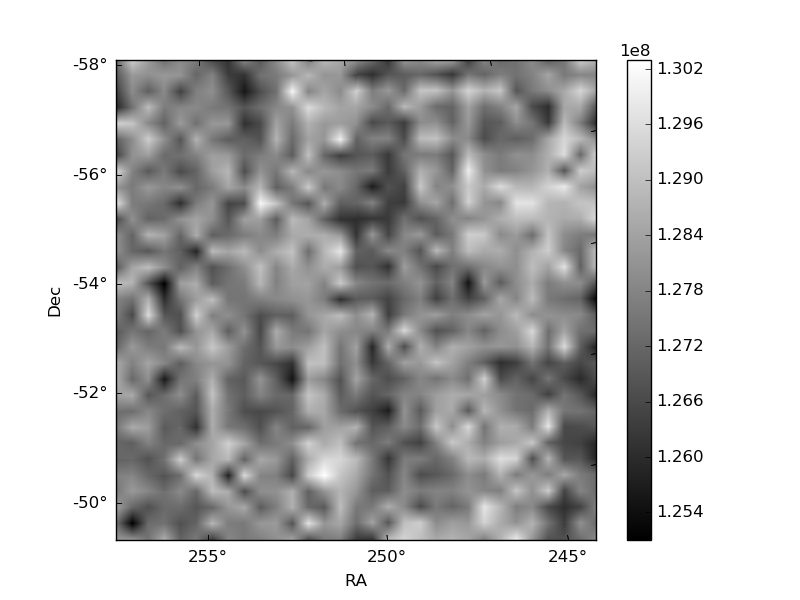
Histogram calculated using DETX and DETY for each event in the final _common_clean file
| Quadrant A | 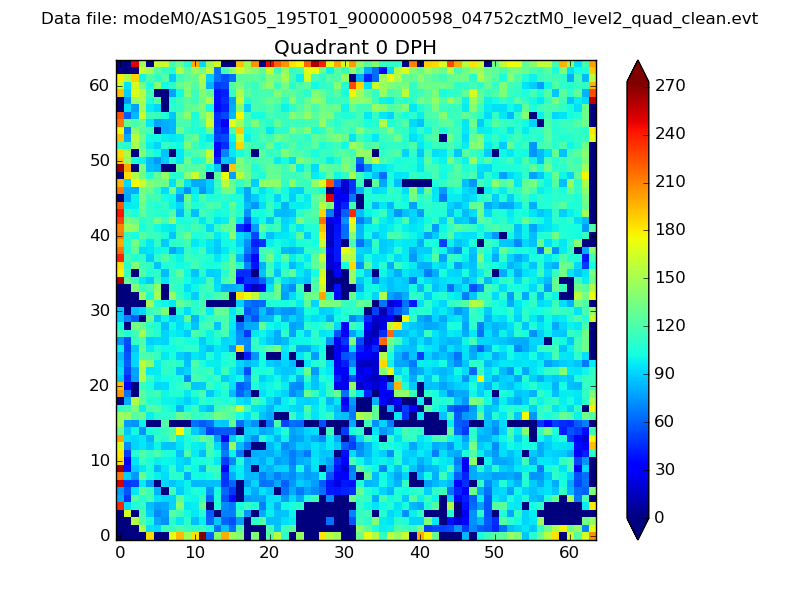 |
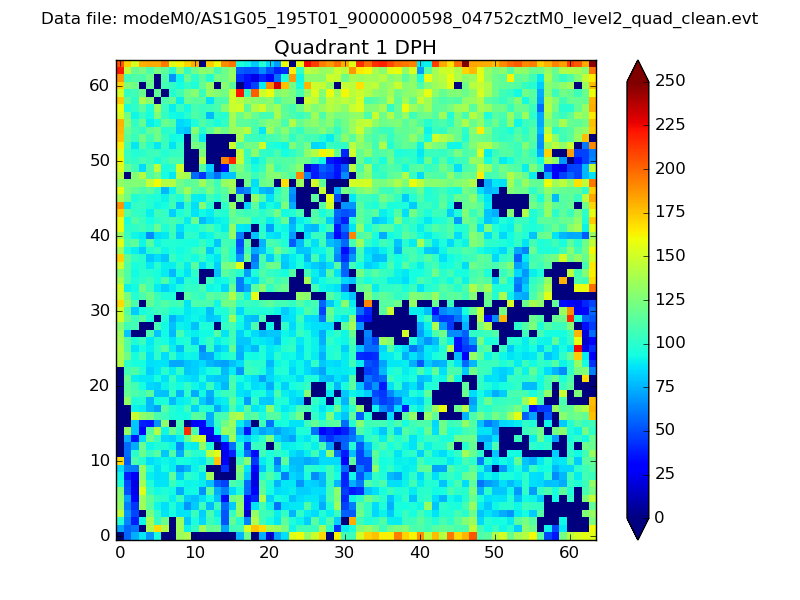 |
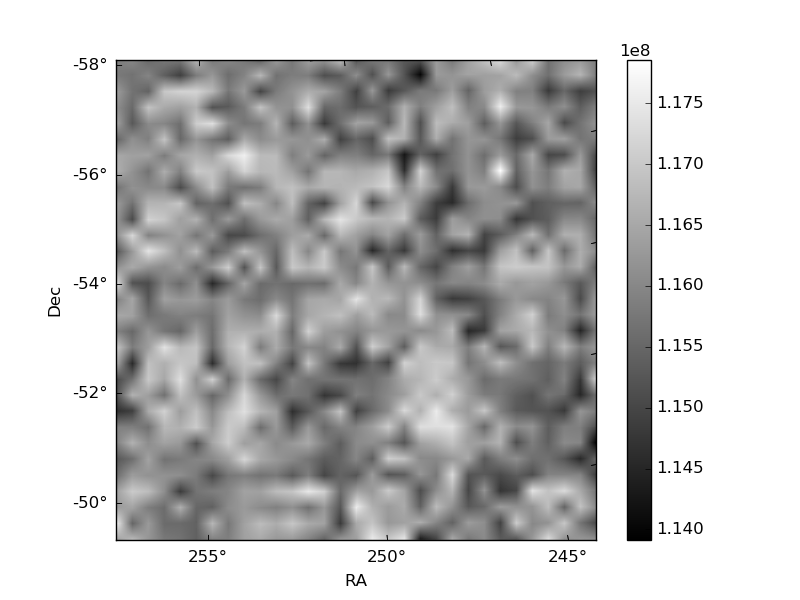
Quadrant B |
|---|---|---|---|
| Quadrant D | 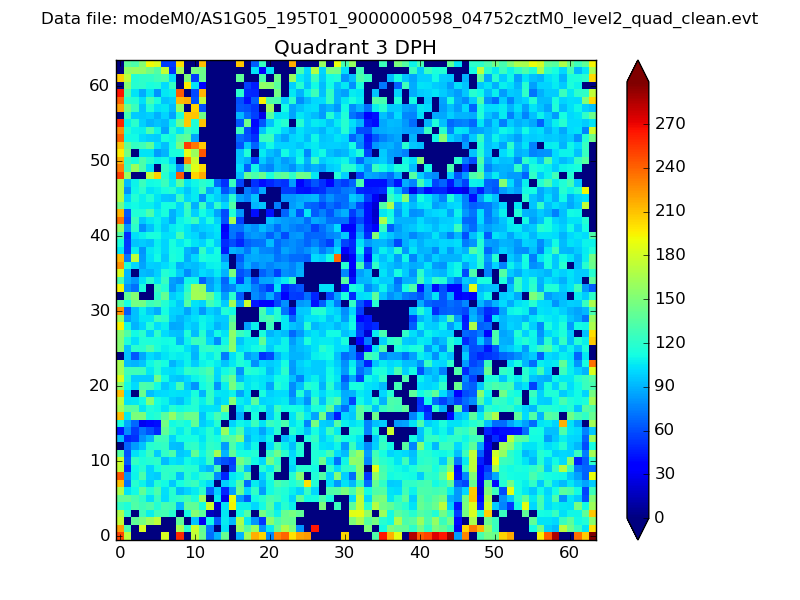 |
 |
Quadrant C |
| Plot type | Count rate plots | Images |
|---|---|---|
| Comparison with Poisson distribution Blue bars denote a histogram of data divided into 1 sec bins. Red curve is a Poisson curve with rate = median count rate of data. |
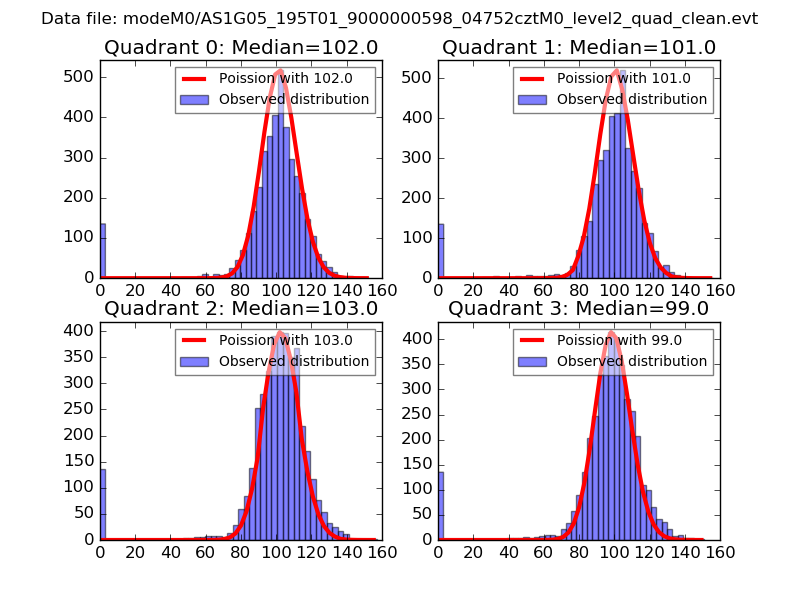 |
 |
| Quadrant-wise count rates Data is divided into 100 sec bins |
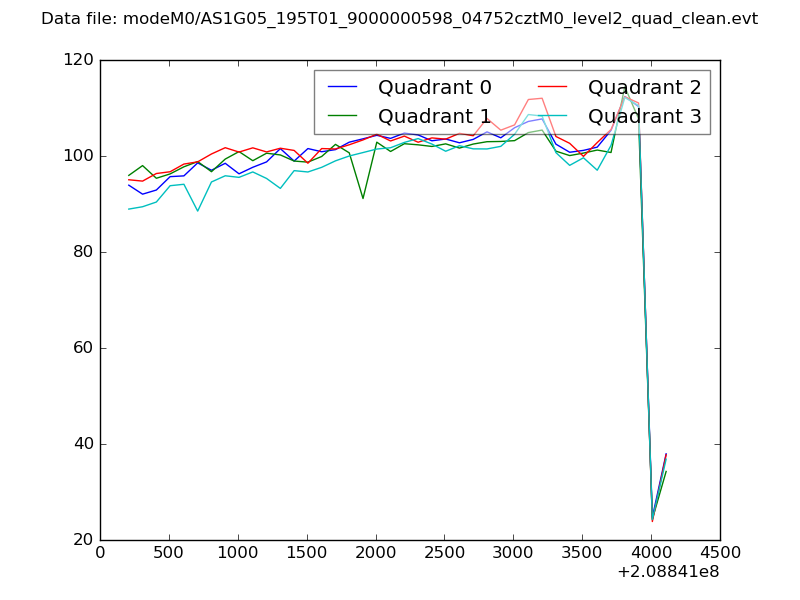 |
|
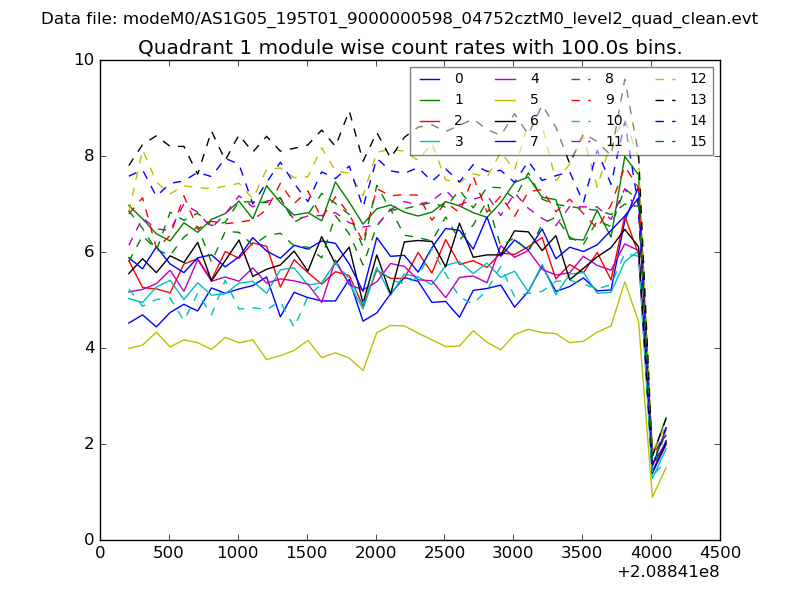
| Module-wise count rates for Quadrant A Data is divided into 100 sec bins |
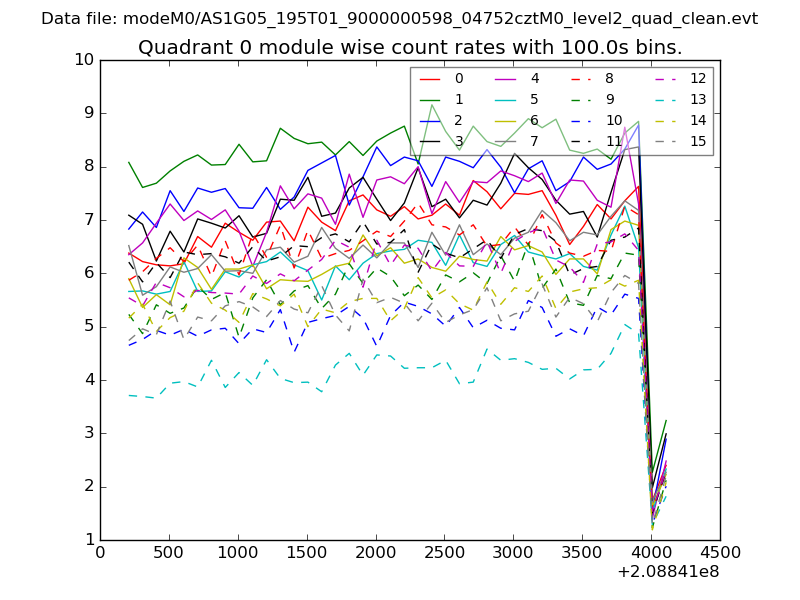 |
 |
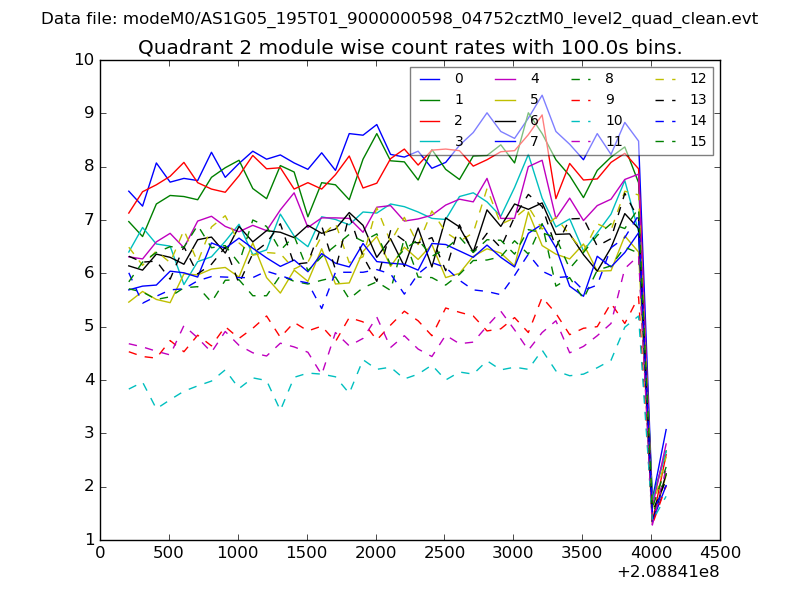
| Module-wise count rates for Quadrant B Data is divided into 100 sec bins |
 |
 |
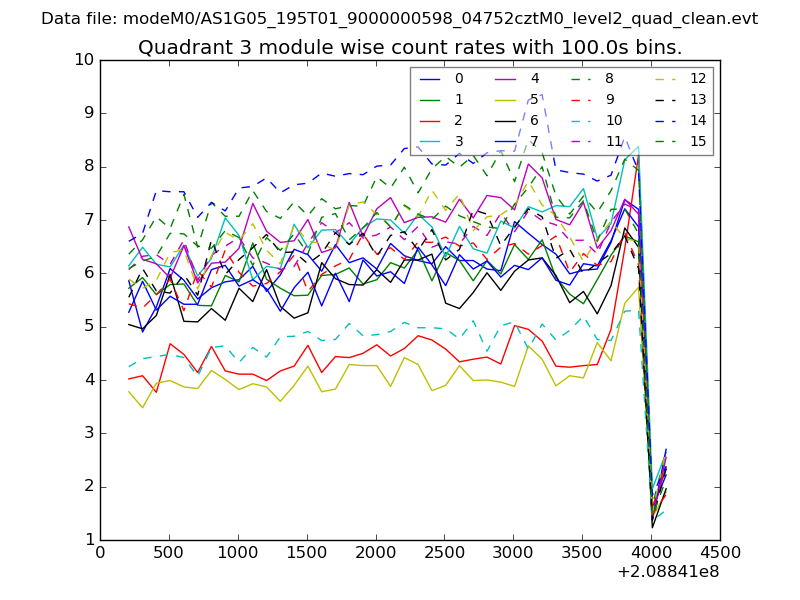
| Module-wise count rates for Quadrant C Data is divided into 100 sec bins |
 |
 |
| Module-wise count rates for Quadrant D Data is divided into 100 sec bins |
 |
 |
| Parameter | Plot |
|---|---|
| CZT HV Monitor | 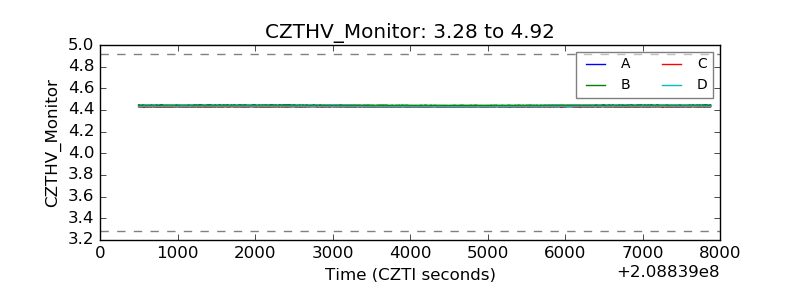 |
| D_VDD | 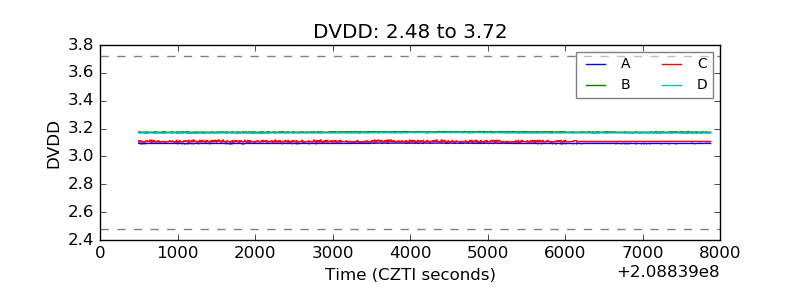 |
| Temperature 1 | 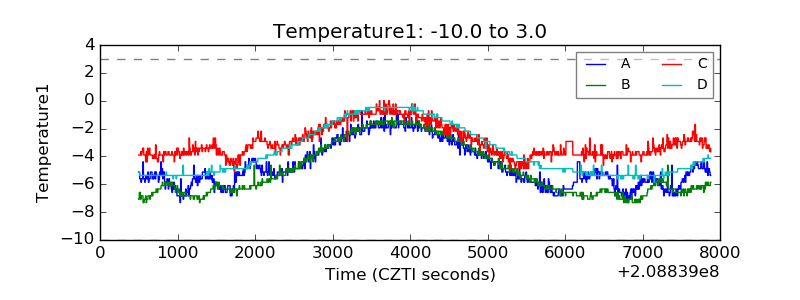 |
| Veto HV Monitor | 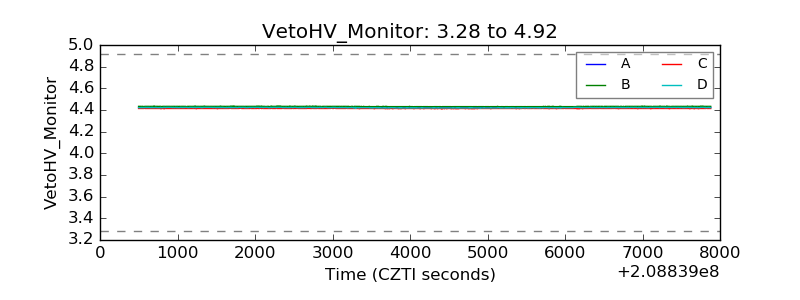 |
| Veto LLD | 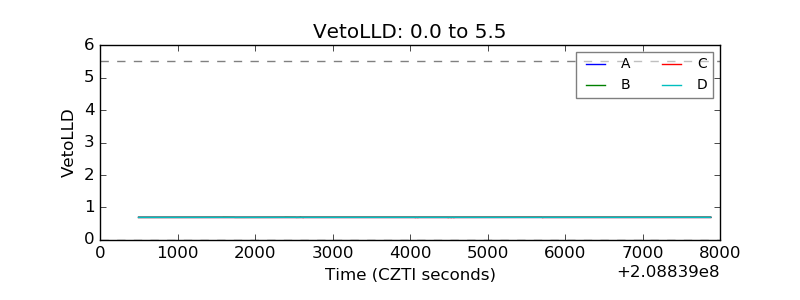 |
| Alpha Counter | 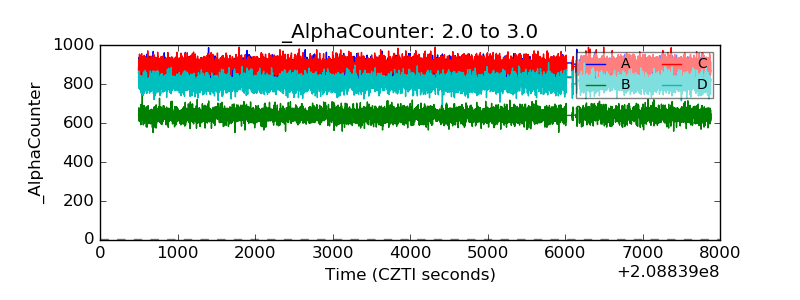 |
| _CPM_Rate | 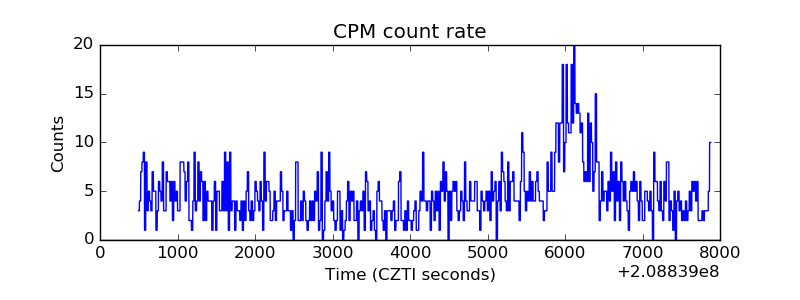 |
| CZT Counter | 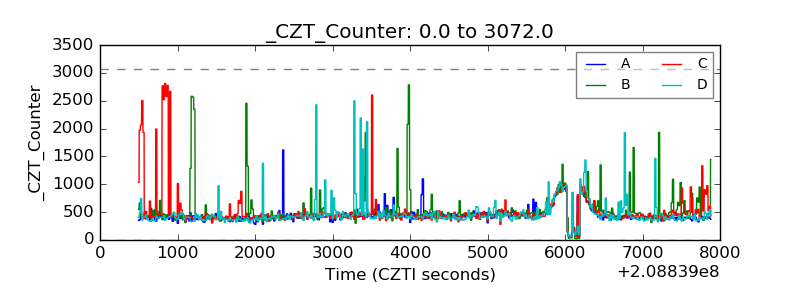 |
| +2.5 Volts monitor |  |
| +5 Volts monitor |  |
| _ROLL_ROT | 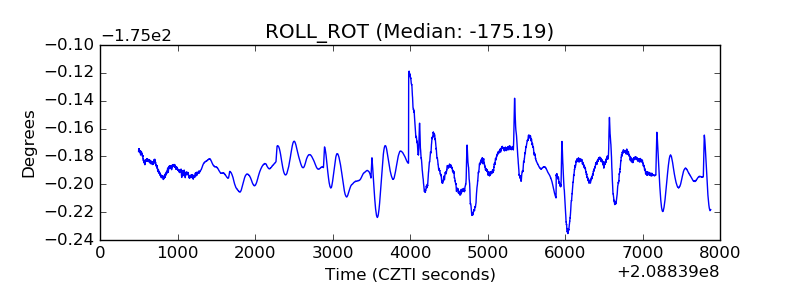 |
| _Roll_DEC | 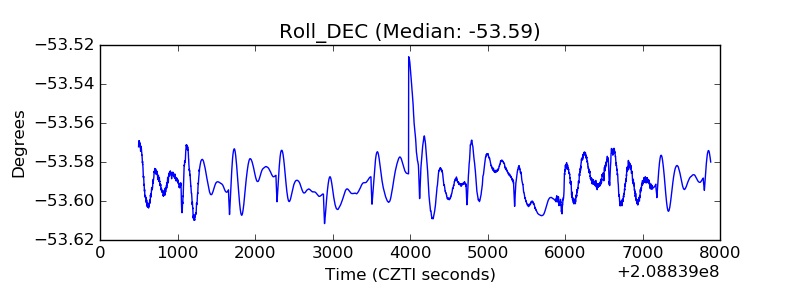 |
| _Roll_RA | 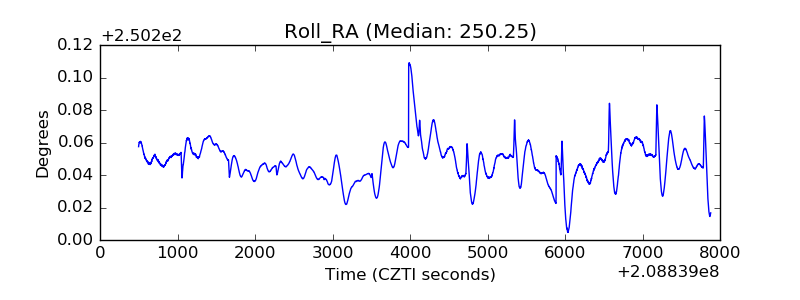 |
| Veto Counter | 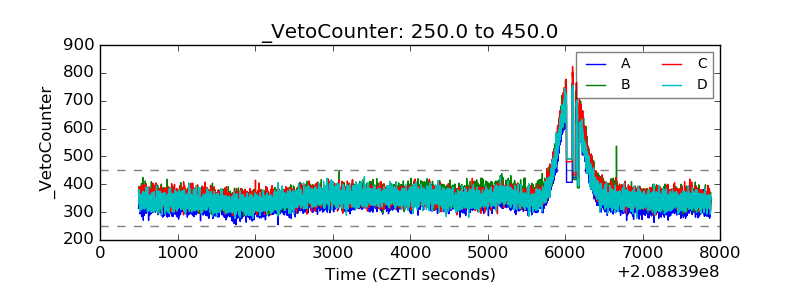 |