| Param | Original file | Final file |
|---|---|---|
| Filename | modeM0/AS1G05_195T01_9000000598_04753cztM0_level2.evt | modeM0/AS1G05_195T01_9000000598_04753cztM0_level2_quad_clean.evt |
| Size (bytes) | 521,530,560 | 71,884,800 |
| Size | 497.4 MB | 68.6 MB |
| Events in quadrant A | 3,113,043 | 425,192 |
| Events in quadrant B | 4,158,916 | 419,428 |
| Events in quadrant C | 4,344,230 | 428,516 |
| Events in quadrant D | 3,693,802 | 406,573 |
| Mode SS | |||
|---|---|---|---|
| Quadrant | BADHDUFLAG | Total packets | Discarded packets |
| A | 0 | 144 | 0 |
| B | 0 | 144 | 0 |
| C | 0 | 144 | 0 |
| D | 0 | 144 | 0 |
| Mode M9 | |||
|---|---|---|---|
| Quadrant | BADHDUFLAG | Total packets | Discarded packets |
| A | 0 | 4 | 0 |
| B | 0 | 4 | 0 |
| C | 0 | 4 | 0 |
| D | 0 | 4 | 0 |
| Mode M0 | |||
|---|---|---|---|
| Quadrant | BADHDUFLAG | Total packets | Discarded packets |
| A | 0 | 14553 | 2 |
| B | 0 | 17141 | 1 |
| C | 0 | 18073 | 1 |
| D | 0 | 16488 | 1 |
| Quadrant | Total seconds | Saturated seconds | Saturation percentage |
|---|---|---|---|
| A | 7138 | 60 | 0.840572% |
| B | 7138 | 213 | 2.984029% |
| C | 7138 | 405 | 5.673858% |
| D | 7138 | 222 | 3.110115% |
Noise dominated data is calculated using 1-second bins in cleaned event files. If a bin has >2000 counts, and if more than 50% of those come from <1% of pixels, then it is considered to be noise-dominated and hence unusable.
| Quadrant | # 1 sec bins | Bins with >0 counts | Bins with >2000 counts | High rate bins dominated by noise | Noise dominated (total time) | Noise dominated (detector-on time) | Marked lightcurve |
|---|---|---|---|---|---|---|---|
| A | 7508 | 7139 | 0 | 0 | 0.00% | 0.00% |  |
| B | 7508 | 7139 | 110 | 110 | 1.47% | 1.54% |  |
| C | 7508 | 7139 | 315 | 315 | 4.20% | 4.41% |  |
| D | 7508 | 7139 | 106 | 106 | 1.41% | 1.48% |  |
Top three noisy pixels from each quadrant. If the there are fewer than three noisy pixels in the level2.evt file, extra rows are filled as -1
| Pixel properties | Quadrant properties | ||||||
|---|---|---|---|---|---|---|---|
| Quadrant | DetID | PixID | Counts | Sigma | Mean | Median | Sigma |
| A | 13 | 251 | 25663 | 150.44 | 799 | 782 | 165.4 |
| A | 0 | 50 | 12136 | 68.65 | 799 | 782 | 165.4 |
| A | 12 | 194 | 8152 | 44.56 | 799 | 782 | 165.4 |
| B | 10 | 16 | 693859 | 4483.21 | 803 | 784 | 154.6 |
| B | 14 | 167 | 172113 | 1108.25 | 803 | 784 | 154.6 |
| B | 4 | 80 | 95503 | 612.7 | 803 | 784 | 154.6 |
| C | 14 | 48 | 1290240 | 7198.53 | 771 | 773 | 179.1 |
| C | 8 | 208 | 24145 | 130.48 | 771 | 773 | 179.1 |
| C | 12 | 4 | 13563 | 71.4 | 771 | 773 | 179.1 |
| D | 13 | 235 | 565100 | 3050.86 | 764 | 737 | 185.0 |
| D | 2 | 136 | 127556 | 685.56 | 764 | 737 | 185.0 |
| D | 13 | 239 | 26845 | 141.13 | 764 | 737 | 185.0 |
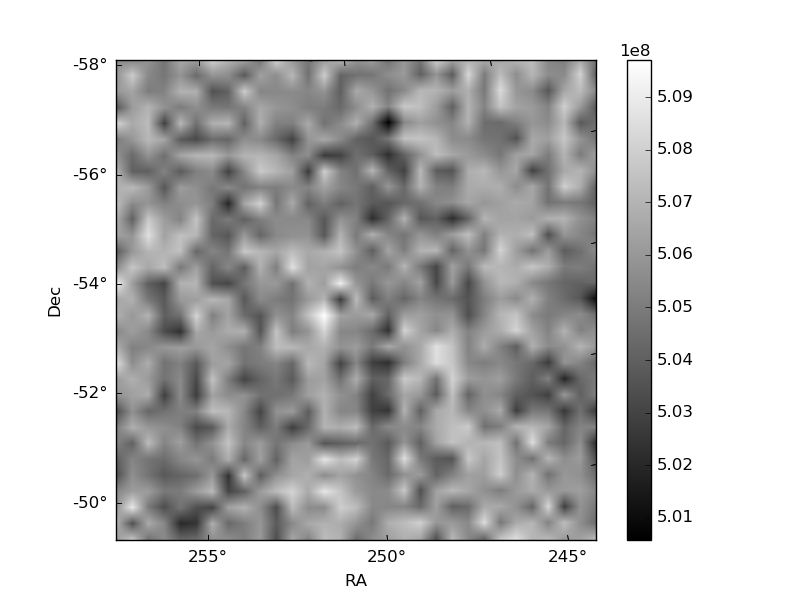
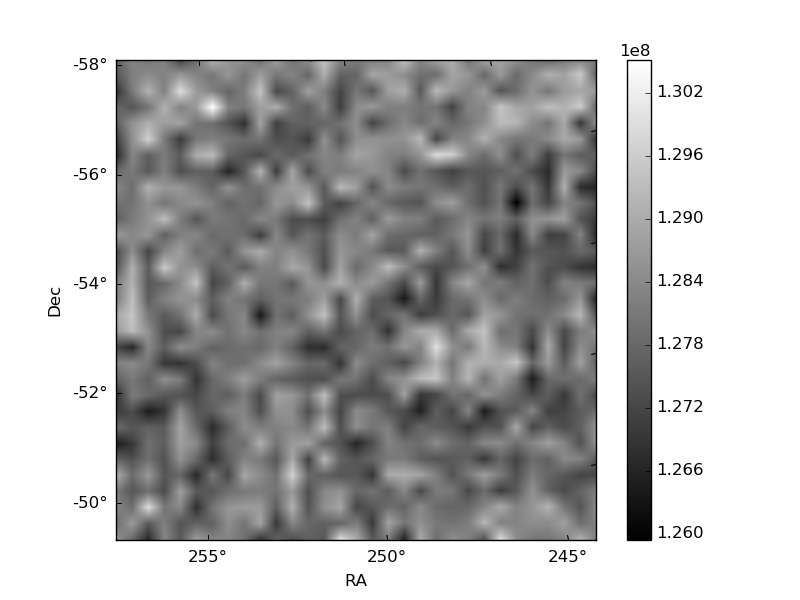
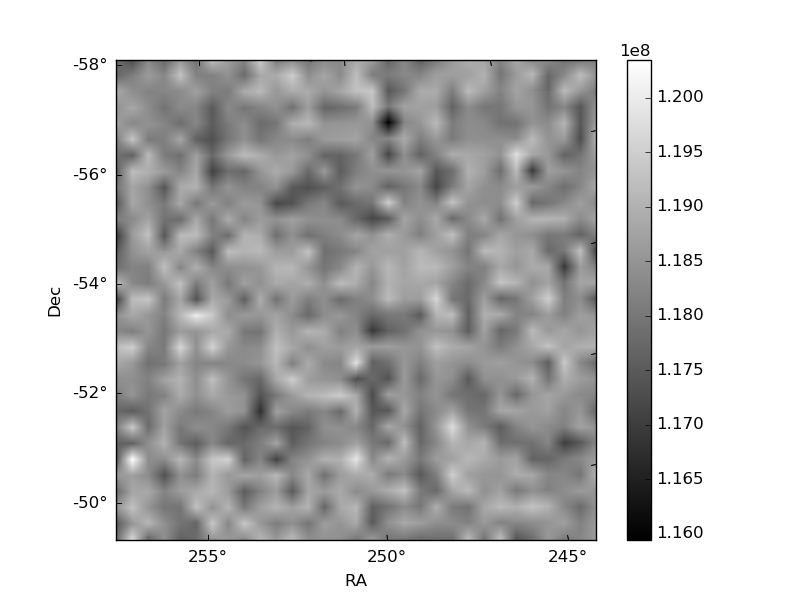
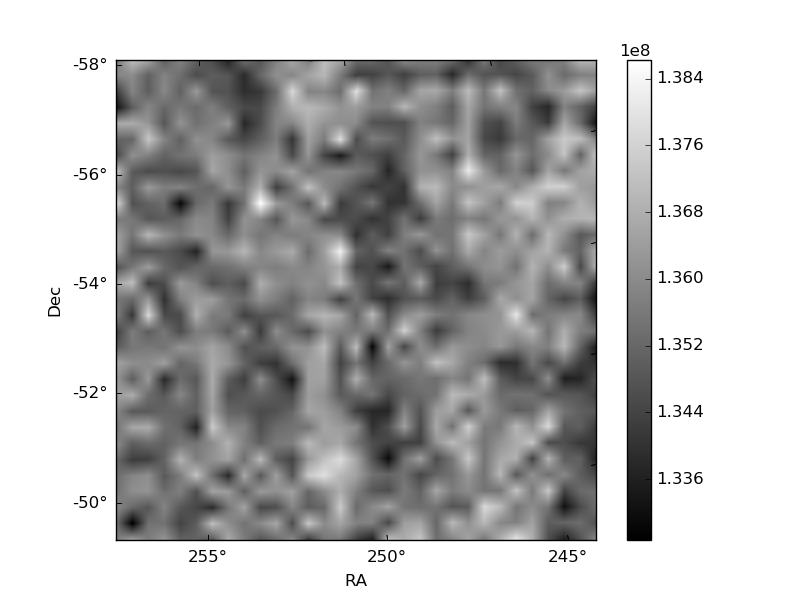
Histogram calculated using DETX and DETY for each event in the final _common_clean file
| Quadrant A | 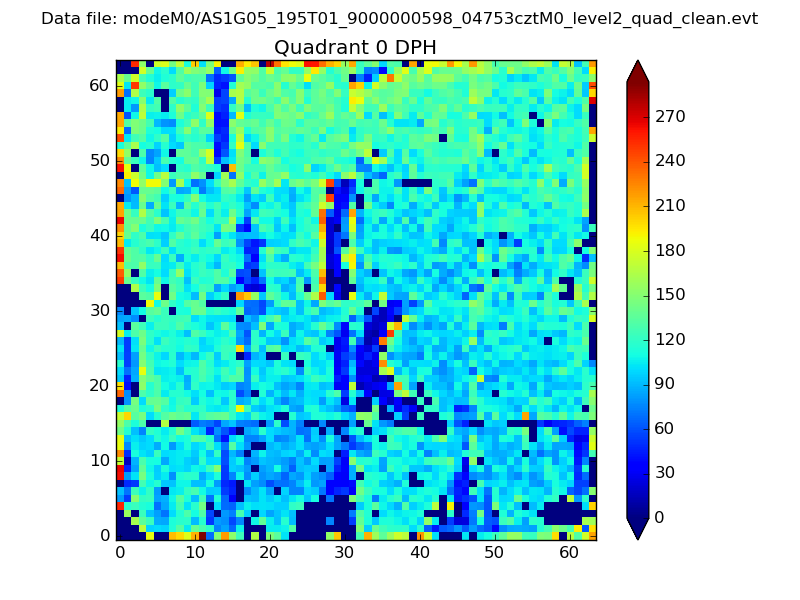 |
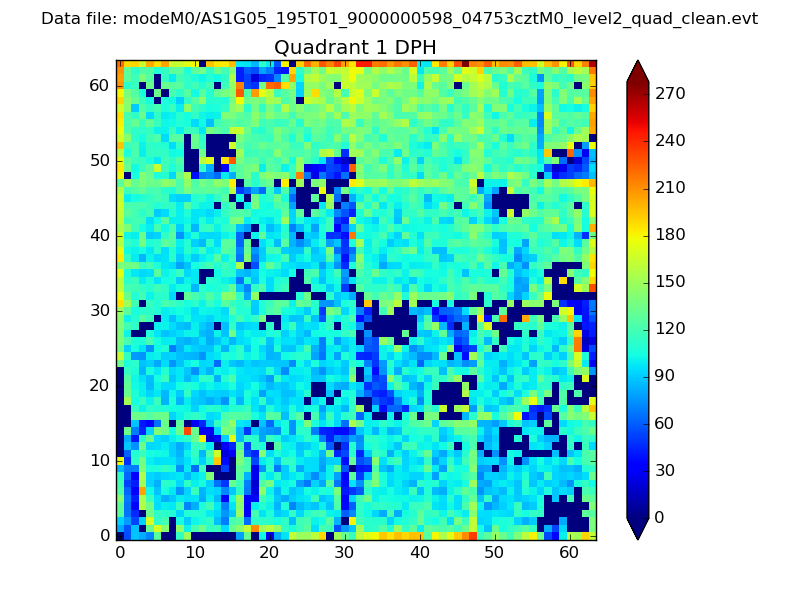 |
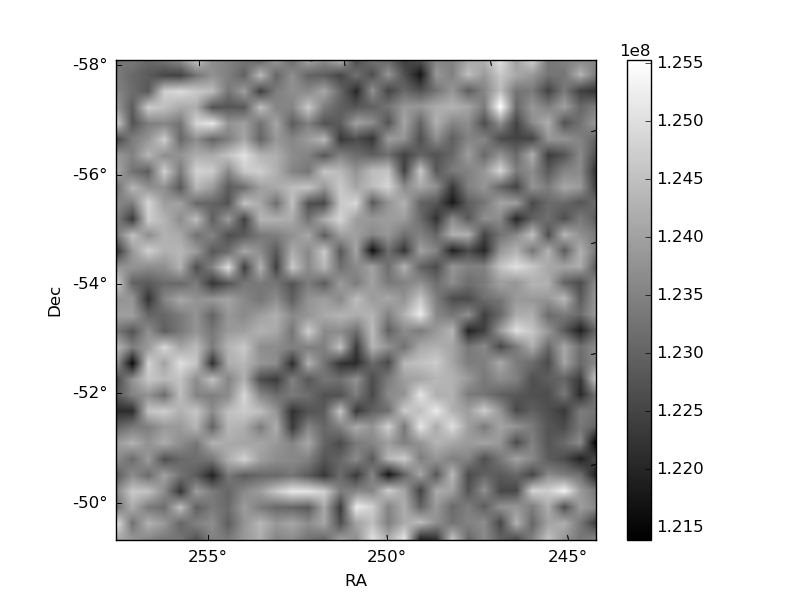
Quadrant B |
|---|---|---|---|
| Quadrant D | 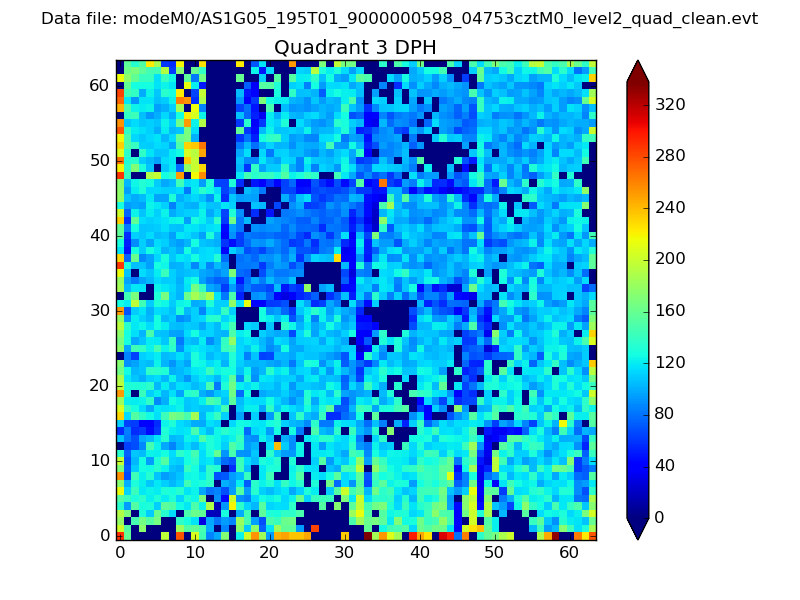 |
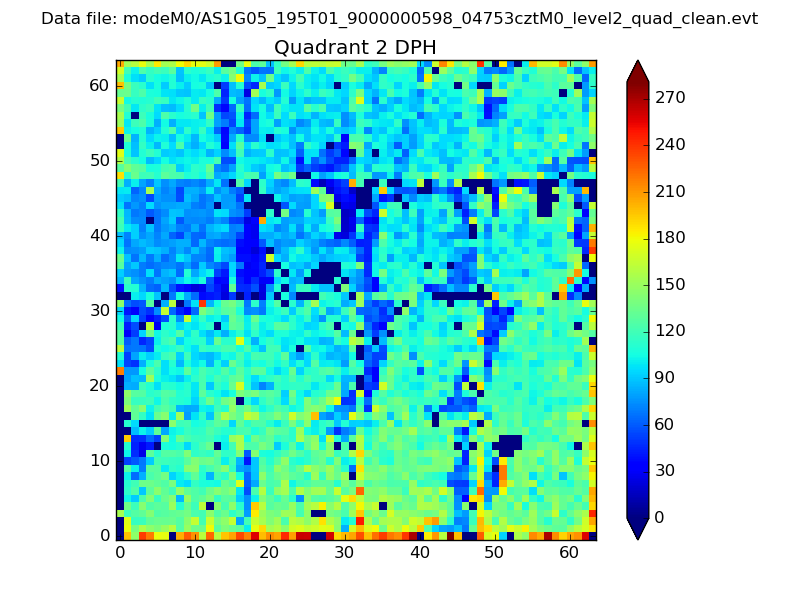 |
Quadrant C |
| Plot type | Count rate plots | Images |
|---|---|---|
| Comparison with Poisson distribution Blue bars denote a histogram of data divided into 1 sec bins. Red curve is a Poisson curve with rate = median count rate of data. |
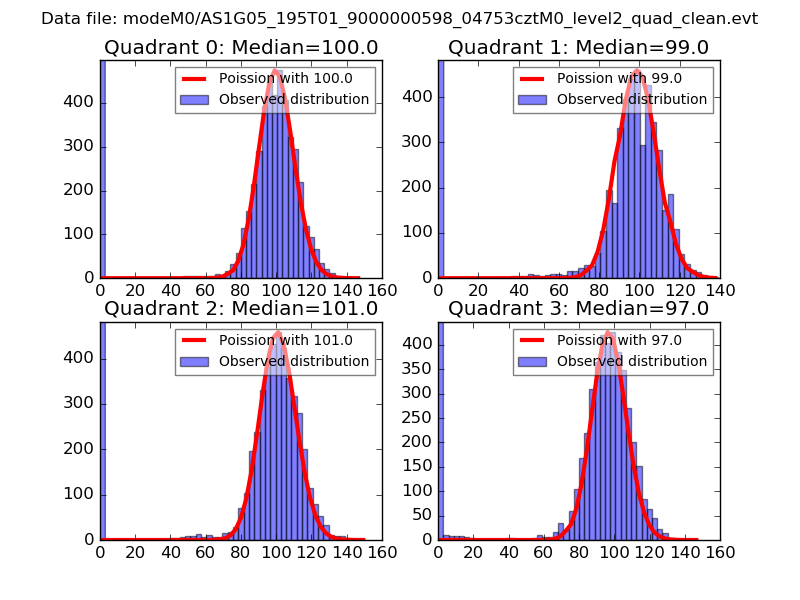 |
 |
| Quadrant-wise count rates Data is divided into 100 sec bins |
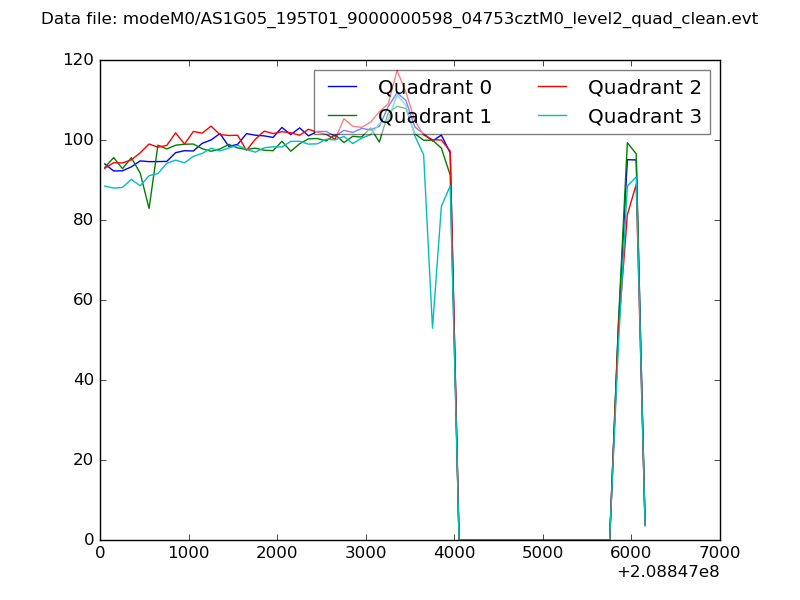 |
|
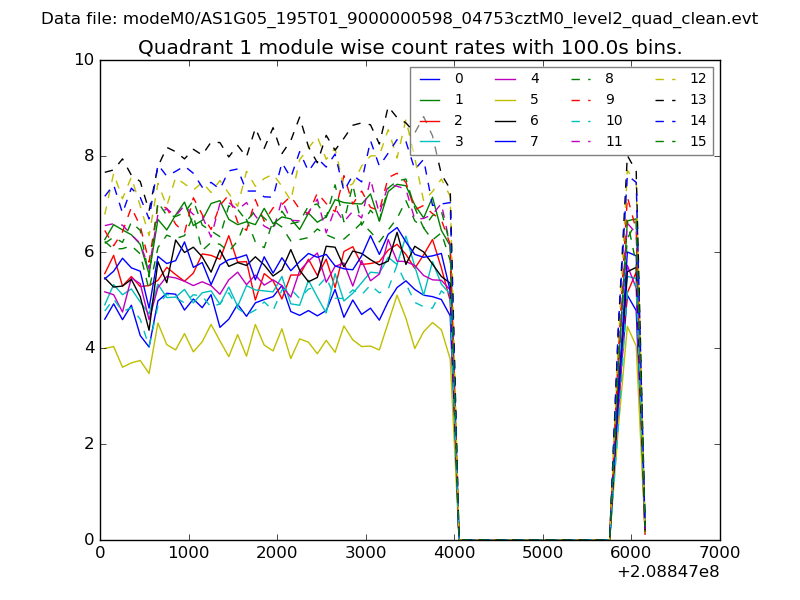
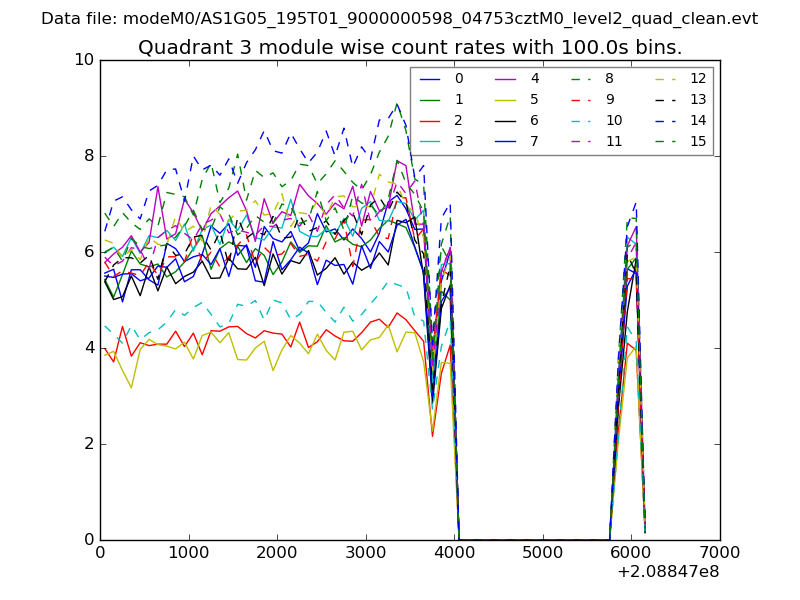
| Module-wise count rates for Quadrant A Data is divided into 100 sec bins |
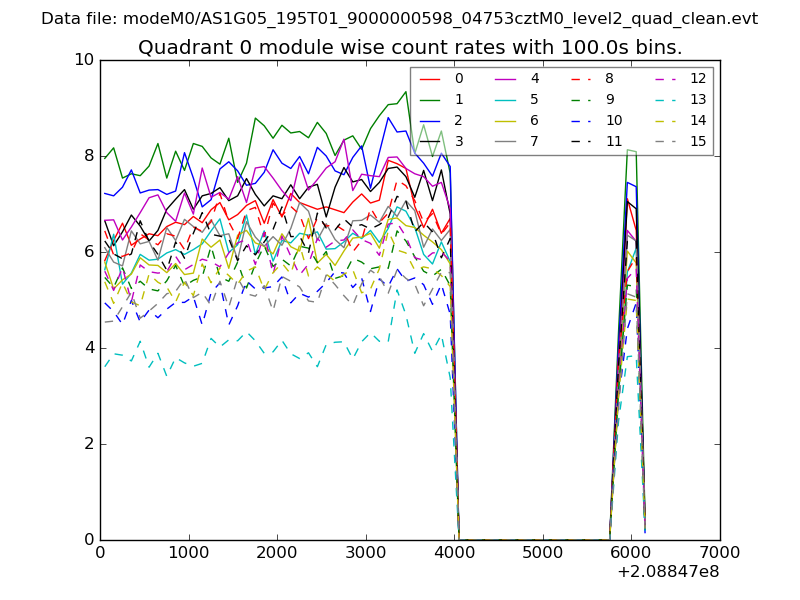 |
 |
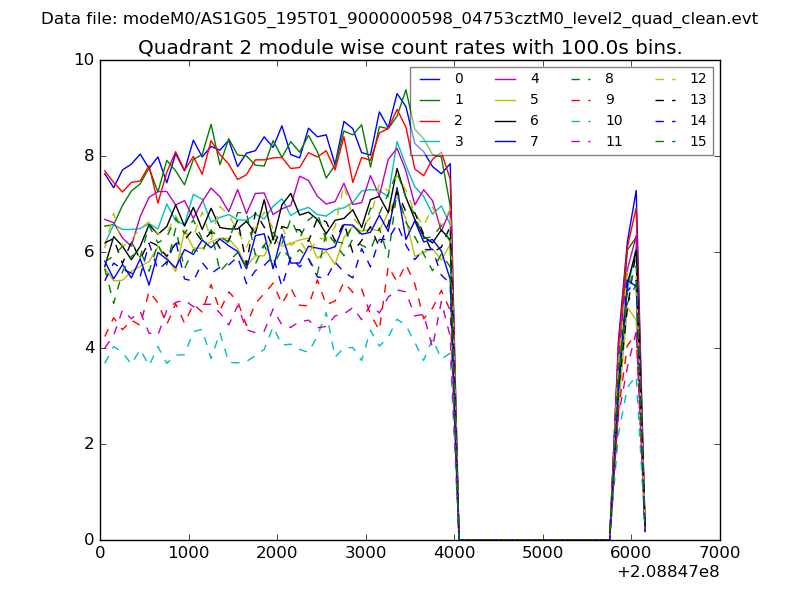
| Module-wise count rates for Quadrant B Data is divided into 100 sec bins |
 |
 |
| Module-wise count rates for Quadrant C Data is divided into 100 sec bins |
 |
 |
| Module-wise count rates for Quadrant D Data is divided into 100 sec bins |
 |
 |
| Parameter | Plot |
|---|---|
| CZT HV Monitor |  |
| D_VDD | 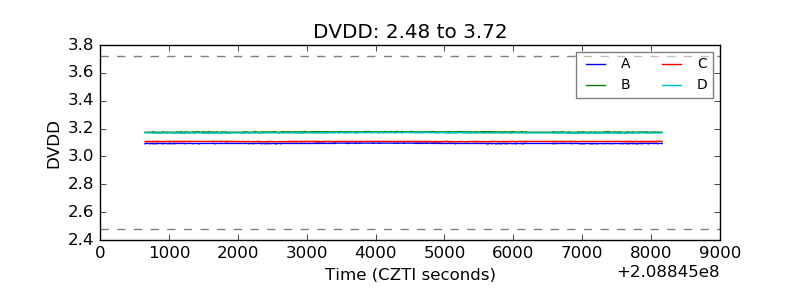 |
| Temperature 1 | 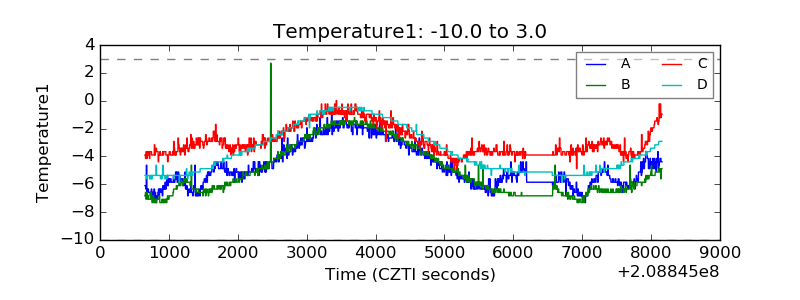 |
| Veto HV Monitor | 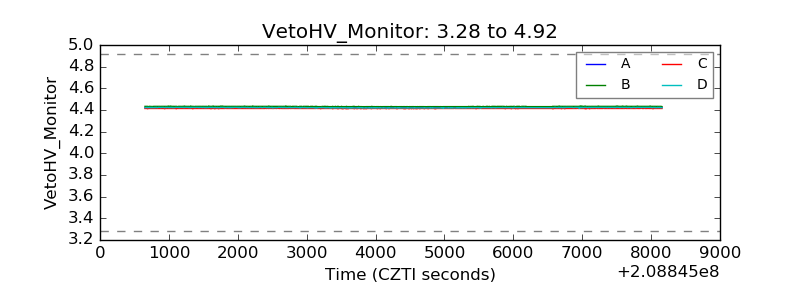 |
| Veto LLD |  |
| Alpha Counter | 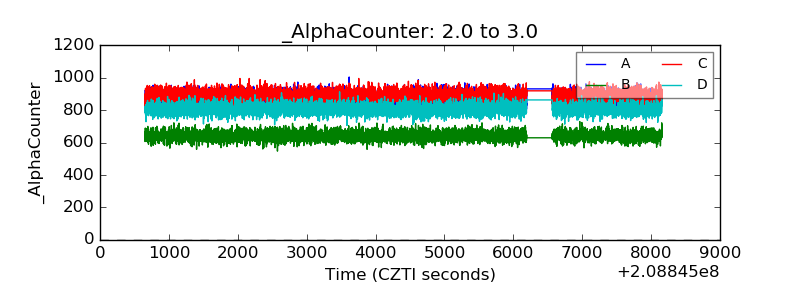 |
| _CPM_Rate | 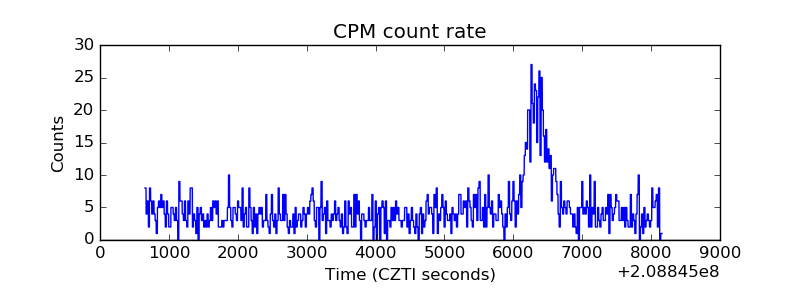 |
| CZT Counter | 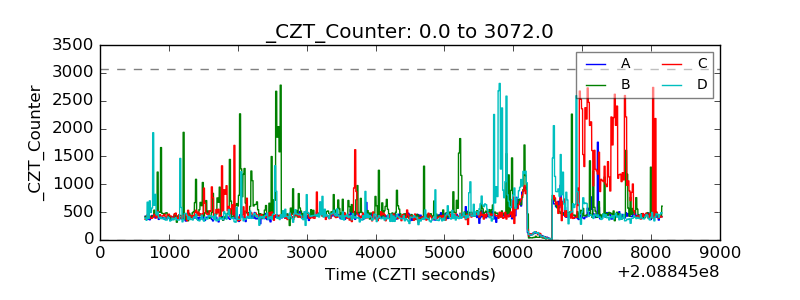 |
| +2.5 Volts monitor |  |
| +5 Volts monitor |  |
| _ROLL_ROT | 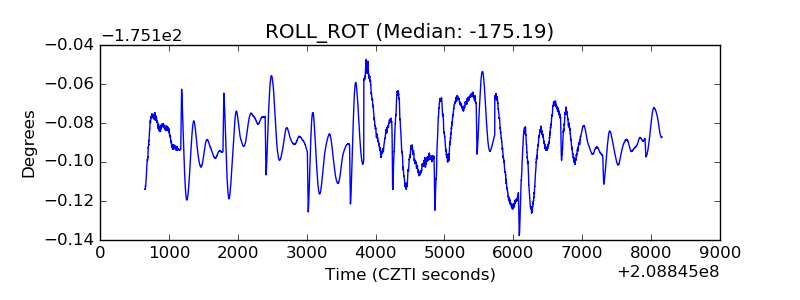 |
| _Roll_DEC | 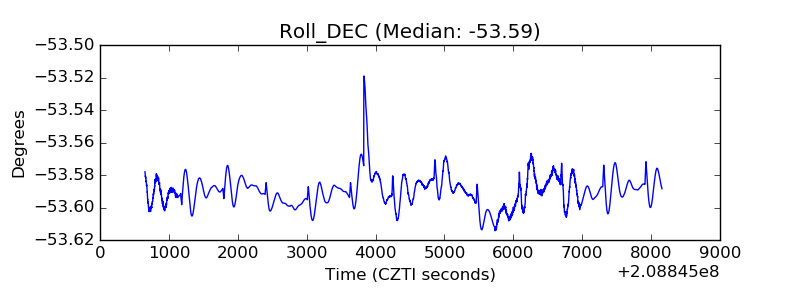 |
| _Roll_RA | 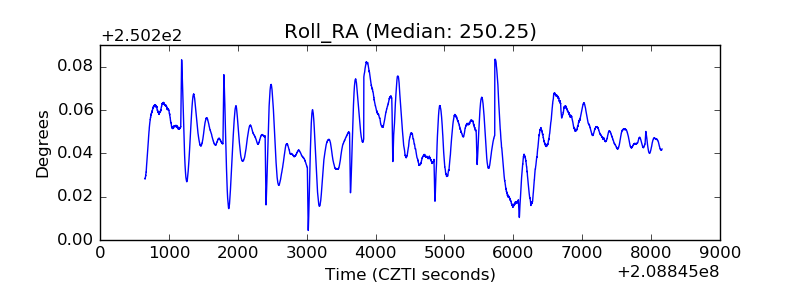 |
| Veto Counter | 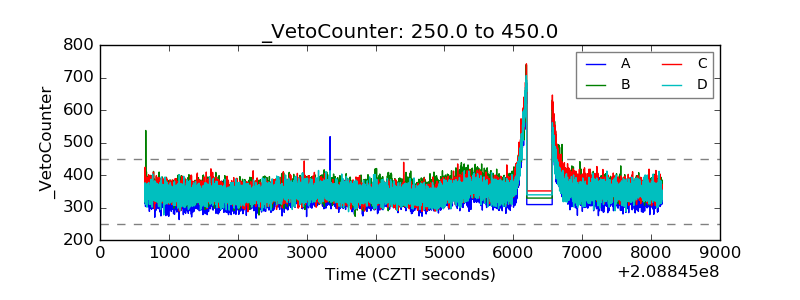 |