| Param | Original file | Final file |
|---|---|---|
| Filename | modeM0/AS1G05_195T01_9000000598_04755cztM0_level2.evt | modeM0/AS1G05_195T01_9000000598_04755cztM0_level2_quad_clean.evt |
| Size (bytes) | 568,241,280 | 109,284,480 |
| Size | 541.9 MB | 104.2 MB |
| Events in quadrant A | 3,811,629 | 682,242 |
| Events in quadrant B | 4,366,771 | 674,296 |
| Events in quadrant C | 4,213,129 | 688,519 |
| Events in quadrant D | 4,224,604 | 658,340 |
| Mode SS | |||
|---|---|---|---|
| Quadrant | BADHDUFLAG | Total packets | Discarded packets |
| A | 0 | 176 | 0 |
| B | 0 | 176 | 0 |
| C | 0 | 176 | 2 |
| D | 0 | 176 | 0 |
| Mode M9 | |||
|---|---|---|---|
| Quadrant | BADHDUFLAG | Total packets | Discarded packets |
| A | 0 | 5 | 0 |
| B | 0 | 5 | 0 |
| C | 0 | 5 | 0 |
| D | 0 | 5 | 0 |
| Mode M0 | |||
|---|---|---|---|
| Quadrant | BADHDUFLAG | Total packets | Discarded packets |
| A | 0 | 17812 | 92 |
| B | 0 | 19011 | 115 |
| C | 0 | 19103 | 98 |
| D | 0 | 19319 | 166 |
| Quadrant | Total seconds | Saturated seconds | Saturation percentage |
|---|---|---|---|
| A | 8746 | 88 | 1.006174% |
| B | 8735 | 167 | 1.911849% |
| C | 8742 | 240 | 2.745367% |
| D | 8722 | 131 | 1.501949% |
Noise dominated data is calculated using 1-second bins in cleaned event files. If a bin has >2000 counts, and if more than 50% of those come from <1% of pixels, then it is considered to be noise-dominated and hence unusable.
| Quadrant | # 1 sec bins | Bins with >0 counts | Bins with >2000 counts | High rate bins dominated by noise | Noise dominated (total time) | Noise dominated (detector-on time) | Marked lightcurve |
|---|---|---|---|---|---|---|---|
| A | 9271 | 8778 | 0 | 0 | 0.00% | 0.00% | 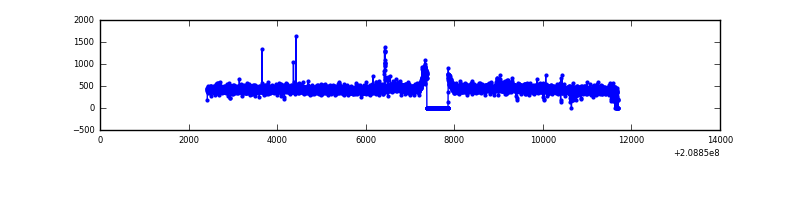 |
| B | 9271 | 8776 | 54 | 54 | 0.58% | 0.62% | 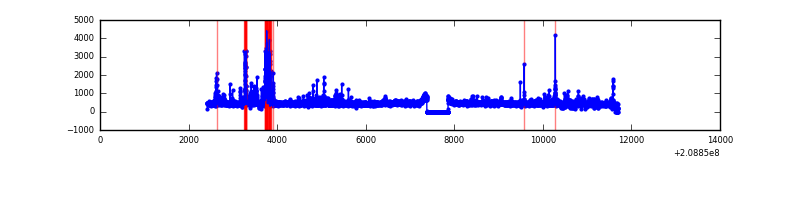 |
| C | 9271 | 8785 | 149 | 149 | 1.61% | 1.70% | 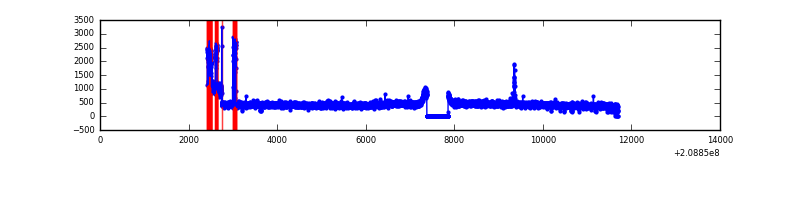 |
| D | 9269 | 8764 | 34 | 34 | 0.37% | 0.39% | 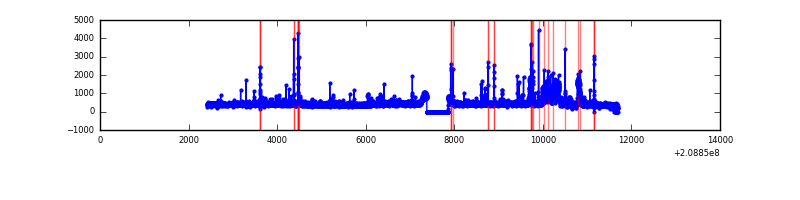 |
Top three noisy pixels from each quadrant. If the there are fewer than three noisy pixels in the level2.evt file, extra rows are filled as -1
| Pixel properties | Quadrant properties | ||||||
|---|---|---|---|---|---|---|---|
| Quadrant | DetID | PixID | Counts | Sigma | Mean | Median | Sigma |
| A | 13 | 251 | 31062 | 149.08 | 978 | 954 | 202.0 |
| A | 15 | 174 | 10542 | 47.48 | 978 | 954 | 202.0 |
| A | 12 | 194 | 10009 | 44.84 | 978 | 954 | 202.0 |
| B | 10 | 16 | 321126 | 1691.45 | 979 | 953 | 189.3 |
| B | 14 | 167 | 136875 | 718.06 | 979 | 953 | 189.3 |
| B | 4 | 80 | 48665 | 252.06 | 979 | 953 | 189.3 |
| C | 14 | 48 | 469146 | 2135.05 | 943 | 945 | 219.3 |
| C | 12 | 4 | 24370 | 106.82 | 943 | 945 | 219.3 |
| C | 7 | 247 | 17080 | 73.58 | 943 | 945 | 219.3 |
| D | 11 | 132 | 214160 | 925.61 | 943 | 912 | 230.4 |
| D | 10 | 15 | 148806 | 641.94 | 943 | 912 | 230.4 |
| D | 13 | 235 | 92483 | 397.47 | 943 | 912 | 230.4 |
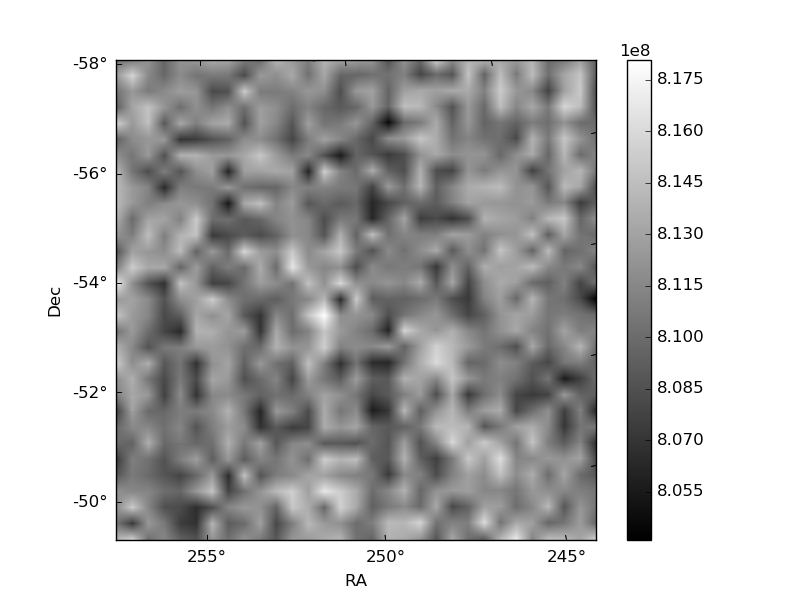
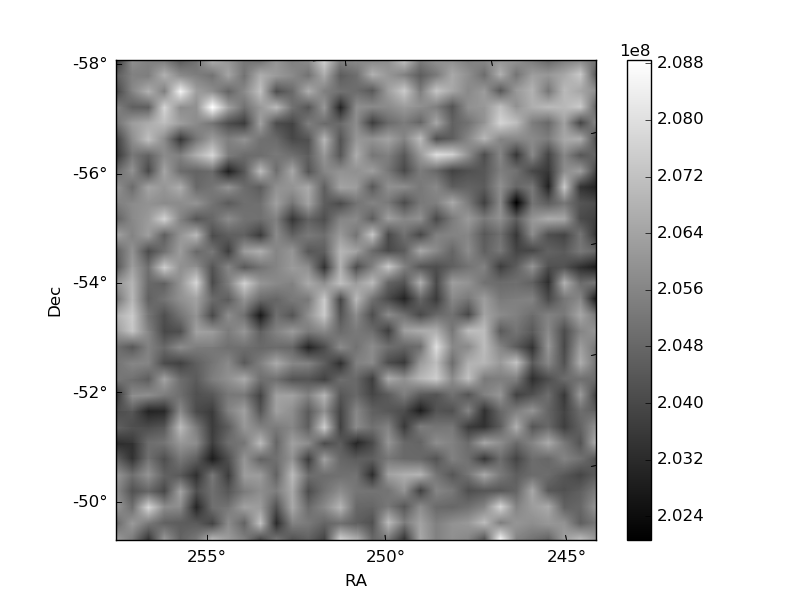
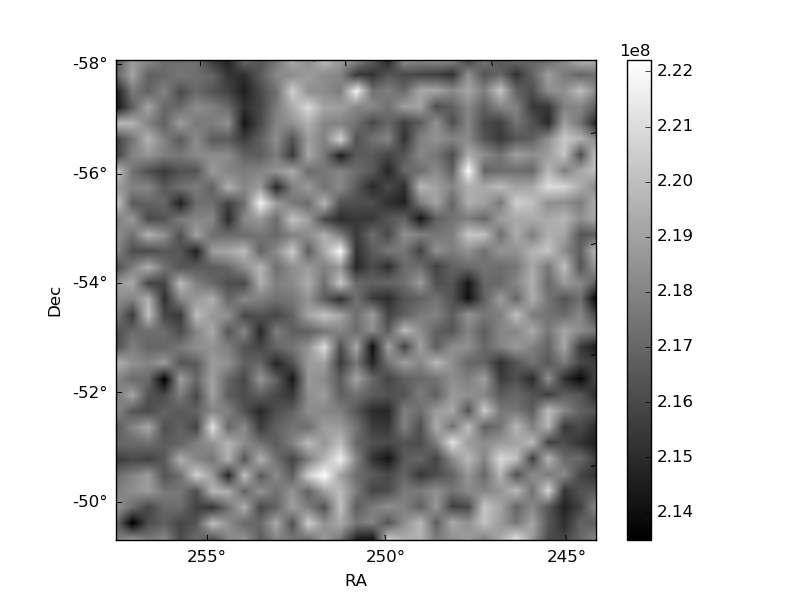
Histogram calculated using DETX and DETY for each event in the final _common_clean file
| Quadrant A | 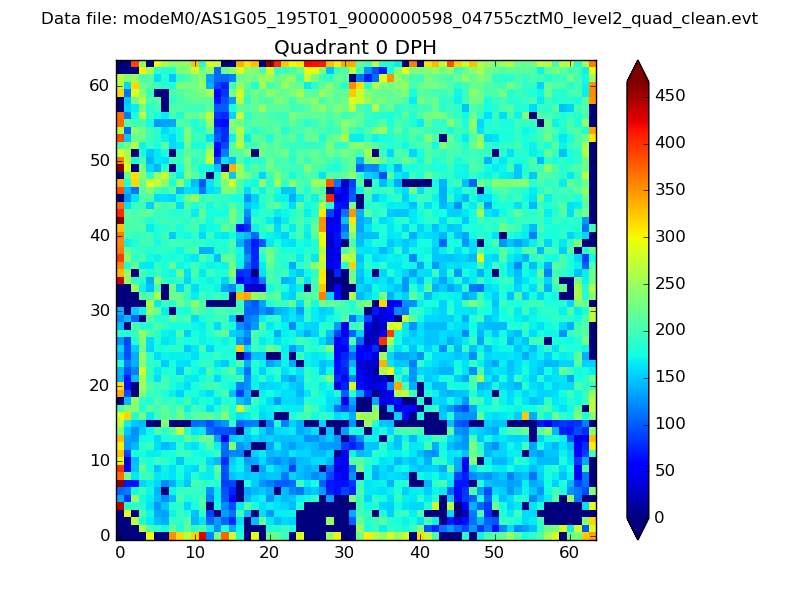 |
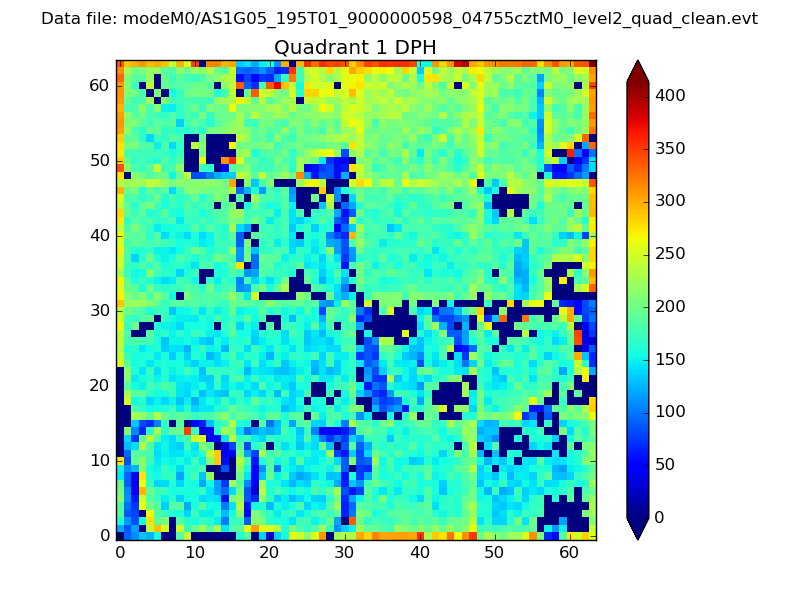 |
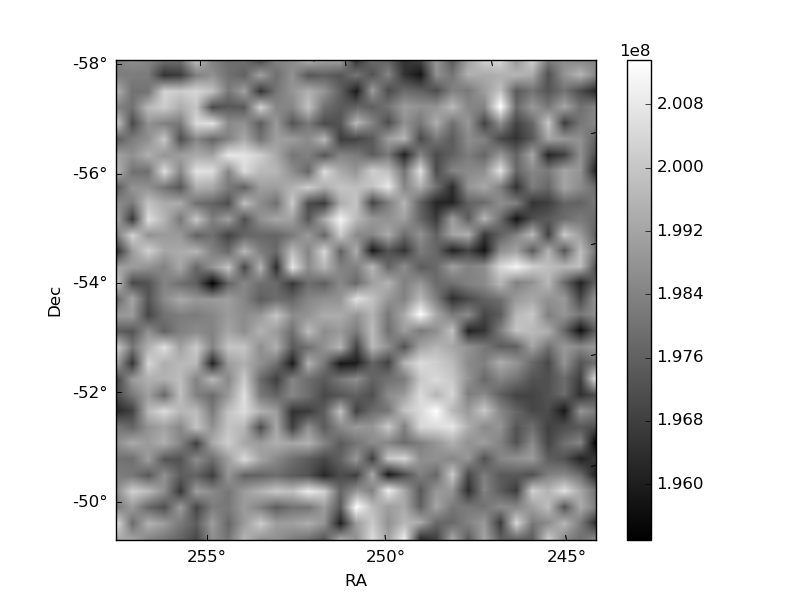
Quadrant B |
|---|---|---|---|
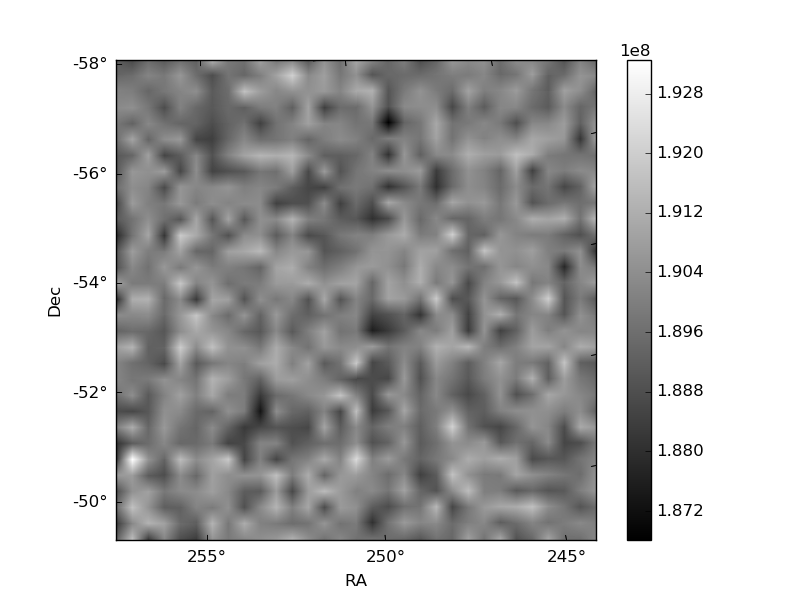
| Quadrant D | 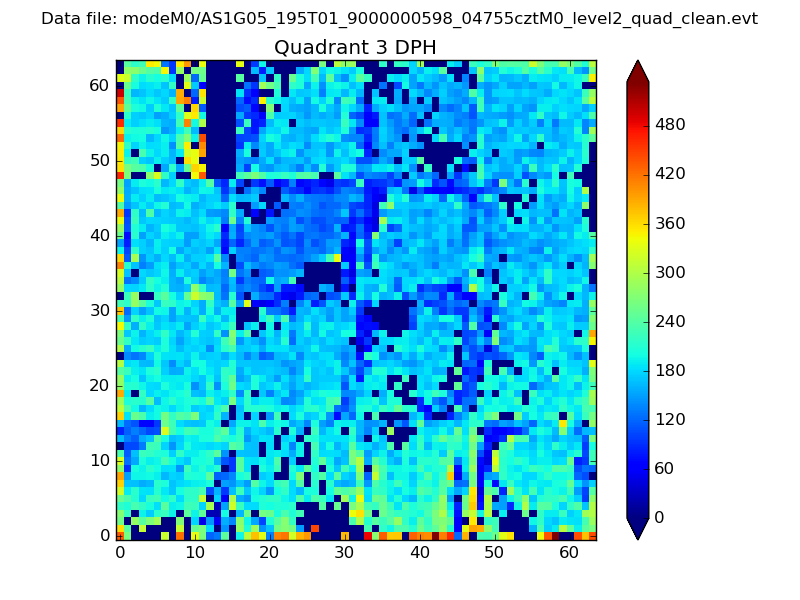 |
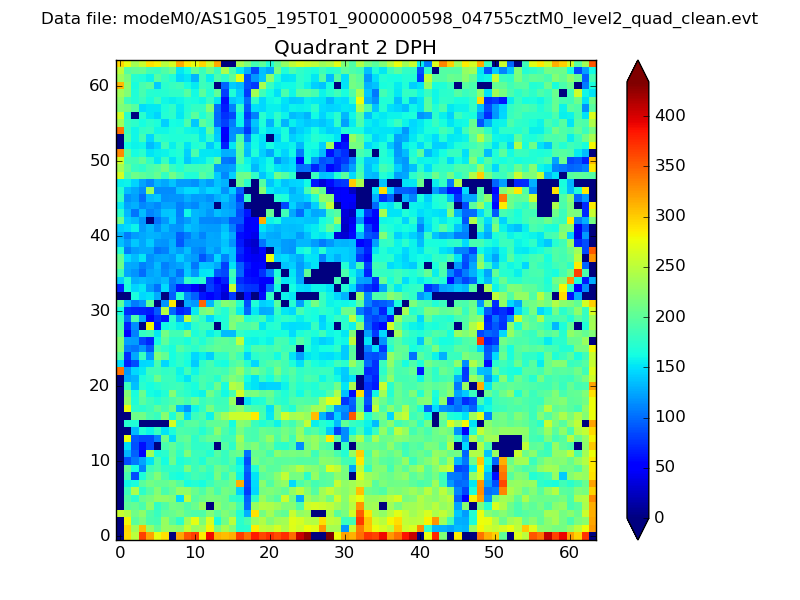 |
Quadrant C |
| Plot type | Count rate plots | Images |
|---|---|---|
| Comparison with Poisson distribution Blue bars denote a histogram of data divided into 1 sec bins. Red curve is a Poisson curve with rate = median count rate of data. |
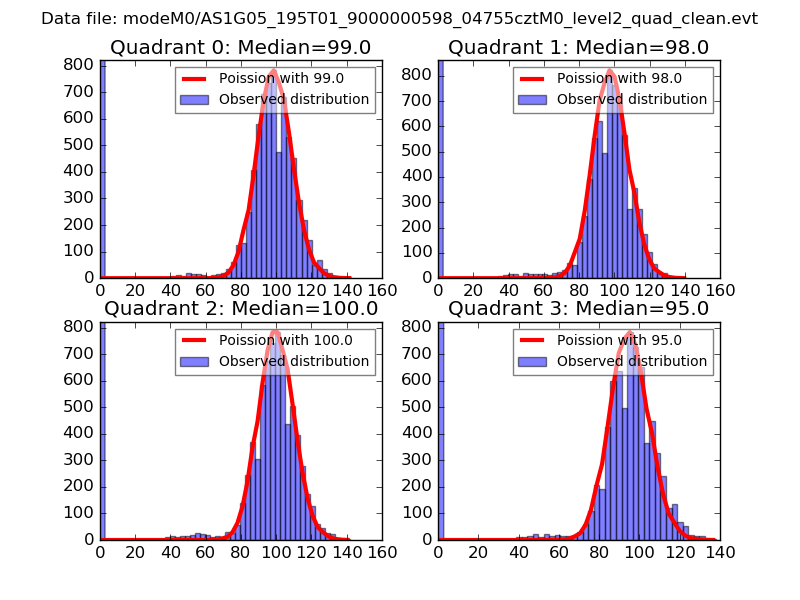 |
 |
| Quadrant-wise count rates Data is divided into 100 sec bins |
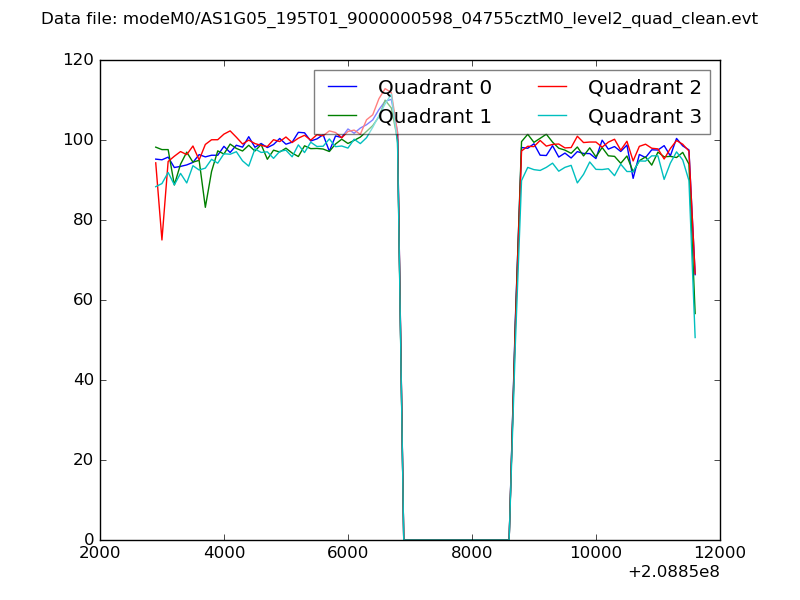 |
|
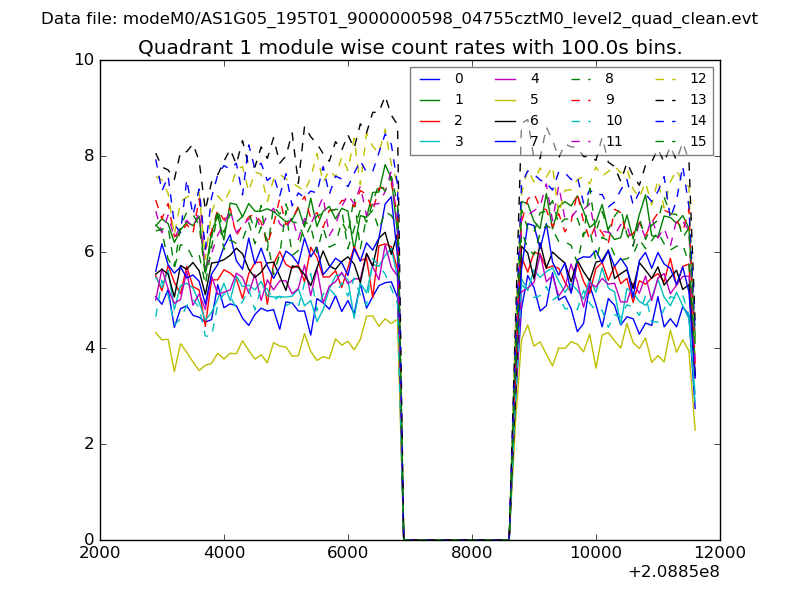
| Module-wise count rates for Quadrant A Data is divided into 100 sec bins |
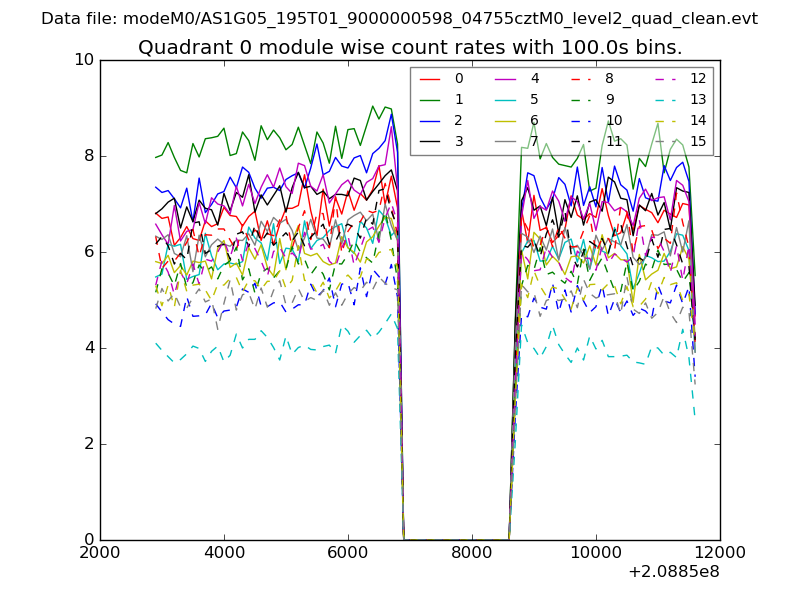 |
 |
| Module-wise count rates for Quadrant B Data is divided into 100 sec bins |
 |
 |
| Module-wise count rates for Quadrant C Data is divided into 100 sec bins |
 |
 |
| Module-wise count rates for Quadrant D Data is divided into 100 sec bins |
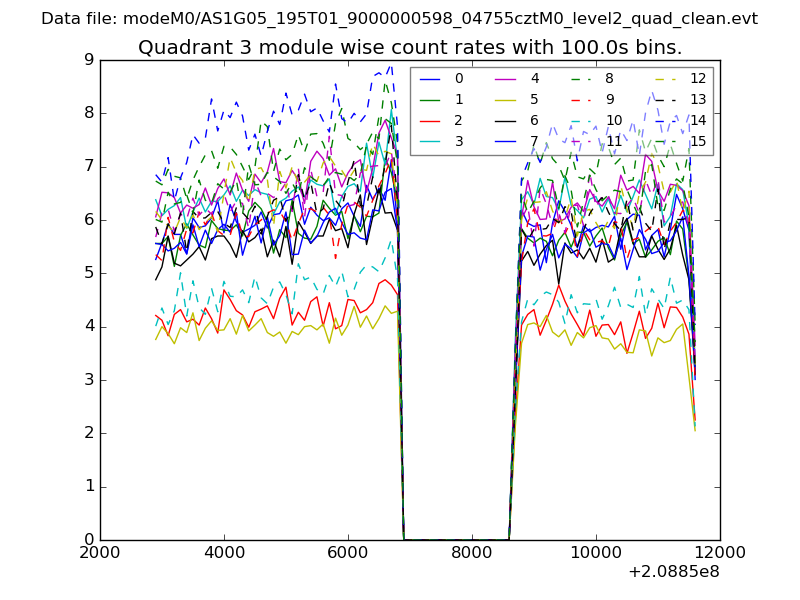 |
 |
| Parameter | Plot |
|---|---|
| CZT HV Monitor | 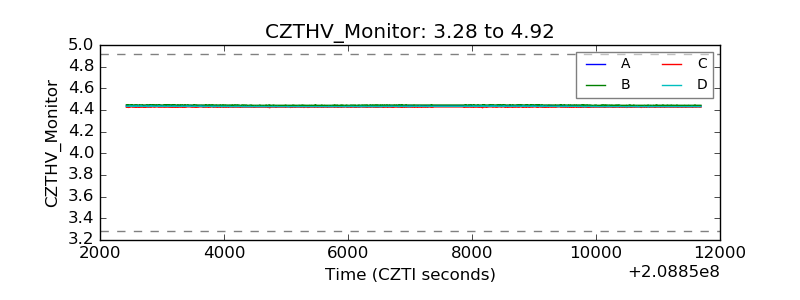 |
| D_VDD | 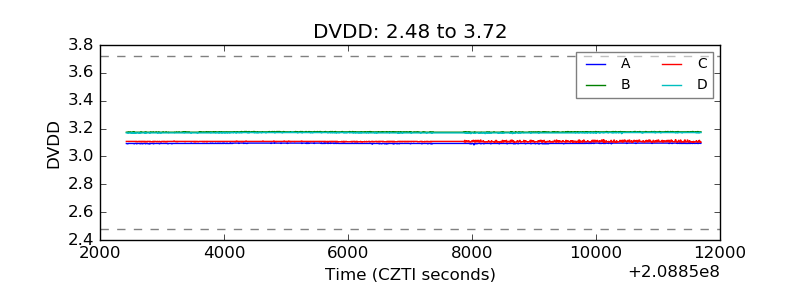 |
| Temperature 1 | 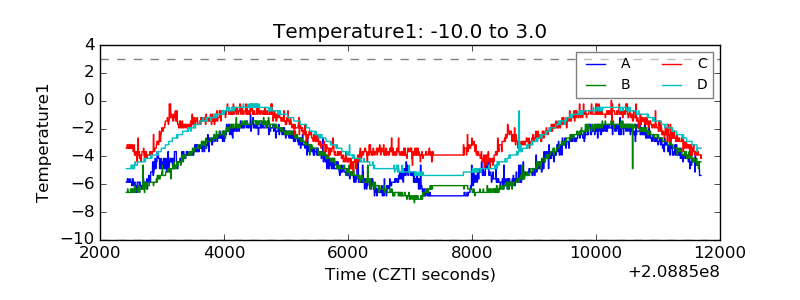 |
| Veto HV Monitor | 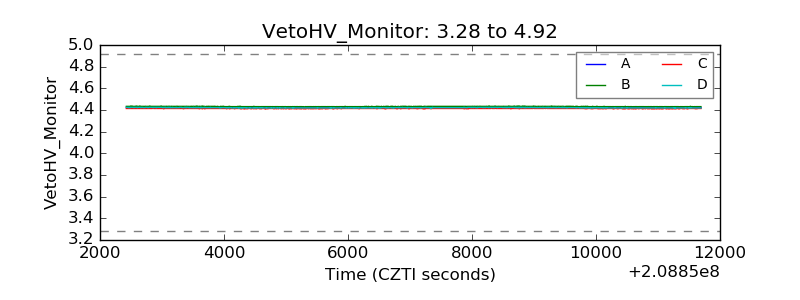 |
| Veto LLD | 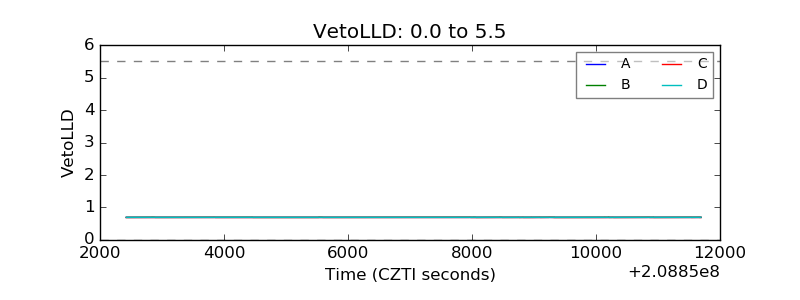 |
| Alpha Counter | 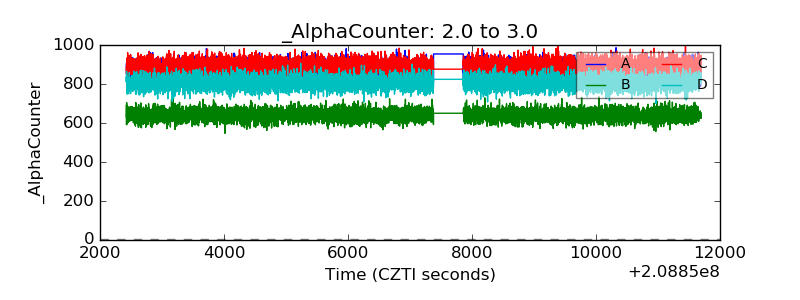 |
| _CPM_Rate | 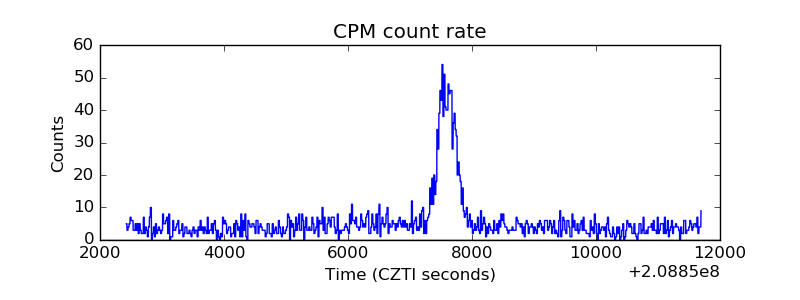 |
| CZT Counter | 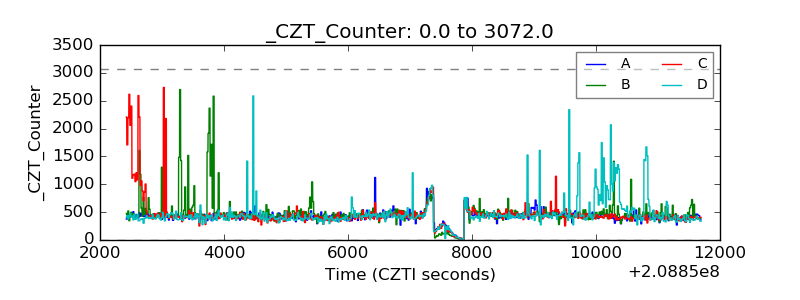 |
| +2.5 Volts monitor |  |
| +5 Volts monitor |  |
| _ROLL_ROT | 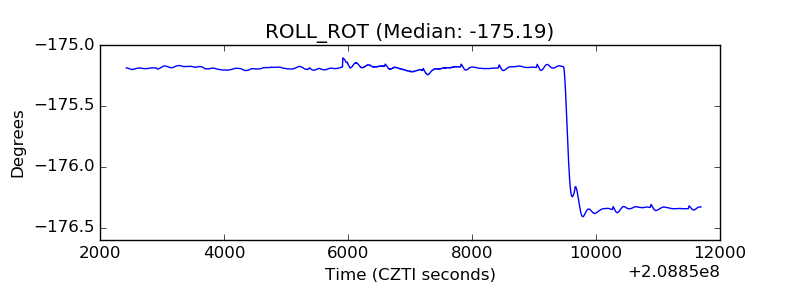 |
| _Roll_DEC | 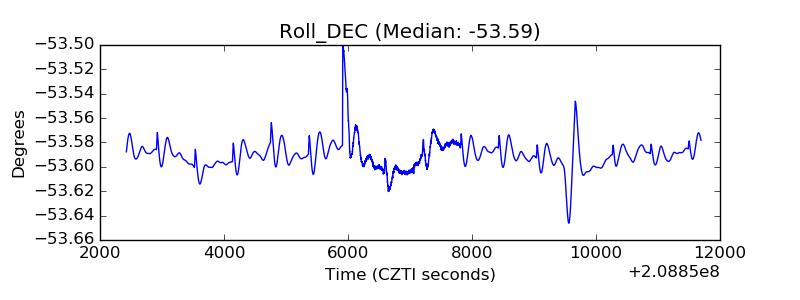 |
| _Roll_RA | 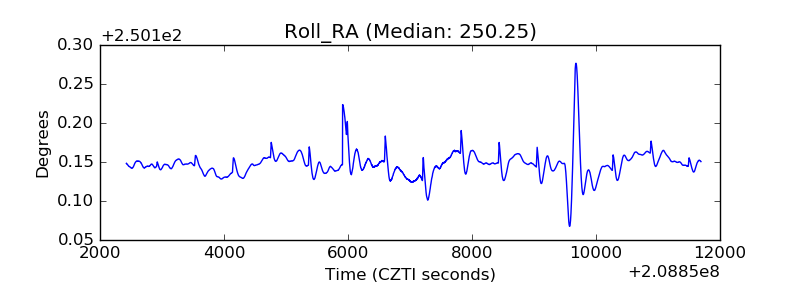 |
| Veto Counter | 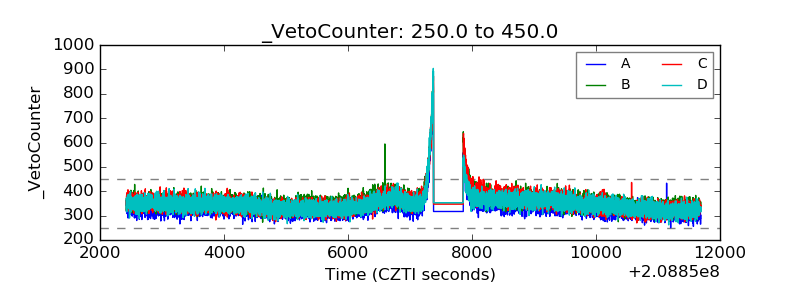 |