| Param | Original file | Final file |
|---|---|---|
| Filename | modeM0/AS1G05_195T01_9000000598_04757cztM0_level2.evt | modeM0/AS1G05_195T01_9000000598_04757cztM0_level2_quad_clean.evt |
| Size (bytes) | 472,798,080 | 91,033,920 |
| Size | 450.9 MB | 86.8 MB |
| Events in quadrant A | 3,110,268 | 575,570 |
| Events in quadrant B | 3,460,885 | 573,788 |
| Events in quadrant C | 3,285,469 | 576,934 |
| Events in quadrant D | 3,996,283 | 552,669 |
| Mode SS | |||
|---|---|---|---|
| Quadrant | BADHDUFLAG | Total packets | Discarded packets |
| A | 0 | 138 | 0 |
| B | 0 | 138 | 0 |
| C | 0 | 138 | 0 |
| D | 0 | 138 | 0 |
| Mode M9 | |||
|---|---|---|---|
| Quadrant | BADHDUFLAG | Total packets | Discarded packets |
| A | 0 | 10 | 0 |
| B | 0 | 10 | 0 |
| C | 0 | 10 | 0 |
| D | 0 | 10 | 0 |
| Mode M0 | |||
|---|---|---|---|
| Quadrant | BADHDUFLAG | Total packets | Discarded packets |
| A | 0 | 14001 | 2 |
| B | 0 | 14818 | 1 |
| C | 0 | 14380 | 1 |
| D | 0 | 16674 | 1 |
| Quadrant | Total seconds | Saturated seconds | Saturation percentage |
|---|---|---|---|
| A | 6862 | 65 | 0.947246% |
| B | 6862 | 63 | 0.918100% |
| C | 6862 | 58 | 0.845235% |
| D | 6862 | 137 | 1.996502% |
Noise dominated data is calculated using 1-second bins in cleaned event files. If a bin has >2000 counts, and if more than 50% of those come from <1% of pixels, then it is considered to be noise-dominated and hence unusable.
| Quadrant | # 1 sec bins | Bins with >0 counts | Bins with >2000 counts | High rate bins dominated by noise | Noise dominated (total time) | Noise dominated (detector-on time) | Marked lightcurve |
|---|---|---|---|---|---|---|---|
| A | 7827 | 6862 | 0 | 0 | 0.00% | 0.00% | 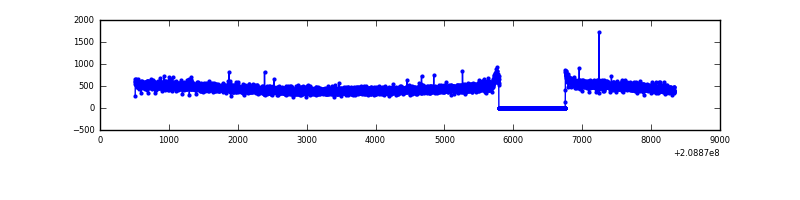 |
| B | 7827 | 6863 | 3 | 3 | 0.04% | 0.04% | 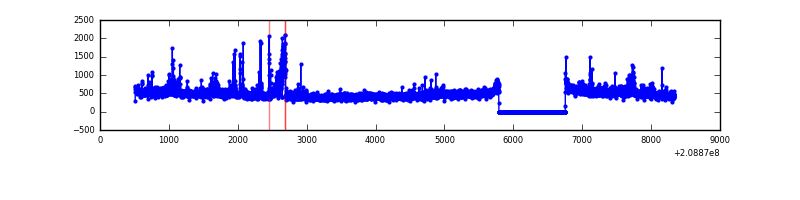 |
| C | 7827 | 6863 | 7 | 7 | 0.09% | 0.10% | 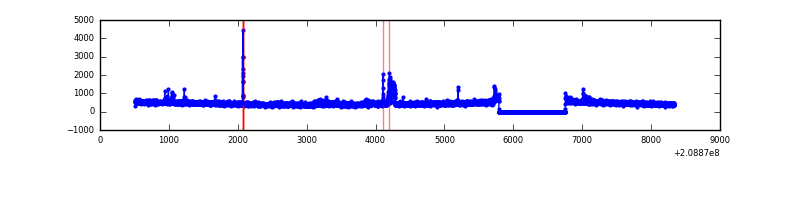 |
| D | 7827 | 6862 | 71 | 71 | 0.91% | 1.03% | 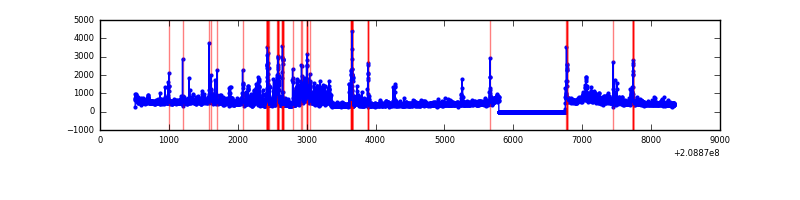 |
Top three noisy pixels from each quadrant. If the there are fewer than three noisy pixels in the level2.evt file, extra rows are filled as -1
| Pixel properties | Quadrant properties | ||||||
|---|---|---|---|---|---|---|---|
| Quadrant | DetID | PixID | Counts | Sigma | Mean | Median | Sigma |
| A | 13 | 251 | 9419 | 51.99 | 805 | 786 | 166.0 |
| A | 0 | 226 | 8212 | 44.73 | 805 | 786 | 166.0 |
| A | 12 | 194 | 8048 | 43.74 | 805 | 786 | 166.0 |
| B | 14 | 167 | 139249 | 892.06 | 805 | 786 | 155.2 |
| B | 15 | 204 | 76434 | 487.37 | 805 | 786 | 155.2 |
| B | 15 | 54 | 38225 | 241.2 | 805 | 786 | 155.2 |
| C | 14 | 48 | 160580 | 889.47 | 773 | 775 | 179.7 |
| C | 7 | 189 | 73145 | 402.81 | 773 | 775 | 179.7 |
| C | 12 | 4 | 19220 | 102.66 | 773 | 775 | 179.7 |
| D | 11 | 132 | 480508 | 2559.9 | 773 | 749 | 187.4 |
| D | 2 | 234 | 132594 | 703.5 | 773 | 749 | 187.4 |
| D | 2 | 136 | 127642 | 677.08 | 773 | 749 | 187.4 |
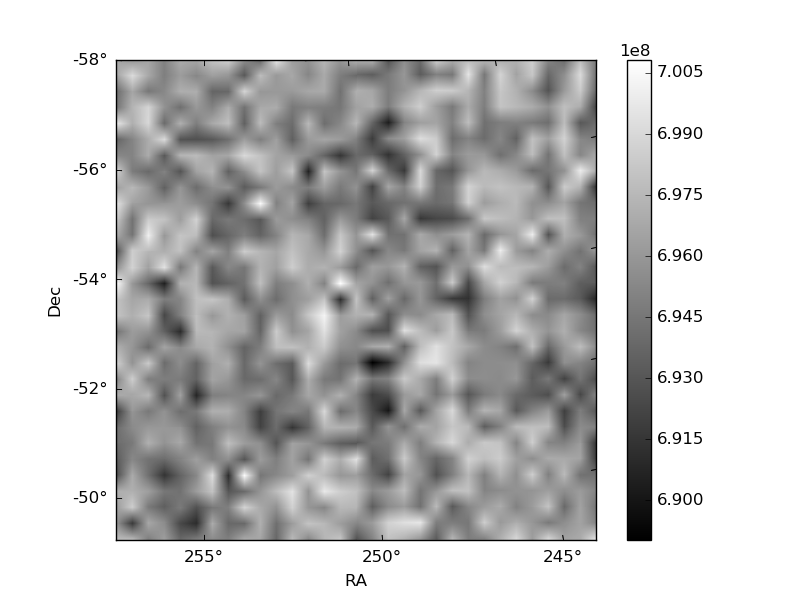
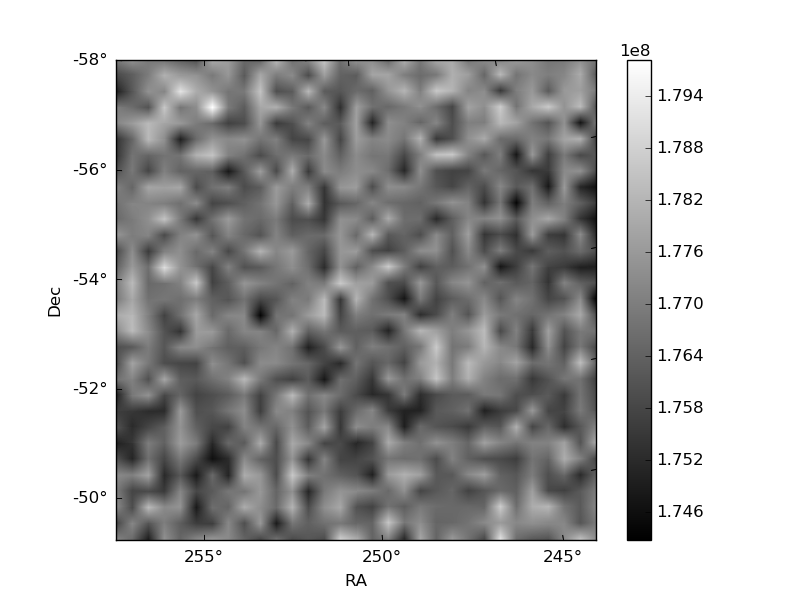
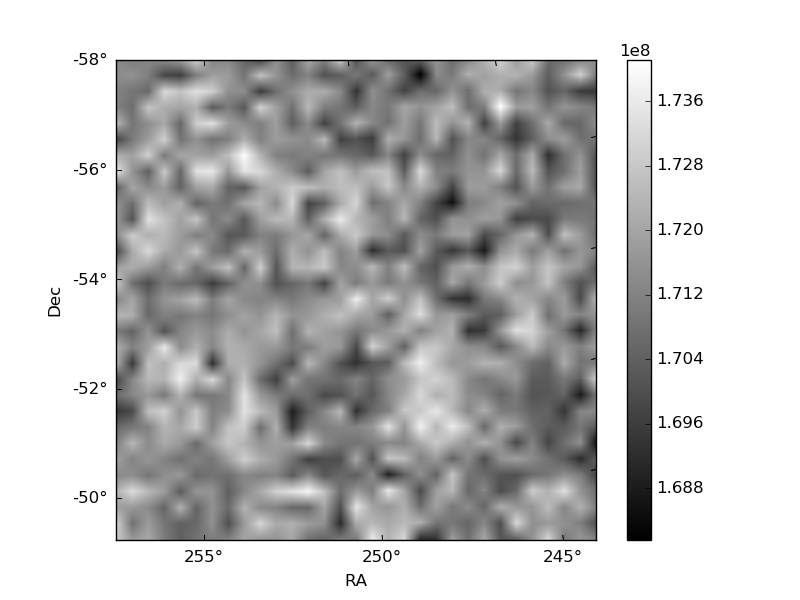
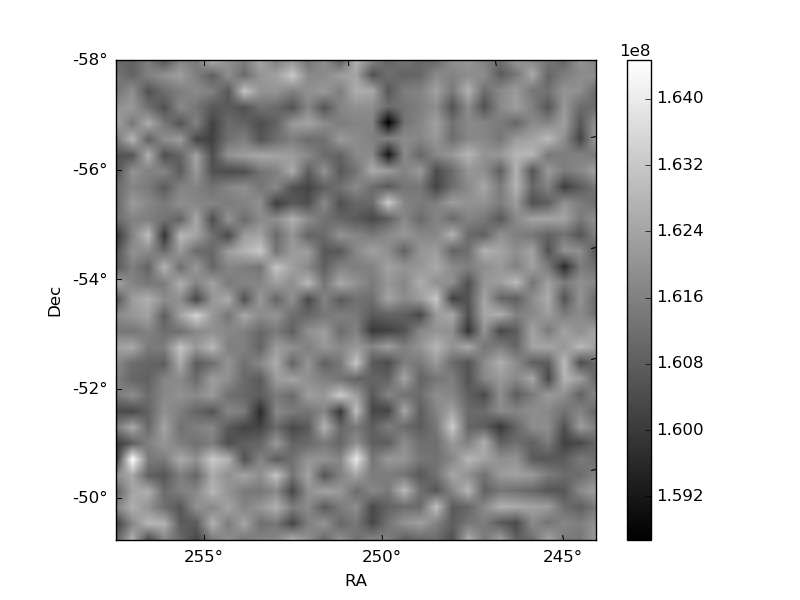
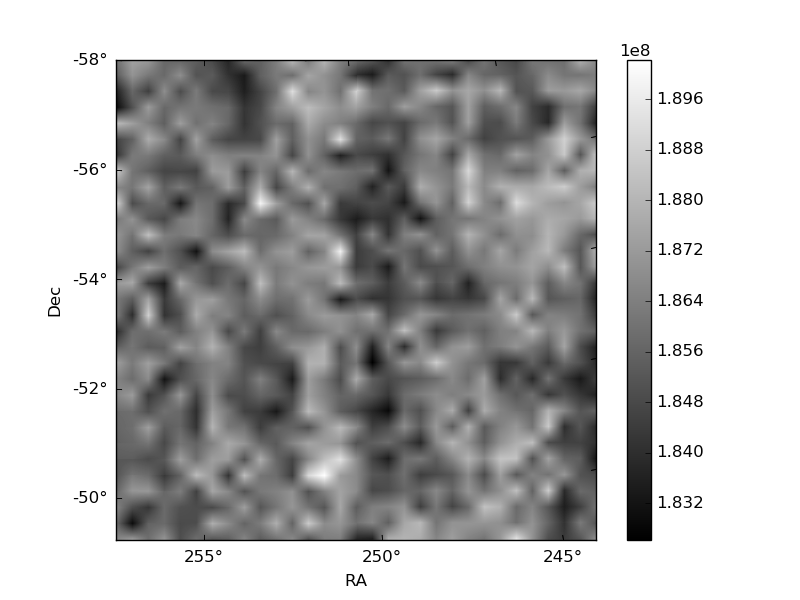
Histogram calculated using DETX and DETY for each event in the final _common_clean file
| Quadrant A | 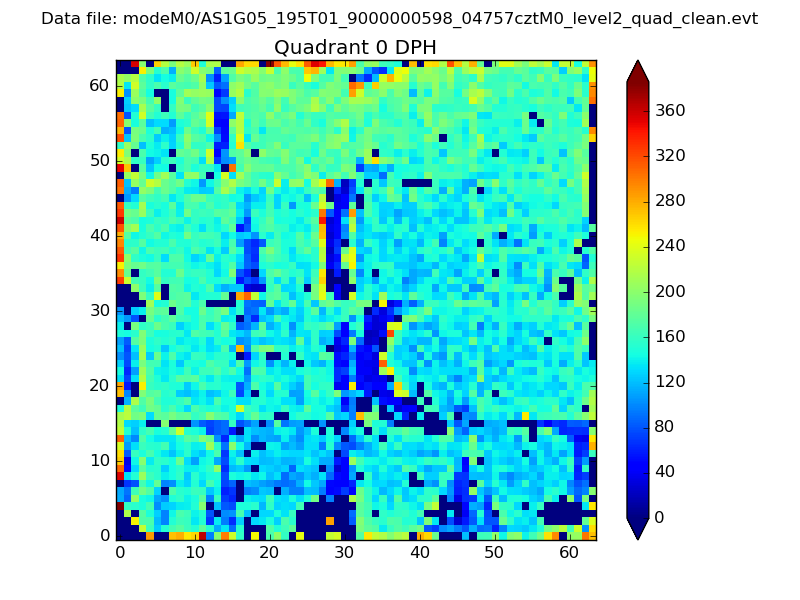 |
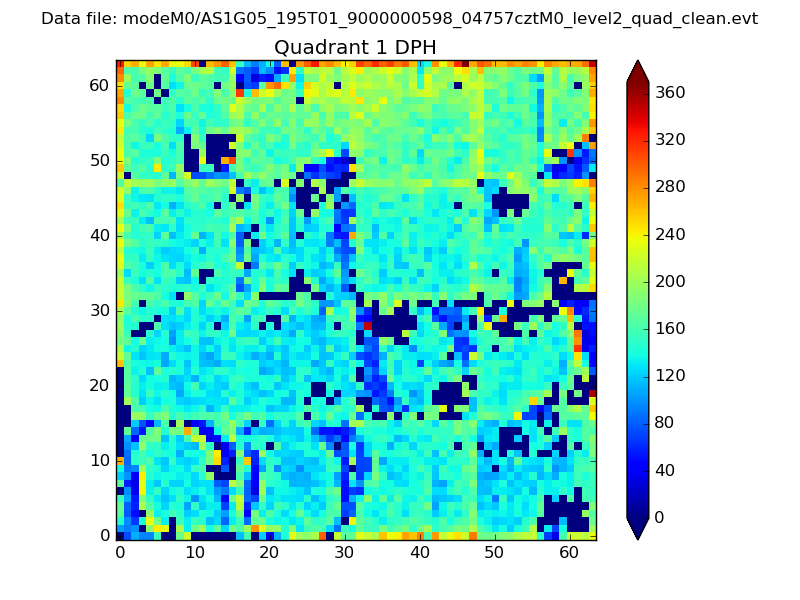 |
Quadrant B |
|---|---|---|---|
| Quadrant D | 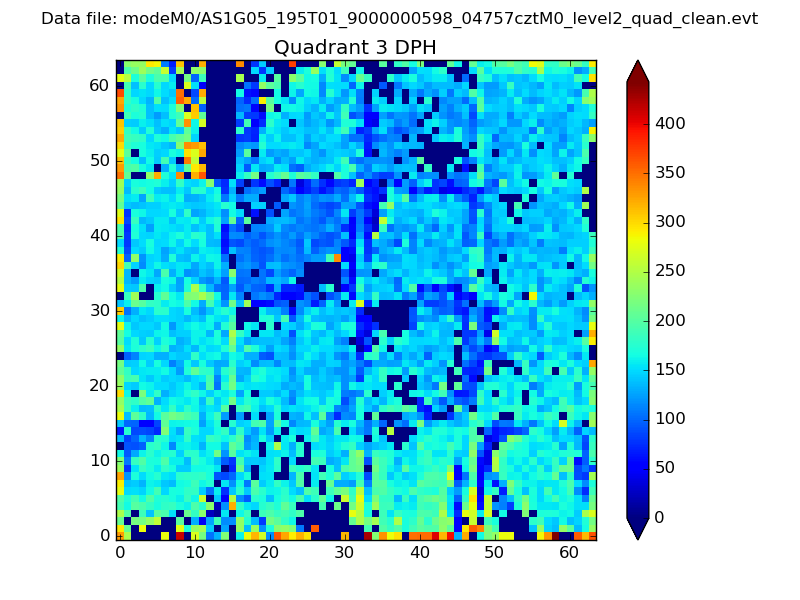 |
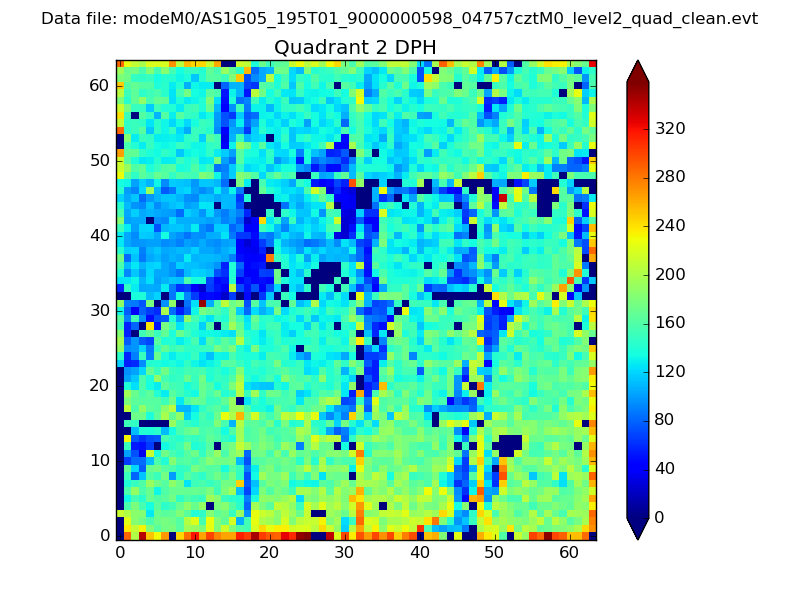 |
Quadrant C |
| Plot type | Count rate plots | Images |
|---|---|---|
| Comparison with Poisson distribution Blue bars denote a histogram of data divided into 1 sec bins. Red curve is a Poisson curve with rate = median count rate of data. |
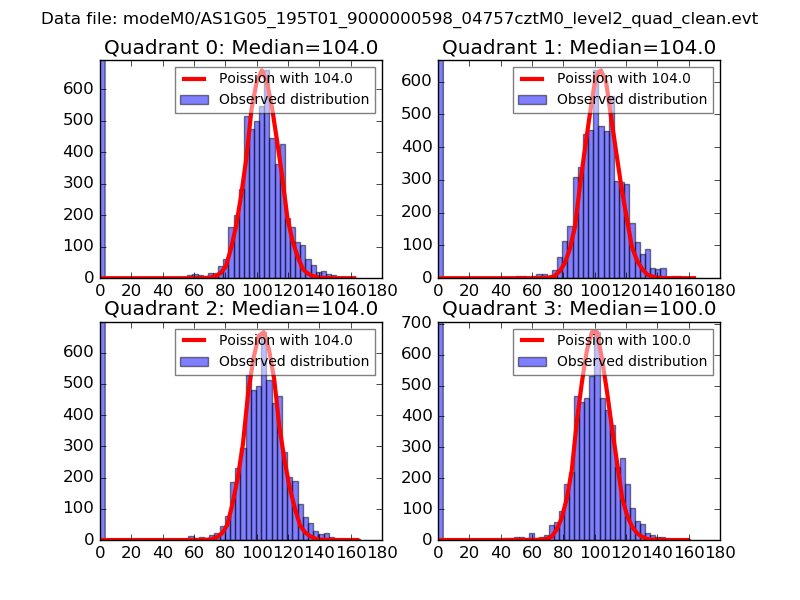 |
 |
| Quadrant-wise count rates Data is divided into 100 sec bins |
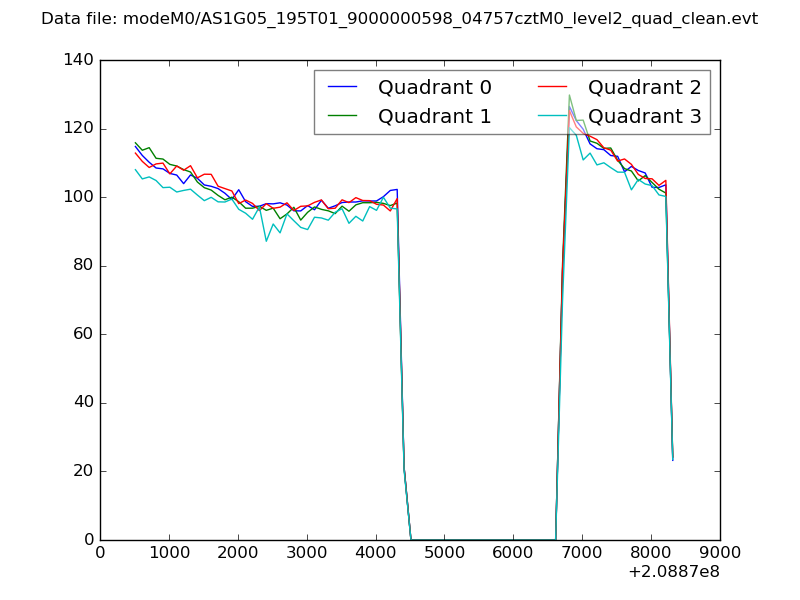 |
|
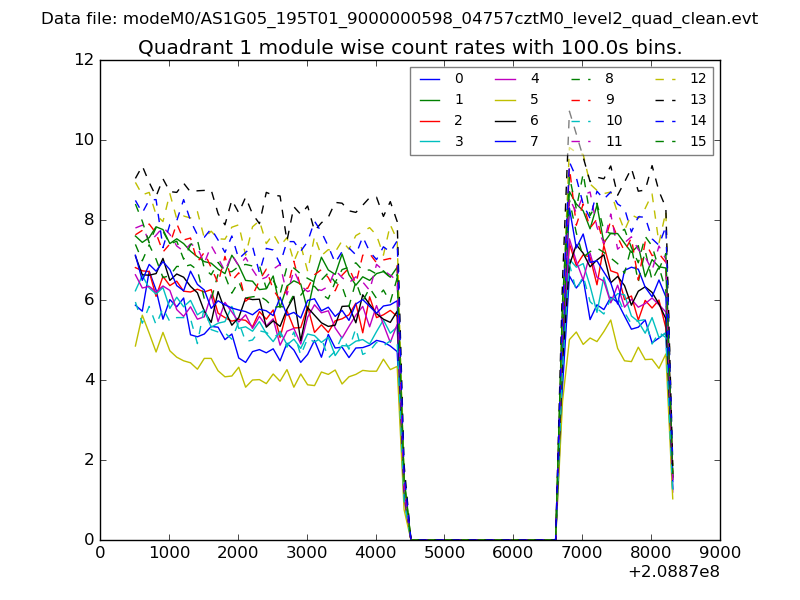
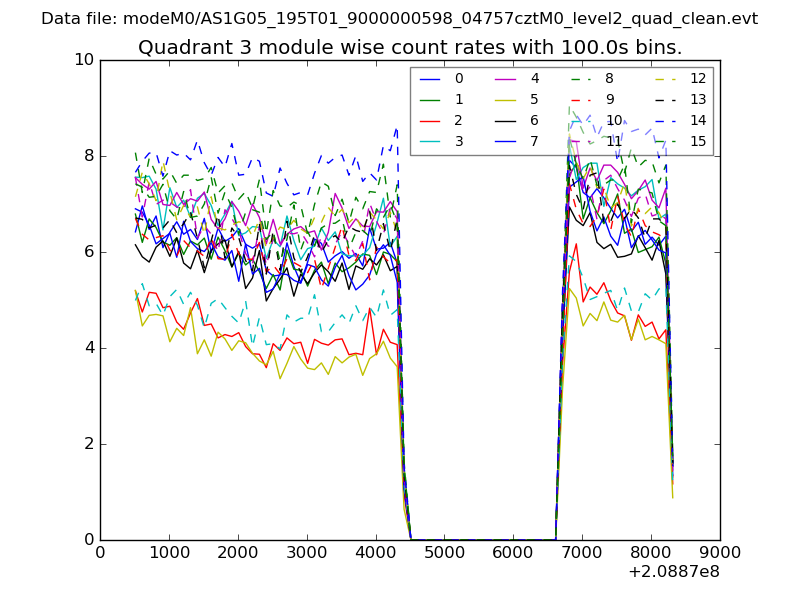
| Module-wise count rates for Quadrant A Data is divided into 100 sec bins |
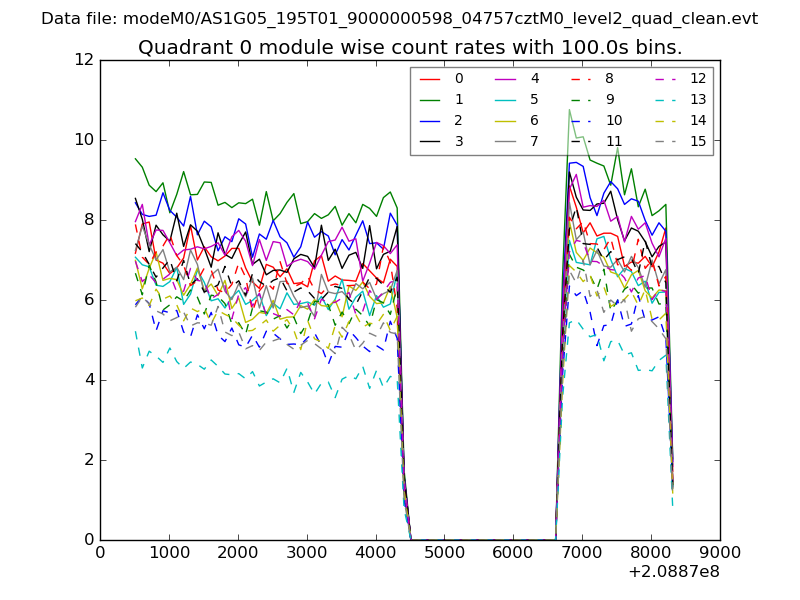 |
 |
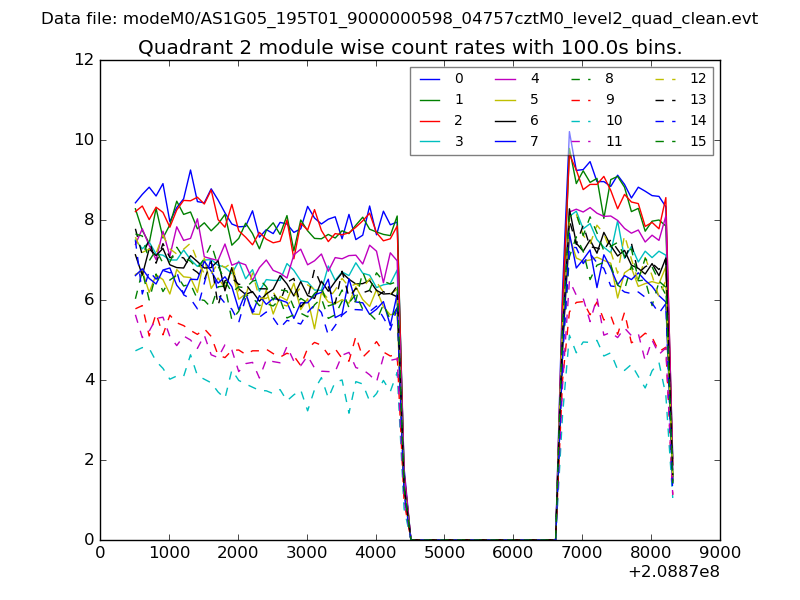
| Module-wise count rates for Quadrant B Data is divided into 100 sec bins |
 |
 |
| Module-wise count rates for Quadrant C Data is divided into 100 sec bins |
 |
 |
| Module-wise count rates for Quadrant D Data is divided into 100 sec bins |
 |
 |
| Parameter | Plot |
|---|---|
| CZT HV Monitor | 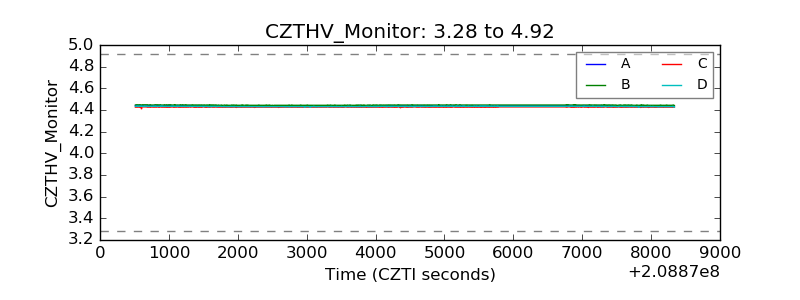 |
| D_VDD | 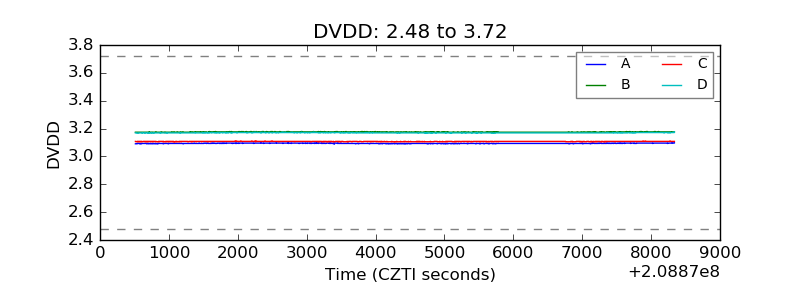 |
| Temperature 1 |  |
| Veto HV Monitor | 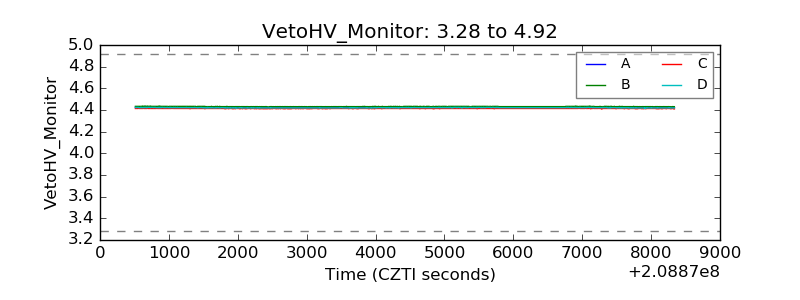 |
| Veto LLD | 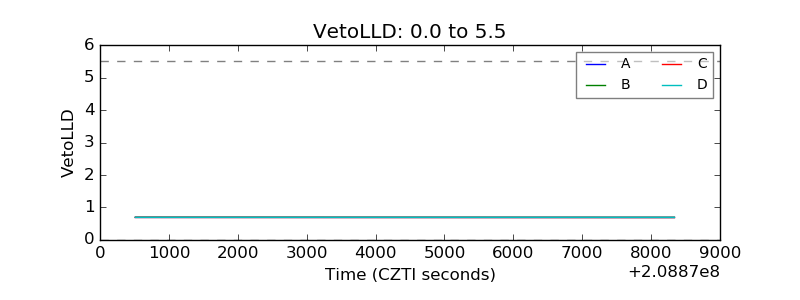 |
| Alpha Counter | 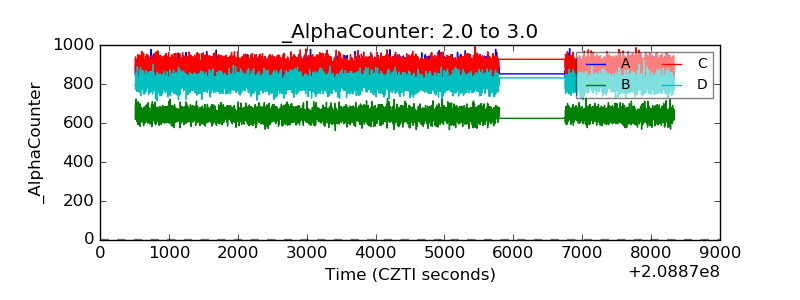 |
| _CPM_Rate | 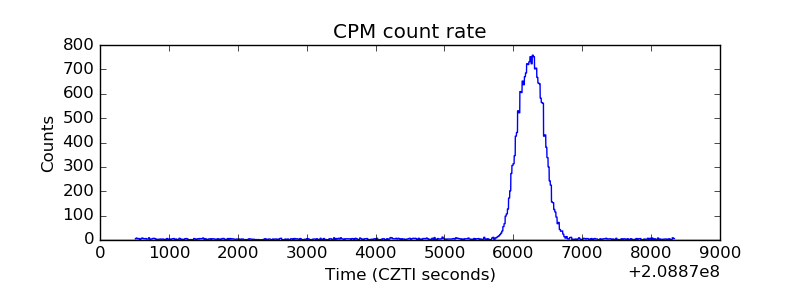 |
| CZT Counter | 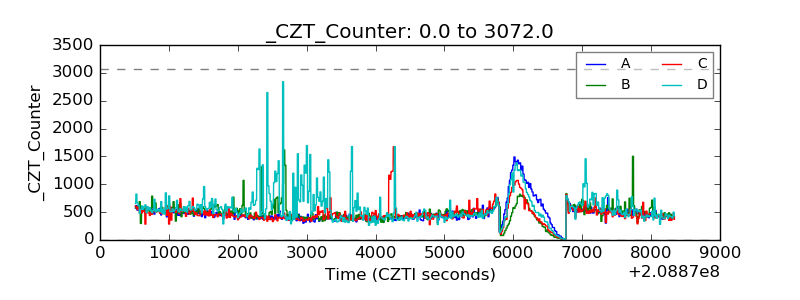 |
| +2.5 Volts monitor |  |
| +5 Volts monitor |  |
| _ROLL_ROT | 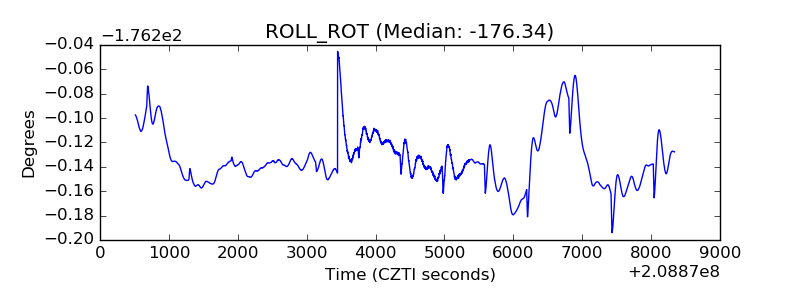 |
| _Roll_DEC | 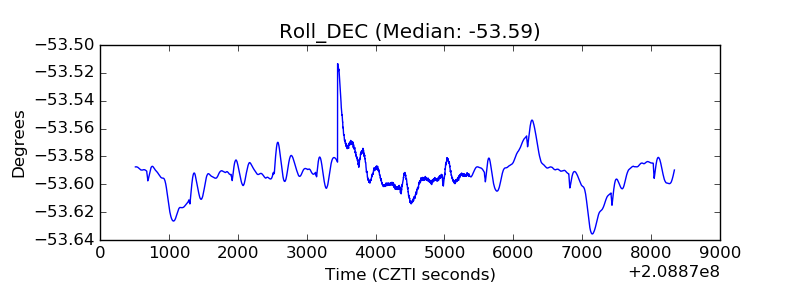 |
| _Roll_RA | 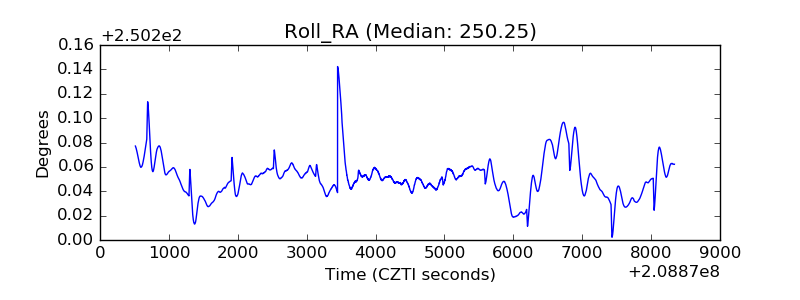 |
| Veto Counter | 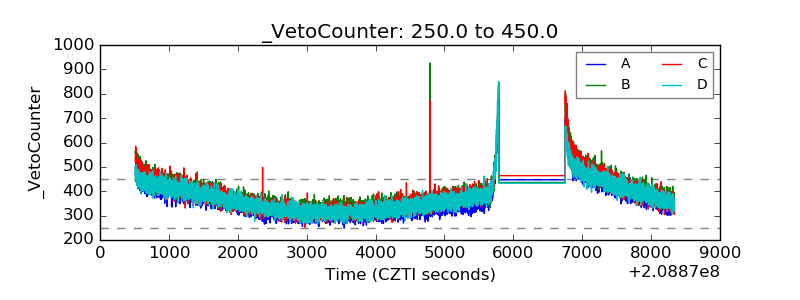 |