| Param | Original file | Final file |
|---|---|---|
| Filename | modeM0/AS1G05_195T01_9000000598_04759cztM0_level2.evt | modeM0/AS1G05_195T01_9000000598_04759cztM0_level2_quad_clean.evt |
| Size (bytes) | 452,756,160 | 73,785,600 |
| Size | 431.8 MB | 70.4 MB |
| Events in quadrant A | 2,673,315 | 464,117 |
| Events in quadrant B | 2,930,667 | 459,944 |
| Events in quadrant C | 2,794,468 | 461,267 |
| Events in quadrant D | 4,907,982 | 431,884 |
| Mode SS | |||
|---|---|---|---|
| Quadrant | BADHDUFLAG | Total packets | Discarded packets |
| A | 0 | 122 | 0 |
| B | 0 | 122 | 0 |
| C | 0 | 122 | 0 |
| D | 0 | 122 | 0 |
| Mode M9 | |||
|---|---|---|---|
| Quadrant | BADHDUFLAG | Total packets | Discarded packets |
| A | 0 | 11 | 0 |
| B | 0 | 11 | 0 |
| C | 0 | 11 | 0 |
| D | 0 | 11 | 0 |
| Mode M0 | |||
|---|---|---|---|
| Quadrant | BADHDUFLAG | Total packets | Discarded packets |
| A | 0 | 12224 | 2 |
| B | 0 | 12797 | 1 |
| C | 0 | 12648 | 1 |
| D | 0 | 18824 | 1 |
| Quadrant | Total seconds | Saturated seconds | Saturation percentage |
|---|---|---|---|
| A | 5964 | 38 | 0.637156% |
| B | 5964 | 42 | 0.704225% |
| C | 5964 | 35 | 0.586854% |
| D | 5964 | 466 | 7.813548% |
Noise dominated data is calculated using 1-second bins in cleaned event files. If a bin has >2000 counts, and if more than 50% of those come from <1% of pixels, then it is considered to be noise-dominated and hence unusable.
| Quadrant | # 1 sec bins | Bins with >0 counts | Bins with >2000 counts | High rate bins dominated by noise | Noise dominated (total time) | Noise dominated (detector-on time) | Marked lightcurve |
|---|---|---|---|---|---|---|---|
| A | 7095 | 5965 | 0 | 0 | 0.00% | 0.00% | 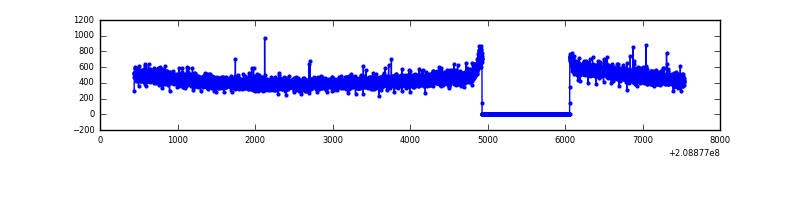 |
| B | 7095 | 5965 | 3 | 3 | 0.04% | 0.05% | 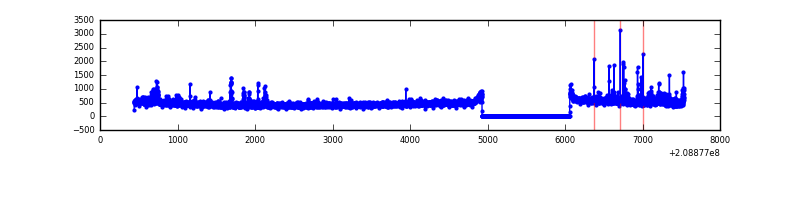 |
| C | 7095 | 5965 | 14 | 14 | 0.20% | 0.23% | 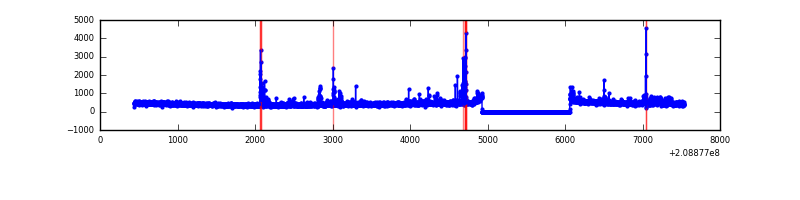 |
| D | 7095 | 5965 | 500 | 500 | 7.05% | 8.38% | 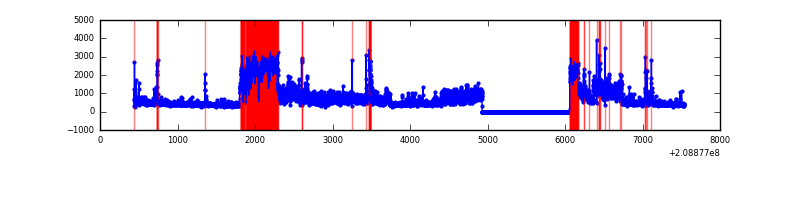 |
Top three noisy pixels from each quadrant. If the there are fewer than three noisy pixels in the level2.evt file, extra rows are filled as -1
| Pixel properties | Quadrant properties | ||||||
|---|---|---|---|---|---|---|---|
| Quadrant | DetID | PixID | Counts | Sigma | Mean | Median | Sigma |
| A | 8 | 15 | 9191 | 60.16 | 688 | 672 | 141.6 |
| A | 13 | 251 | 7992 | 51.69 | 688 | 672 | 141.6 |
| A | 0 | 226 | 7617 | 49.04 | 688 | 672 | 141.6 |
| B | 15 | 204 | 70402 | 521.43 | 692 | 676 | 133.7 |
| B | 4 | 80 | 46060 | 339.4 | 692 | 676 | 133.7 |
| B | 14 | 167 | 45869 | 337.97 | 692 | 676 | 133.7 |
| C | 14 | 48 | 139991 | 913.3 | 656 | 657 | 152.6 |
| C | 1 | 16 | 83530 | 543.21 | 656 | 657 | 152.6 |
| C | 12 | 4 | 6339 | 37.24 | 656 | 657 | 152.6 |
| D | 11 | 132 | 2131719 | 13613.62 | 647 | 627 | 156.5 |
| D | 2 | 234 | 81409 | 516.04 | 647 | 627 | 156.5 |
| D | 13 | 235 | 63557 | 402.0 | 647 | 627 | 156.5 |
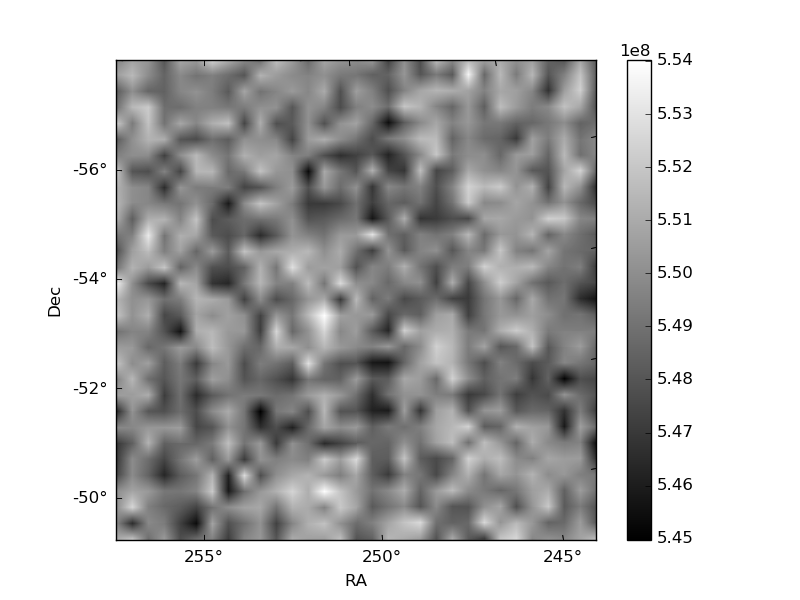
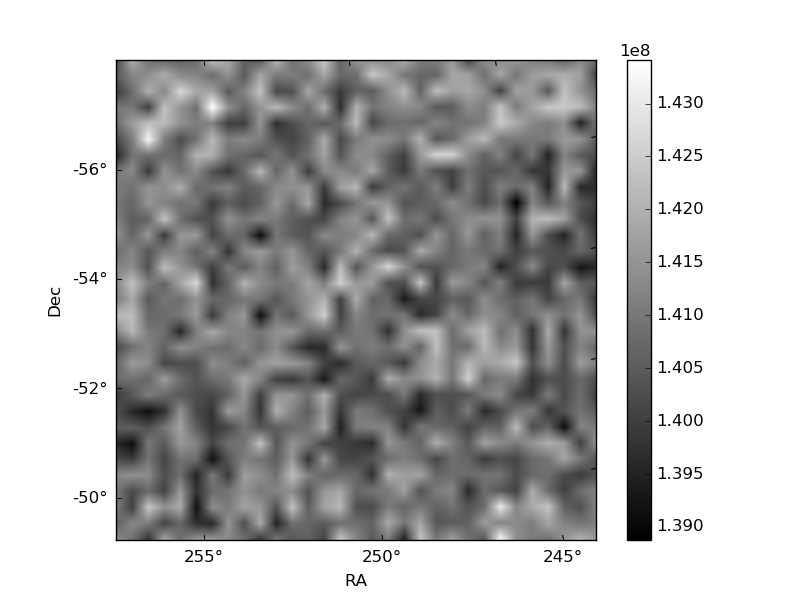
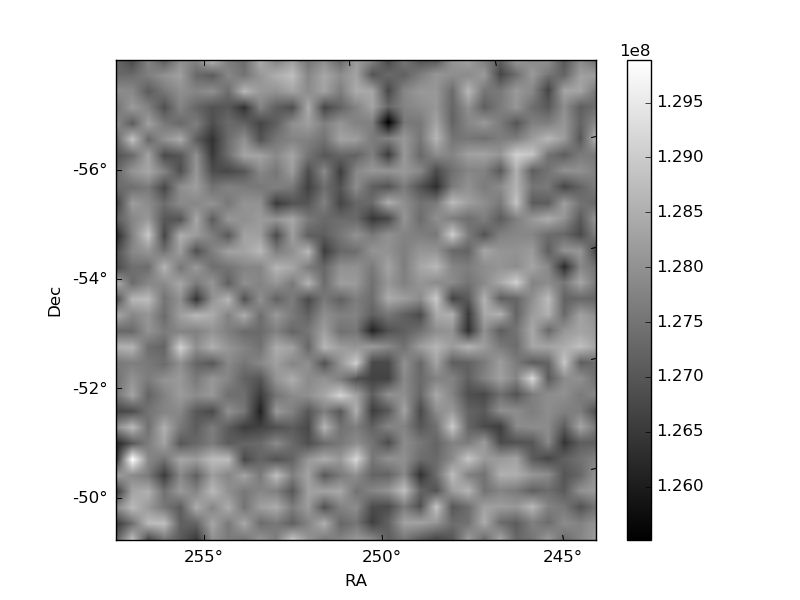
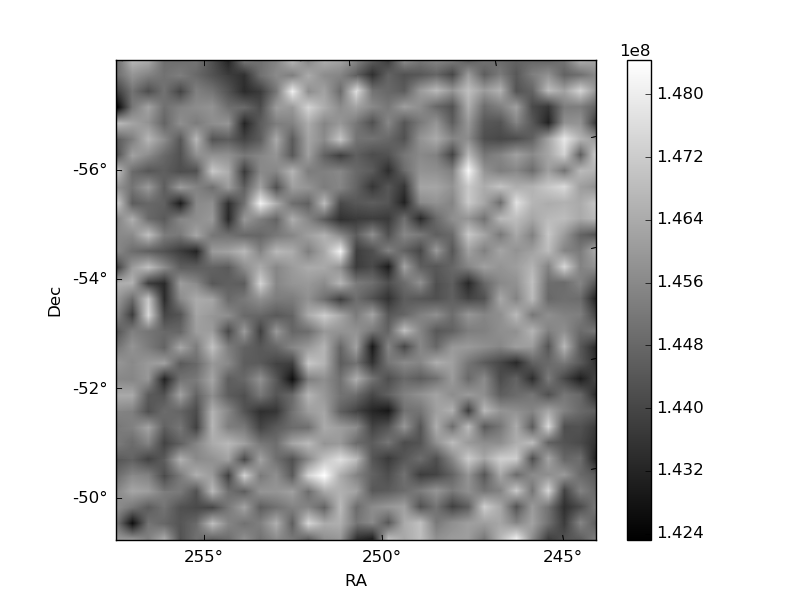
Histogram calculated using DETX and DETY for each event in the final _common_clean file
| Quadrant A | 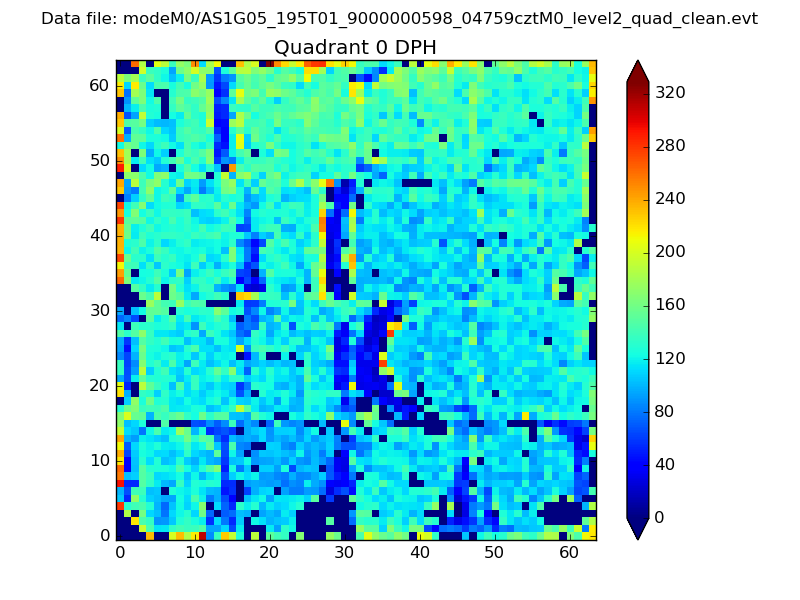 |
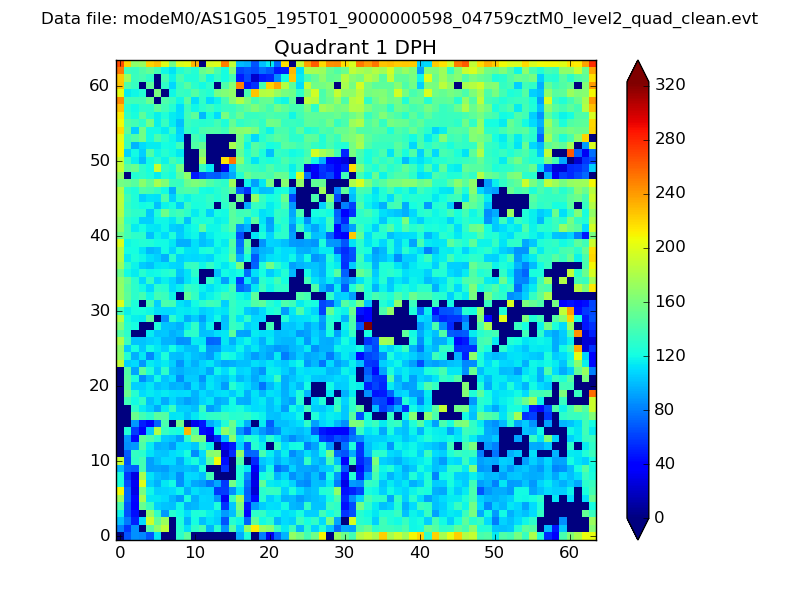 |
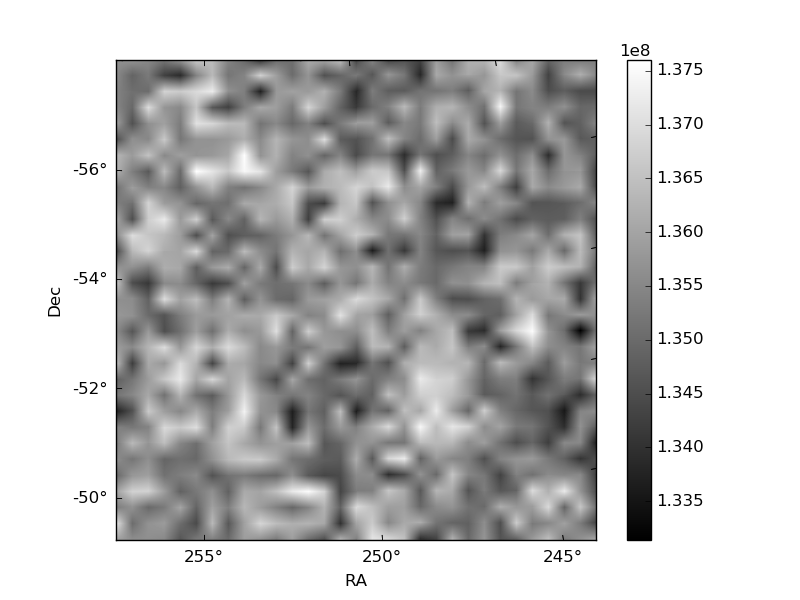
Quadrant B |
|---|---|---|---|
| Quadrant D | 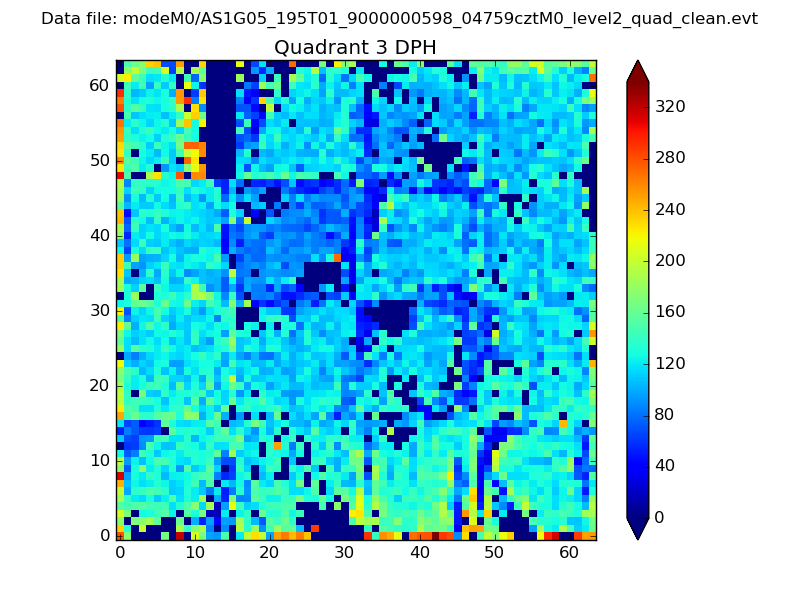 |
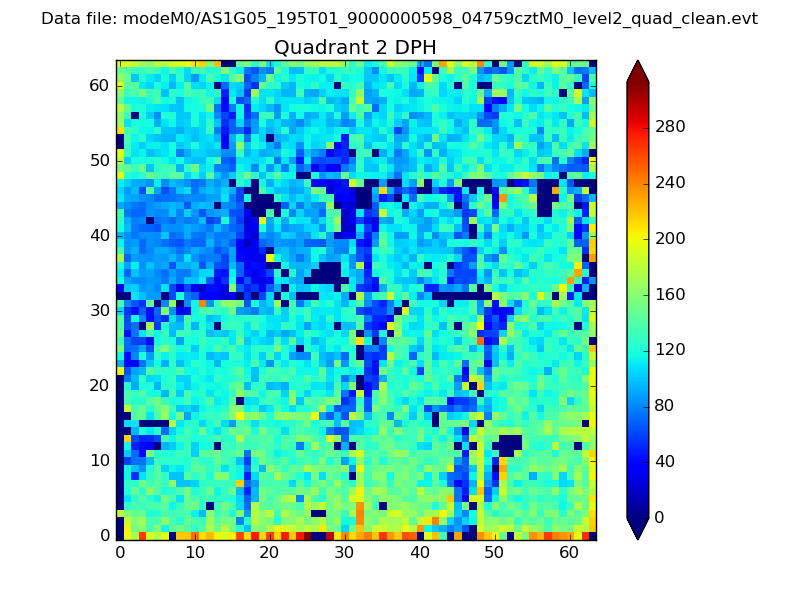 |
Quadrant C |
| Plot type | Count rate plots | Images |
|---|---|---|
| Comparison with Poisson distribution Blue bars denote a histogram of data divided into 1 sec bins. Red curve is a Poisson curve with rate = median count rate of data. |
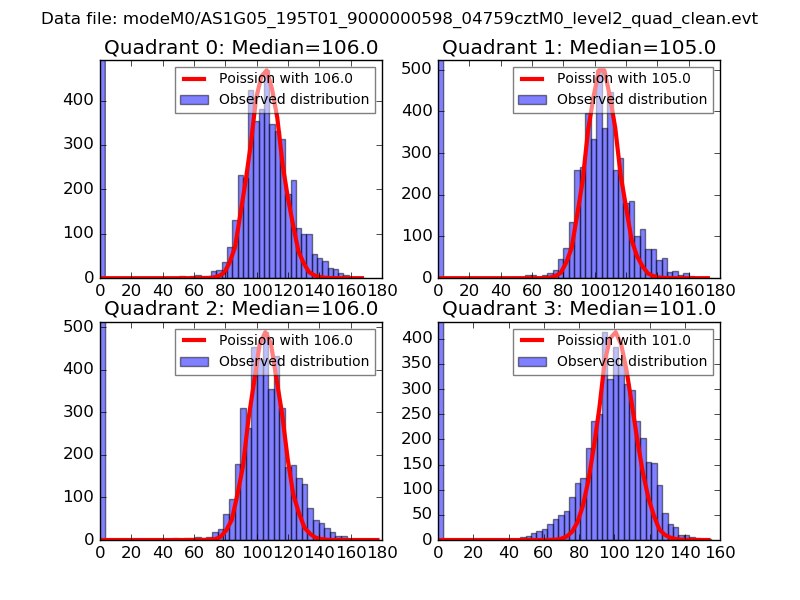 |
 |
| Quadrant-wise count rates Data is divided into 100 sec bins |
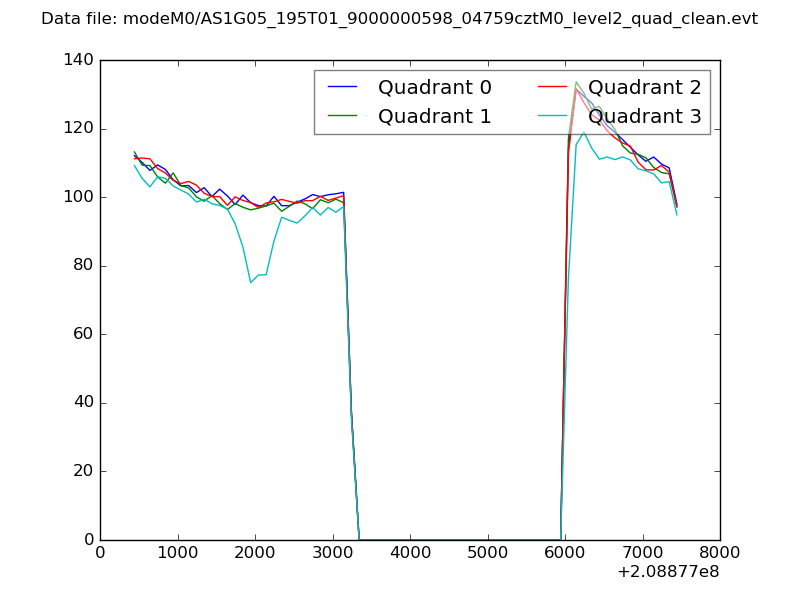 |
|
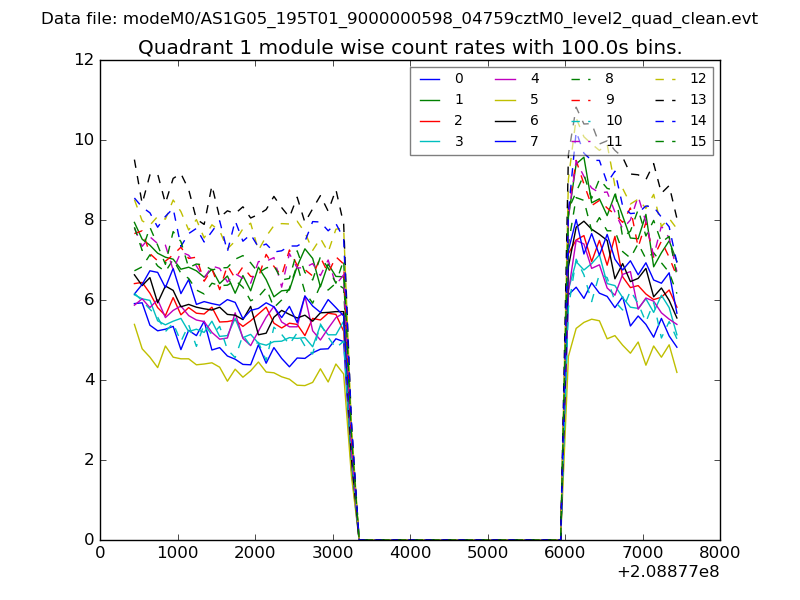
| Module-wise count rates for Quadrant A Data is divided into 100 sec bins |
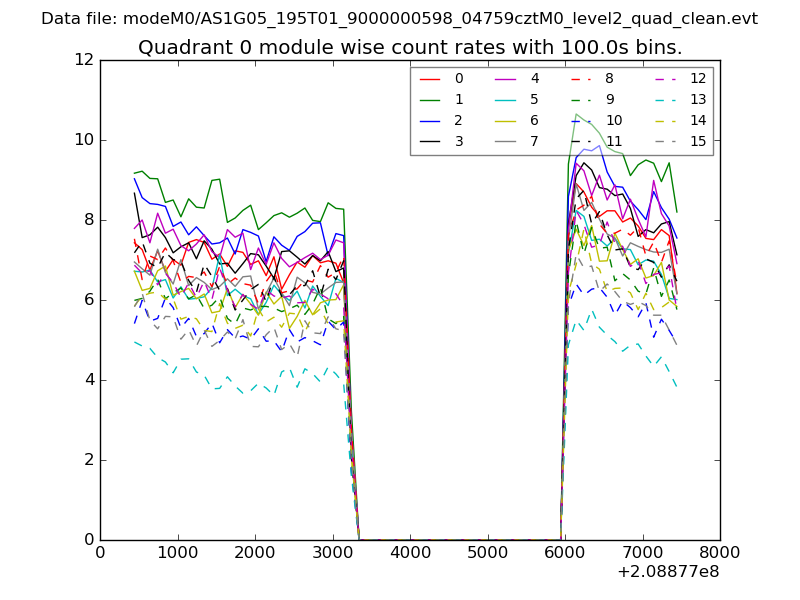 |
 |
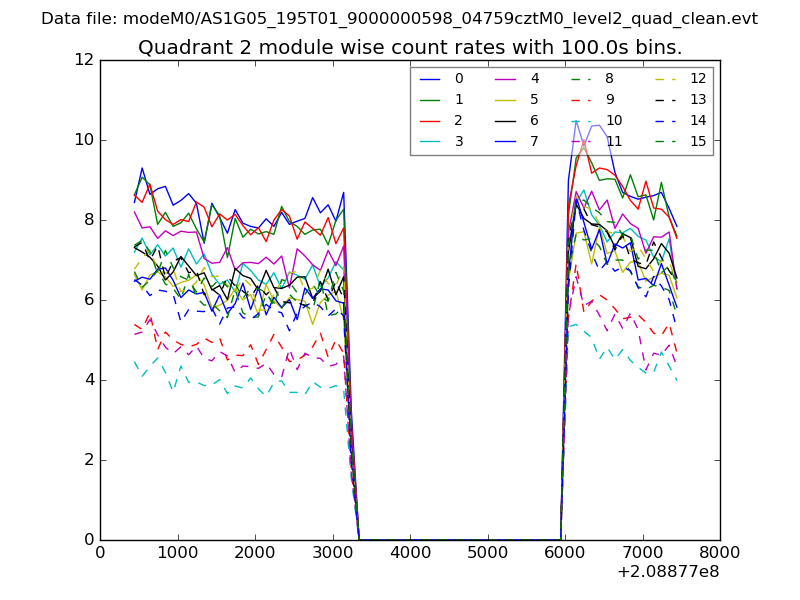
| Module-wise count rates for Quadrant B Data is divided into 100 sec bins |
 |
 |
| Module-wise count rates for Quadrant C Data is divided into 100 sec bins |
 |
 |
| Module-wise count rates for Quadrant D Data is divided into 100 sec bins |
 |
 |
| Parameter | Plot |
|---|---|
| CZT HV Monitor | 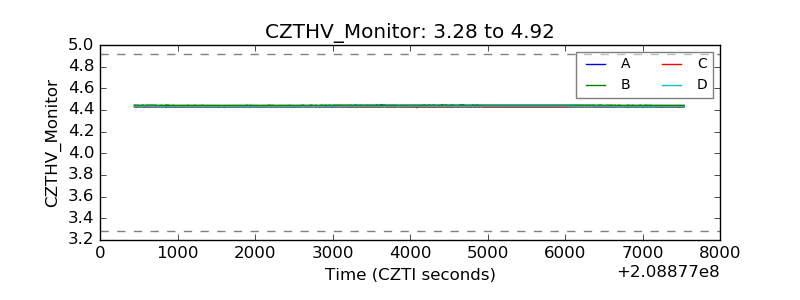 |
| D_VDD | 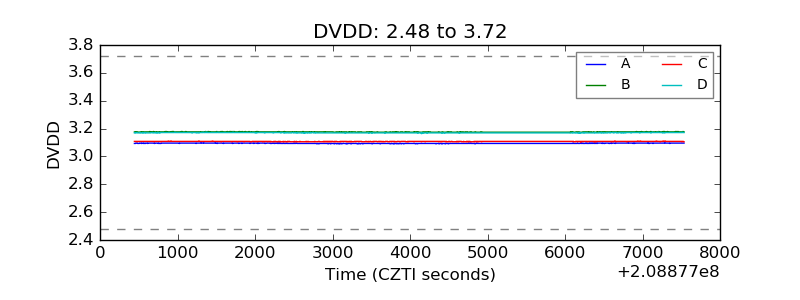 |
| Temperature 1 |  |
| Veto HV Monitor | 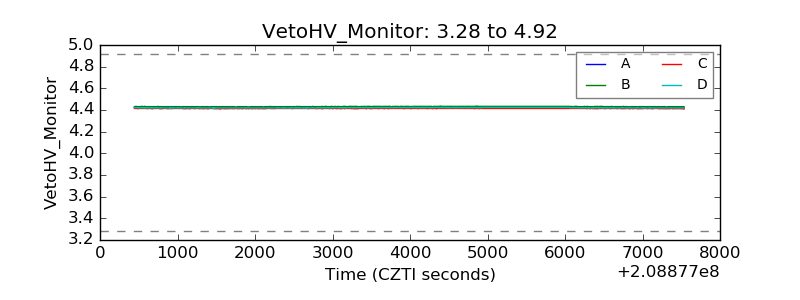 |
| Veto LLD | 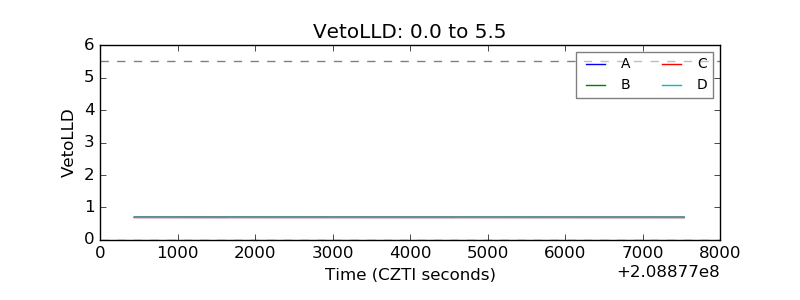 |
| Alpha Counter | 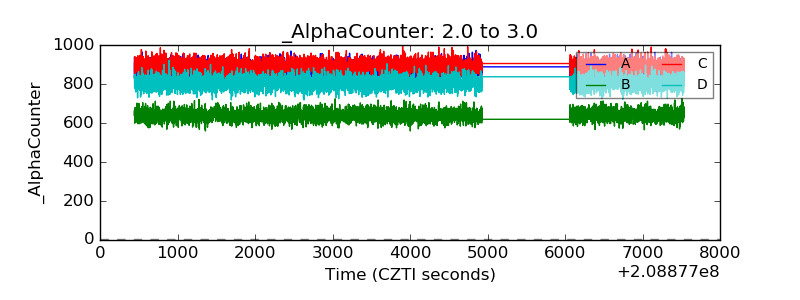 |
| _CPM_Rate | 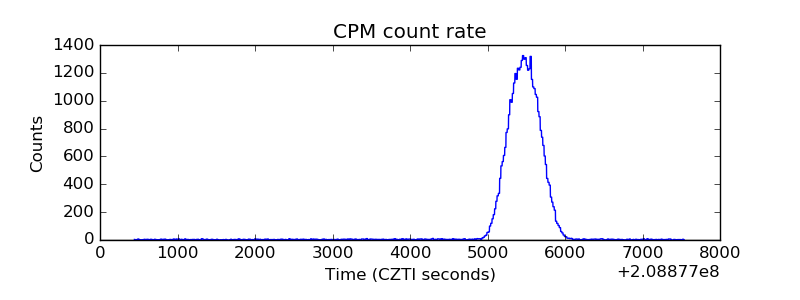 |
| CZT Counter | 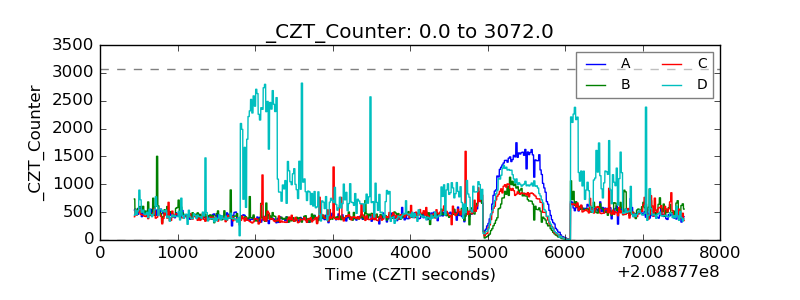 |
| +2.5 Volts monitor |  |
| +5 Volts monitor |  |
| _ROLL_ROT | 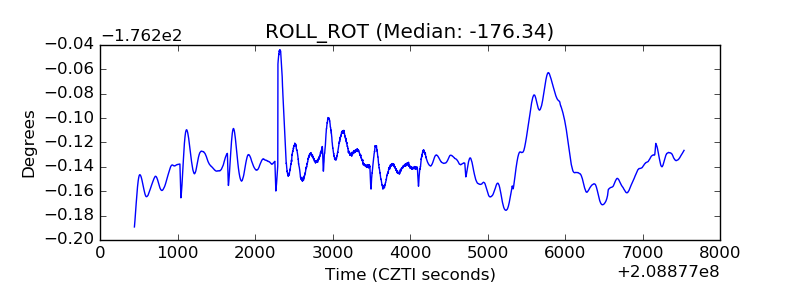 |
| _Roll_DEC | 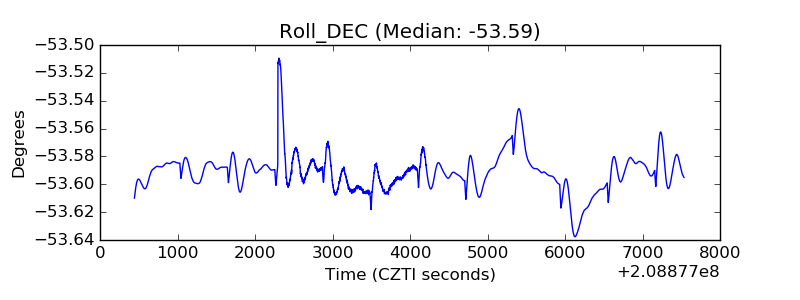 |
| _Roll_RA | 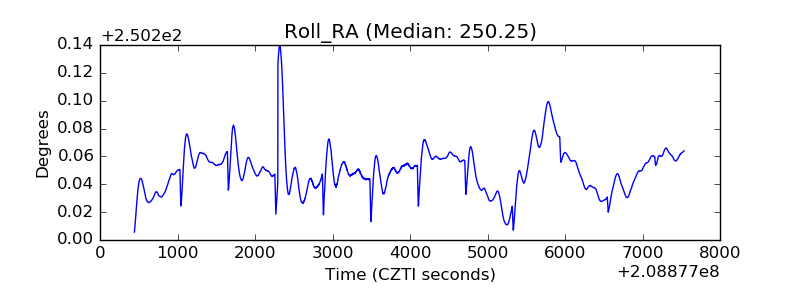 |
| Veto Counter | 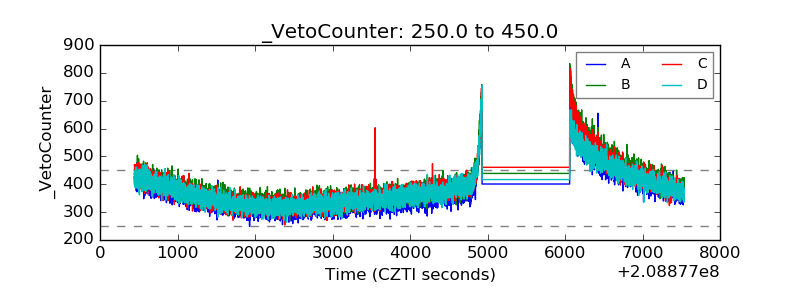 |