| Param | Original file | Final file |
|---|---|---|
| Filename | modeM0/AS1G05_195T01_9000000598_04760cztM0_level2.evt | modeM0/AS1G05_195T01_9000000598_04760cztM0_level2_quad_clean.evt |
| Size (bytes) | 350,251,200 | 58,242,240 |
| Size | 334.0 MB | 55.5 MB |
| Events in quadrant A | 2,310,373 | 357,207 |
| Events in quadrant B | 2,599,973 | 354,978 |
| Events in quadrant C | 2,668,220 | 352,938 |
| Events in quadrant D | 2,683,642 | 343,084 |
| Mode SS | |||
|---|---|---|---|
| Quadrant | BADHDUFLAG | Total packets | Discarded packets |
| A | 0 | 104 | 0 |
| B | 0 | 104 | 0 |
| C | 0 | 104 | 0 |
| D | 0 | 104 | 0 |
| Mode M9 | |||
|---|---|---|---|
| Quadrant | BADHDUFLAG | Total packets | Discarded packets |
| A | 0 | 12 | 0 |
| B | 0 | 12 | 0 |
| C | 0 | 12 | 0 |
| D | 0 | 12 | 0 |
| Mode M0 | |||
|---|---|---|---|
| Quadrant | BADHDUFLAG | Total packets | Discarded packets |
| A | 0 | 10469 | 1 |
| B | 0 | 11156 | 1 |
| C | 0 | 11536 | 1 |
| D | 0 | 11665 | 1 |
| Quadrant | Total seconds | Saturated seconds | Saturation percentage |
|---|---|---|---|
| A | 5062 | 55 | 1.086527% |
| B | 5062 | 67 | 1.323588% |
| C | 5062 | 112 | 2.212564% |
| D | 5062 | 94 | 1.856974% |
Noise dominated data is calculated using 1-second bins in cleaned event files. If a bin has >2000 counts, and if more than 50% of those come from <1% of pixels, then it is considered to be noise-dominated and hence unusable.
| Quadrant | # 1 sec bins | Bins with >0 counts | Bins with >2000 counts | High rate bins dominated by noise | Noise dominated (total time) | Noise dominated (detector-on time) | Marked lightcurve |
|---|---|---|---|---|---|---|---|
| A | 6267 | 5063 | 1 | 1 | 0.02% | 0.02% | 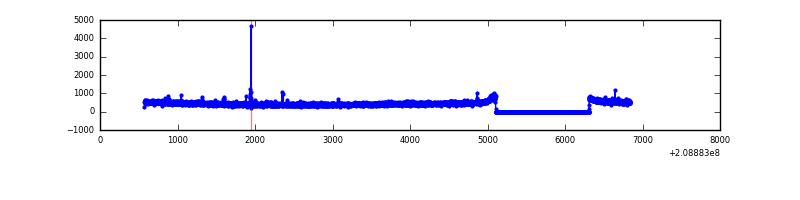 |
| B | 6267 | 5063 | 12 | 12 | 0.19% | 0.24% | 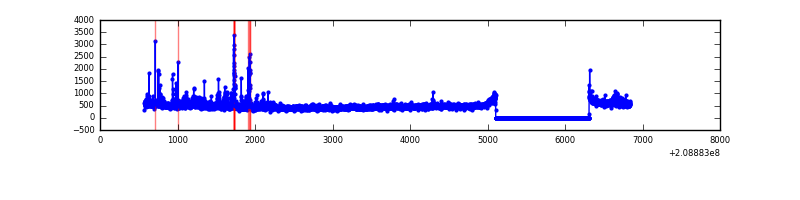 |
| C | 6267 | 5063 | 51 | 51 | 0.81% | 1.01% | 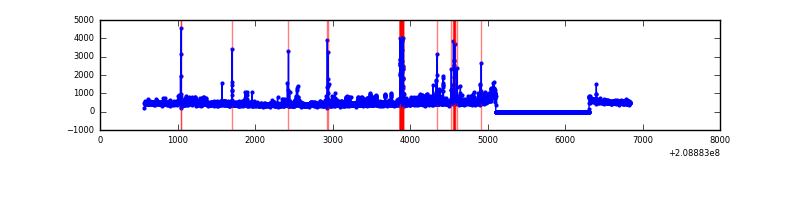 |
| D | 6267 | 5063 | 36 | 36 | 0.57% | 0.71% | 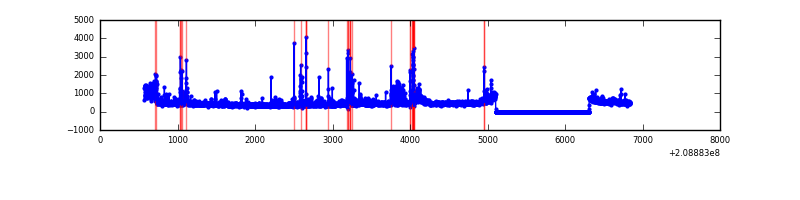 |
Top three noisy pixels from each quadrant. If the there are fewer than three noisy pixels in the level2.evt file, extra rows are filled as -1
| Pixel properties | Quadrant properties | ||||||
|---|---|---|---|---|---|---|---|
| Quadrant | DetID | PixID | Counts | Sigma | Mean | Median | Sigma |
| A | 0 | 118 | 13835 | 109.72 | 590 | 578 | 120.8 |
| A | 13 | 251 | 8980 | 69.54 | 590 | 578 | 120.8 |
| A | 8 | 15 | 8342 | 64.26 | 590 | 578 | 120.8 |
| B | 14 | 167 | 79576 | 683.37 | 594 | 580 | 115.6 |
| B | 4 | 80 | 63088 | 540.74 | 594 | 580 | 115.6 |
| B | 15 | 204 | 59031 | 505.64 | 594 | 580 | 115.6 |
| C | 14 | 48 | 269254 | 2066.48 | 559 | 562 | 130.0 |
| C | 1 | 16 | 209307 | 1605.43 | 559 | 562 | 130.0 |
| C | 13 | 61 | 4772 | 32.38 | 559 | 562 | 130.0 |
| D | 13 | 235 | 277897 | 2050.78 | 561 | 543 | 135.2 |
| D | 11 | 132 | 152178 | 1121.2 | 561 | 543 | 135.2 |
| D | 2 | 234 | 62510 | 458.19 | 561 | 543 | 135.2 |
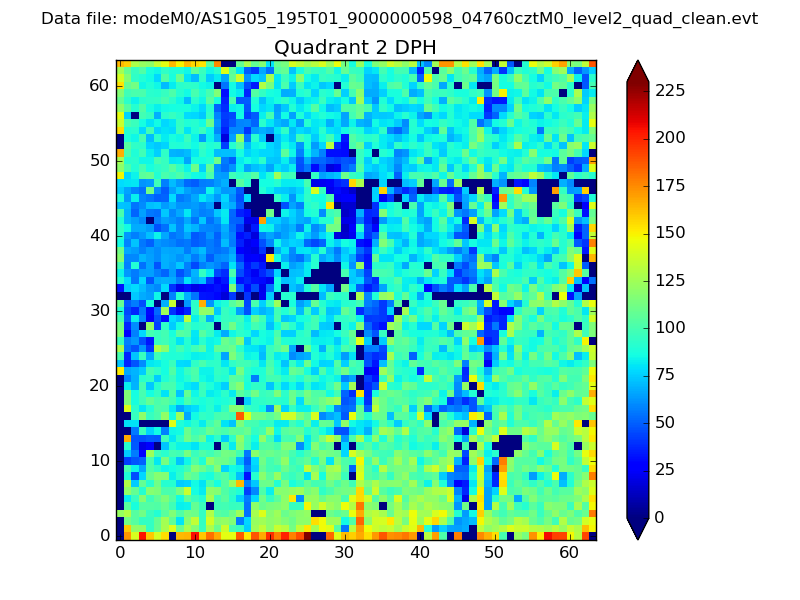
Histogram calculated using DETX and DETY for each event in the final _common_clean file
| Quadrant A | 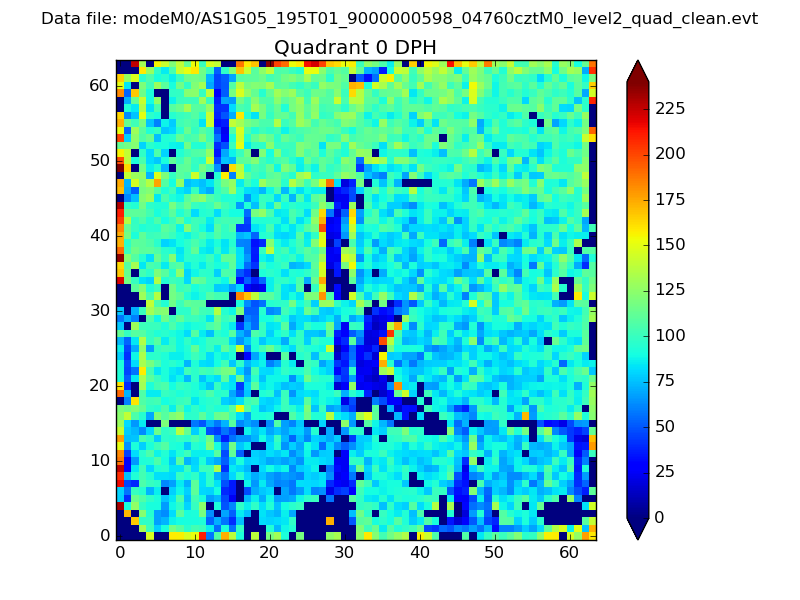 |
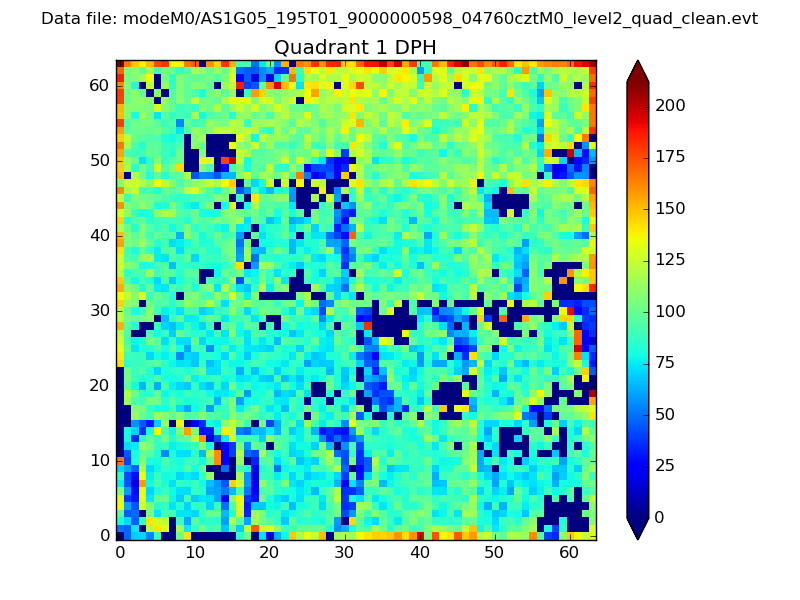 |
Quadrant B |
|---|---|---|---|
| Quadrant D | 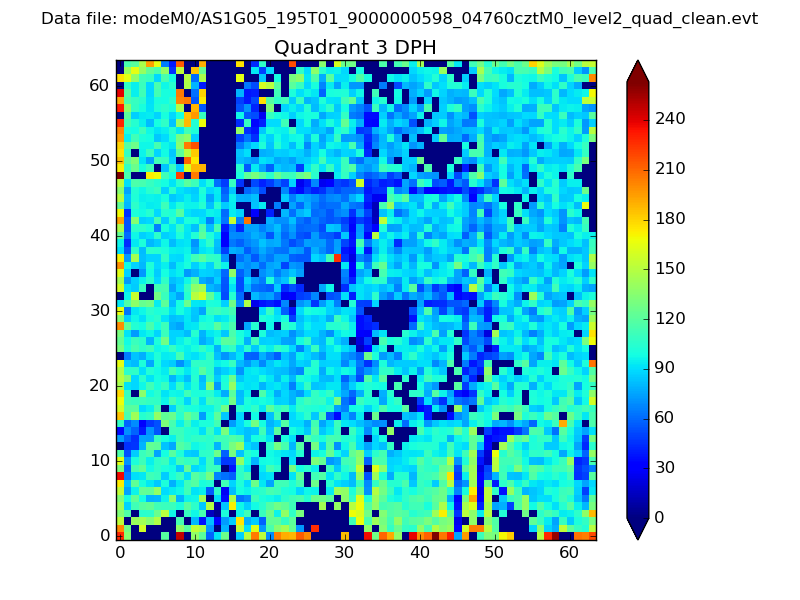 |
 |
Quadrant C |
| Plot type | Count rate plots | Images |
|---|---|---|
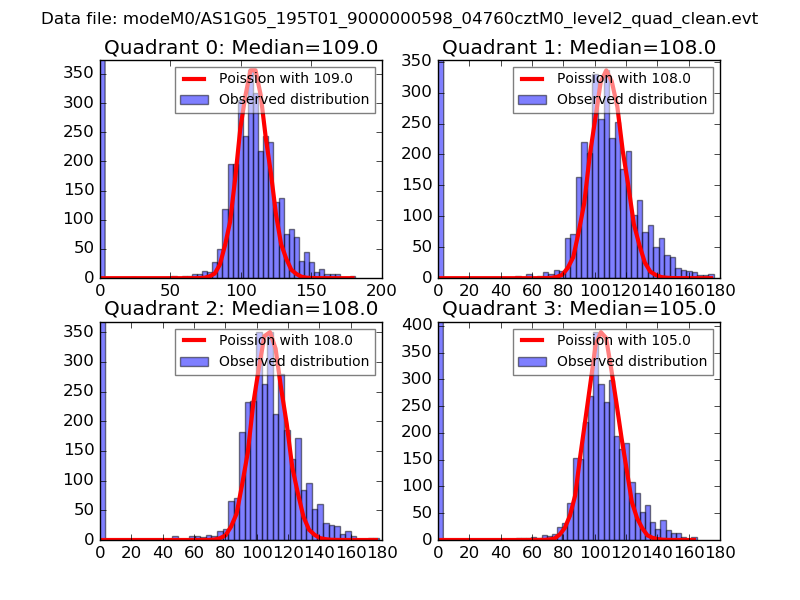
| Comparison with Poisson distribution Blue bars denote a histogram of data divided into 1 sec bins. Red curve is a Poisson curve with rate = median count rate of data. |
 |
 |
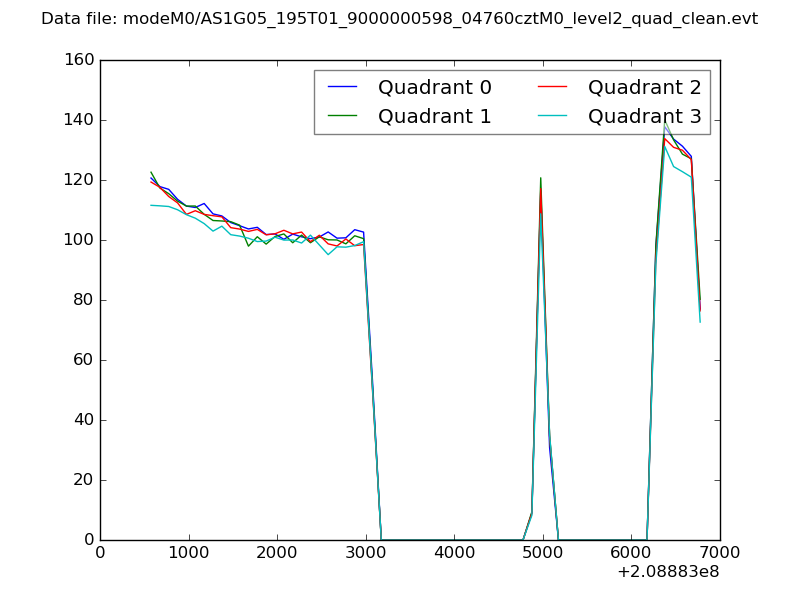
| Quadrant-wise count rates Data is divided into 100 sec bins |
 |
|
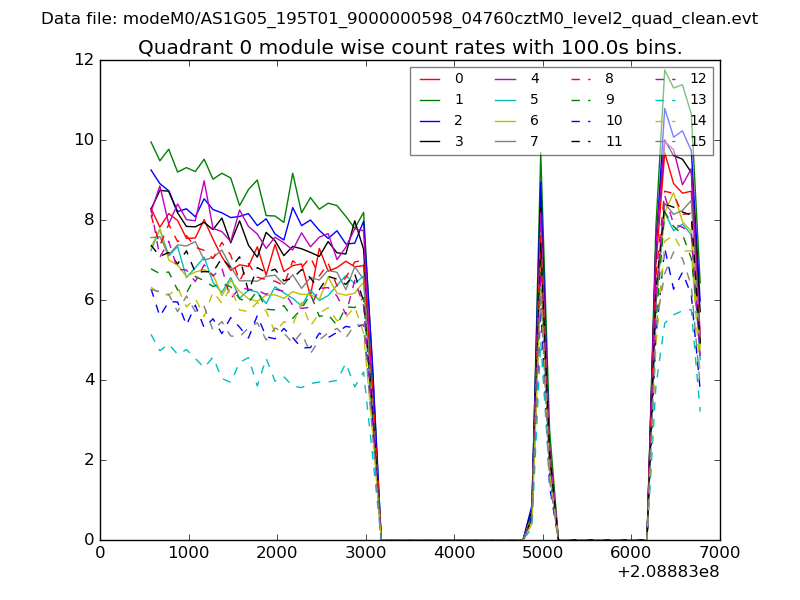
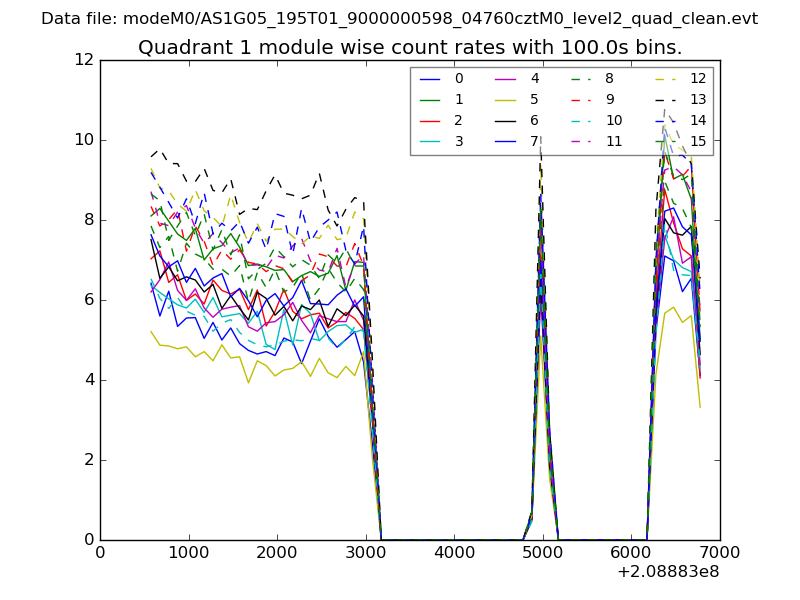
| Module-wise count rates for Quadrant A Data is divided into 100 sec bins |
 |
 |
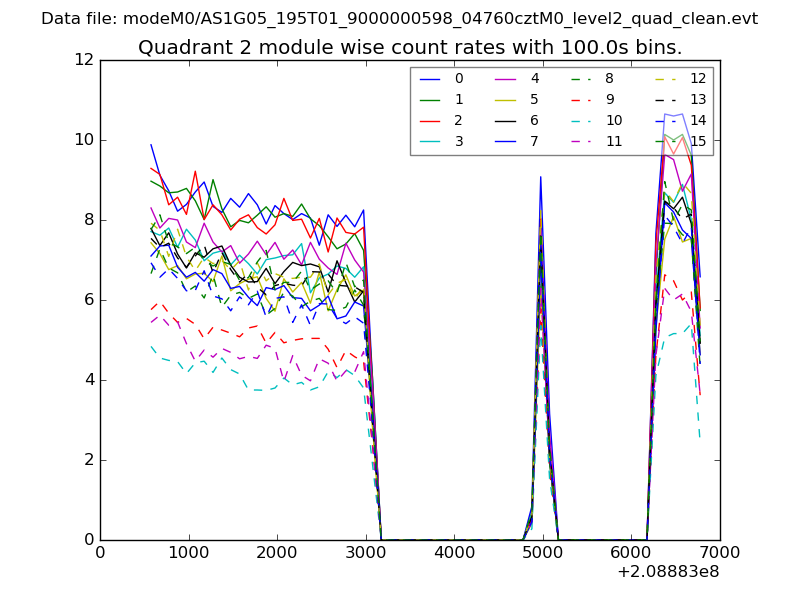
| Module-wise count rates for Quadrant B Data is divided into 100 sec bins |
 |
 |
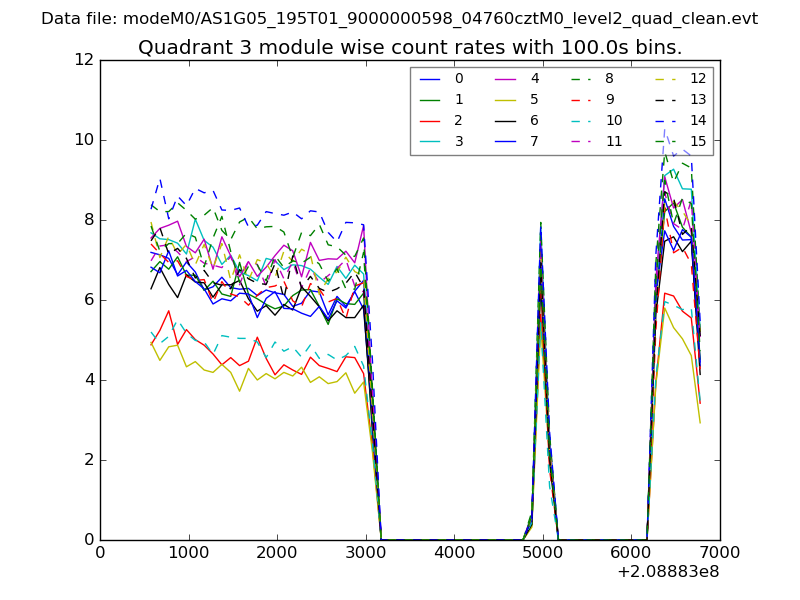
| Module-wise count rates for Quadrant C Data is divided into 100 sec bins |
 |
 |
| Module-wise count rates for Quadrant D Data is divided into 100 sec bins |
 |
 |
| Parameter | Plot |
|---|---|
| CZT HV Monitor | 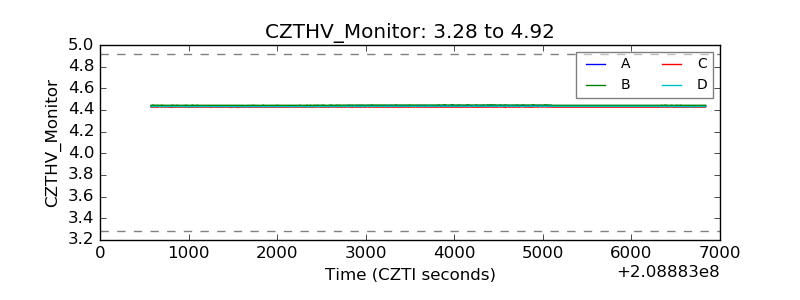 |
| D_VDD | 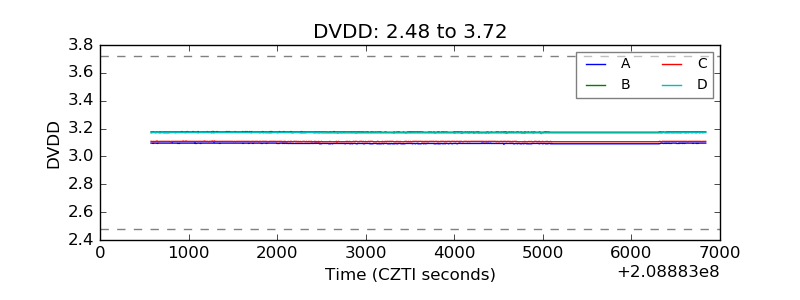 |
| Temperature 1 | 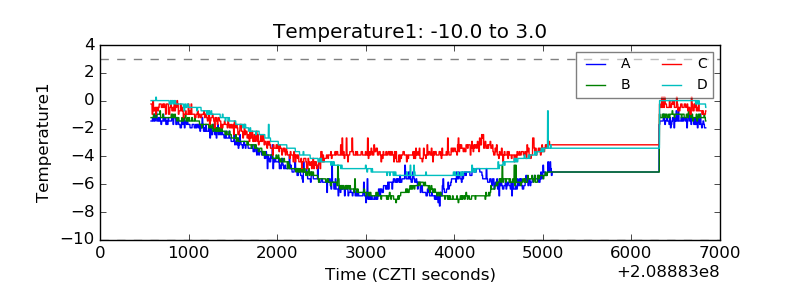 |
| Veto HV Monitor | 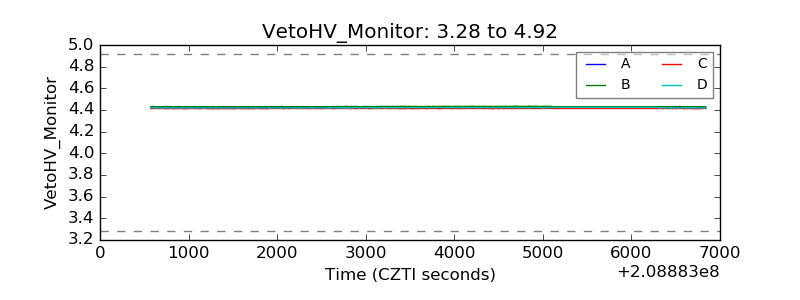 |
| Veto LLD | 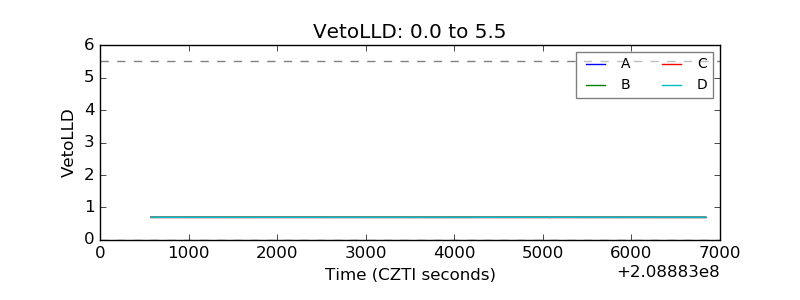 |
| Alpha Counter | 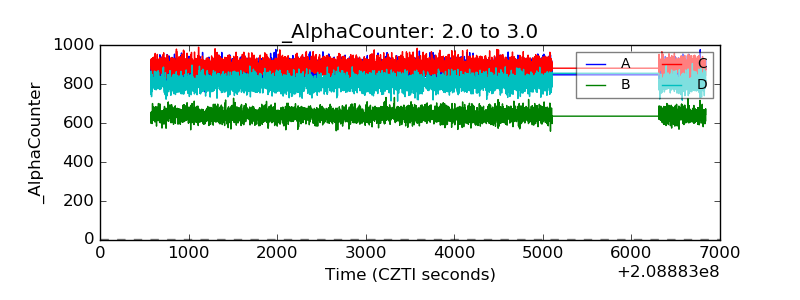 |
| _CPM_Rate | 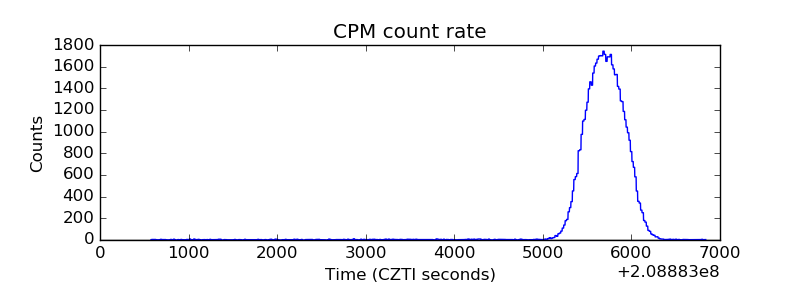 |
| CZT Counter | 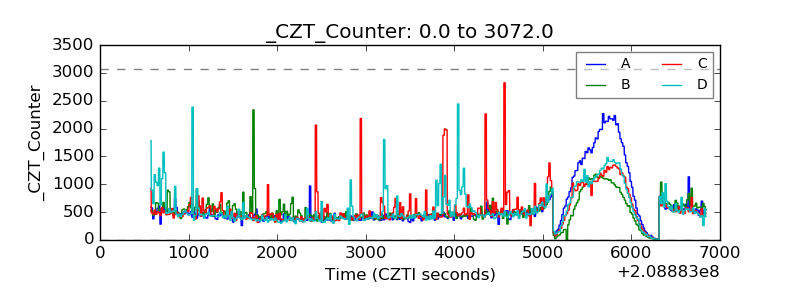 |
| +2.5 Volts monitor |  |
| +5 Volts monitor |  |
| _ROLL_ROT | 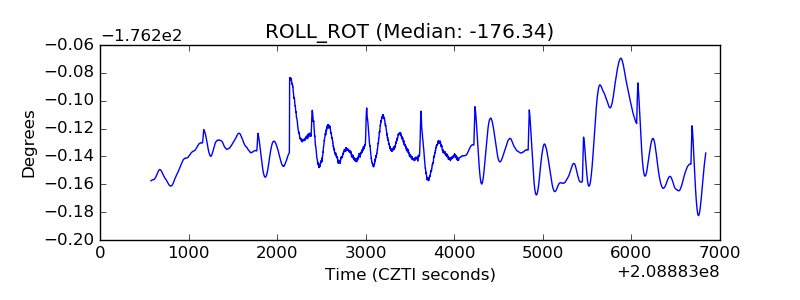 |
| _Roll_DEC | 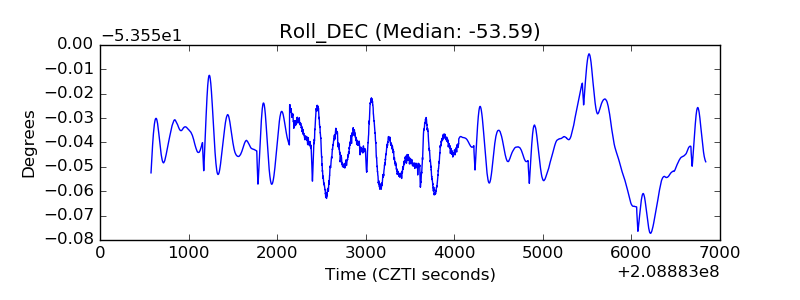 |
| _Roll_RA | 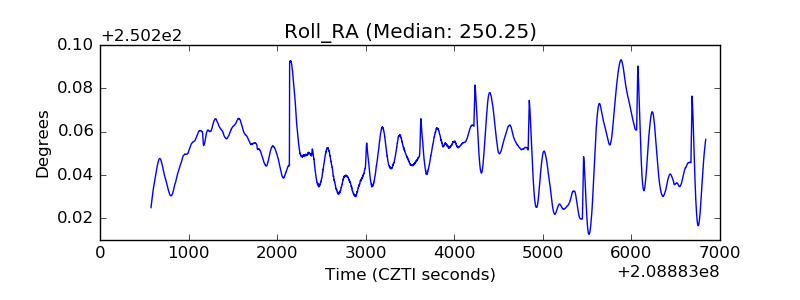 |
| Veto Counter | 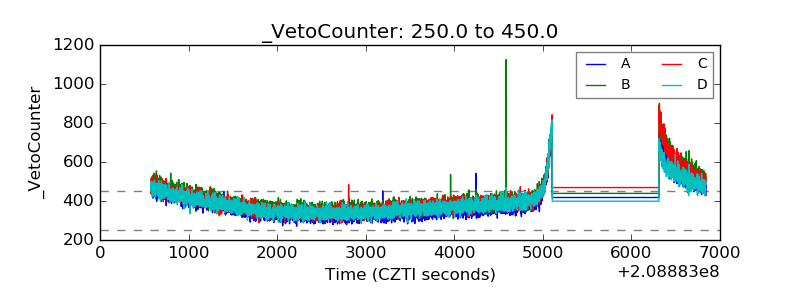 |