| Param | Original file | Final file |
|---|---|---|
| Filename | modeM0/AS1G05_195T01_9000000598_04761cztM0_level2.evt | modeM0/AS1G05_195T01_9000000598_04761cztM0_level2_quad_clean.evt |
| Size (bytes) | 42,186,240 | 10,647,360 |
| Size | 40.2 MB | 10.2 MB |
| Events in quadrant A | 303,924 | 70,593 |
| Events in quadrant B | 345,287 | 70,734 |
| Events in quadrant C | 291,829 | 69,169 |
| Events in quadrant D | 297,170 | 66,660 |
| Mode SS | |||
|---|---|---|---|
| Quadrant | BADHDUFLAG | Total packets | Discarded packets |
| A | 0 | 10 | 0 |
| B | 0 | 10 | 0 |
| C | 0 | 10 | 0 |
| D | 0 | 10 | 0 |
| Mode M9 | |||
|---|---|---|---|
| Quadrant | BADHDUFLAG | Total packets | Discarded packets |
| A | 0 | 3 | 0 |
| B | 0 | 3 | 0 |
| C | 0 | 3 | 0 |
| D | 0 | 4 | 0 |
| Mode M0 | |||
|---|---|---|---|
| Quadrant | BADHDUFLAG | Total packets | Discarded packets |
| A | 0 | 1226 | 1 |
| B | 0 | 1432 | 1 |
| C | 0 | 1172 | 1 |
| D | 0 | 1204 | 1 |
| Quadrant | Total seconds | Saturated seconds | Saturation percentage |
|---|---|---|---|
| A | 530 | 2 | 0.377358% |
| B | 530 | 5 | 0.943396% |
| C | 530 | 9 | 1.698113% |
| D | 530 | 1 | 0.188679% |
Noise dominated data is calculated using 1-second bins in cleaned event files. If a bin has >2000 counts, and if more than 50% of those come from <1% of pixels, then it is considered to be noise-dominated and hence unusable.
| Quadrant | # 1 sec bins | Bins with >0 counts | Bins with >2000 counts | High rate bins dominated by noise | Noise dominated (total time) | Noise dominated (detector-on time) | Marked lightcurve |
|---|---|---|---|---|---|---|---|
| A | 530 | 530 | 0 | 0 | 0.00% | 0.00% | 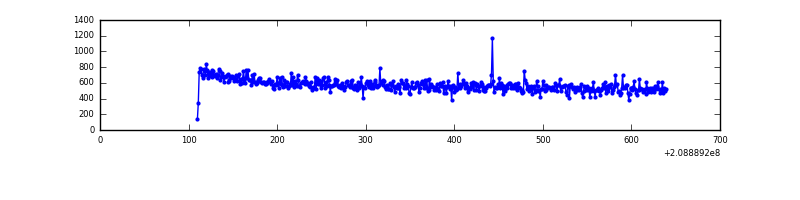 |
| B | 530 | 530 | 0 | 0 | 0.00% | 0.00% | 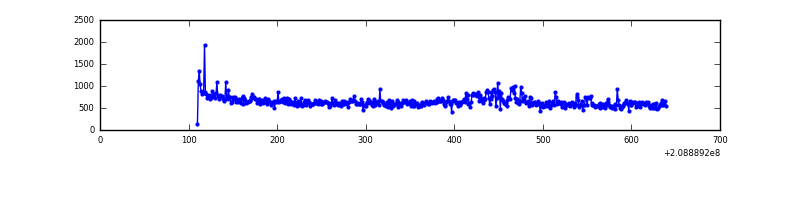 |
| C | 530 | 530 | 0 | 0 | 0.00% | 0.00% | 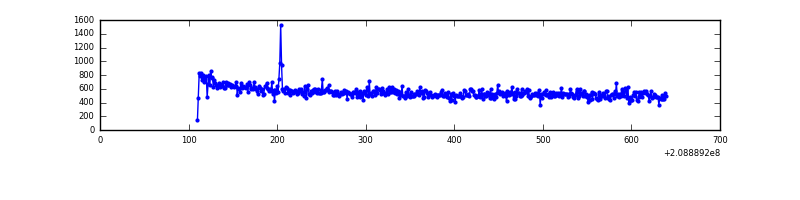 |
| D | 530 | 530 | 0 | 0 | 0.00% | 0.00% | 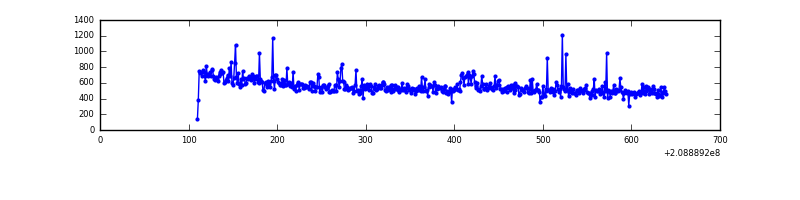 |
Top three noisy pixels from each quadrant. If the there are fewer than three noisy pixels in the level2.evt file, extra rows are filled as -1
| Pixel properties | Quadrant properties | ||||||
|---|---|---|---|---|---|---|---|
| Quadrant | DetID | PixID | Counts | Sigma | Mean | Median | Sigma |
| A | 7 | 16 | 1626 | 85.53 | 78 | 76 | 18.1 |
| A | 15 | 174 | 901 | 45.53 | 78 | 76 | 18.1 |
| A | 12 | 194 | 872 | 43.92 | 78 | 76 | 18.1 |
| B | 15 | 204 | 13510 | 776.91 | 77 | 75 | 17.3 |
| B | 15 | 54 | 10510 | 603.43 | 77 | 75 | 17.3 |
| B | 14 | 167 | 7708 | 441.4 | 77 | 75 | 17.3 |
| C | 14 | 48 | 6004 | 315.4 | 72 | 72 | 18.8 |
| C | 1 | 16 | 3211 | 166.9 | 72 | 72 | 18.8 |
| C | 7 | 159 | 817 | 39.61 | 72 | 72 | 18.8 |
| D | 2 | 234 | 6705 | 331.83 | 74 | 71 | 20.0 |
| D | 13 | 235 | 4535 | 223.29 | 74 | 71 | 20.0 |
| D | 11 | 132 | 3027 | 147.86 | 74 | 71 | 20.0 |
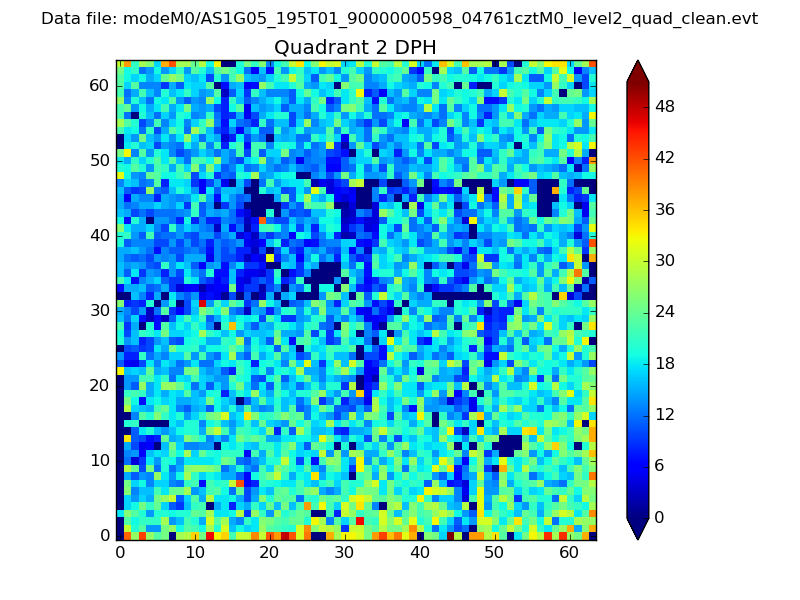
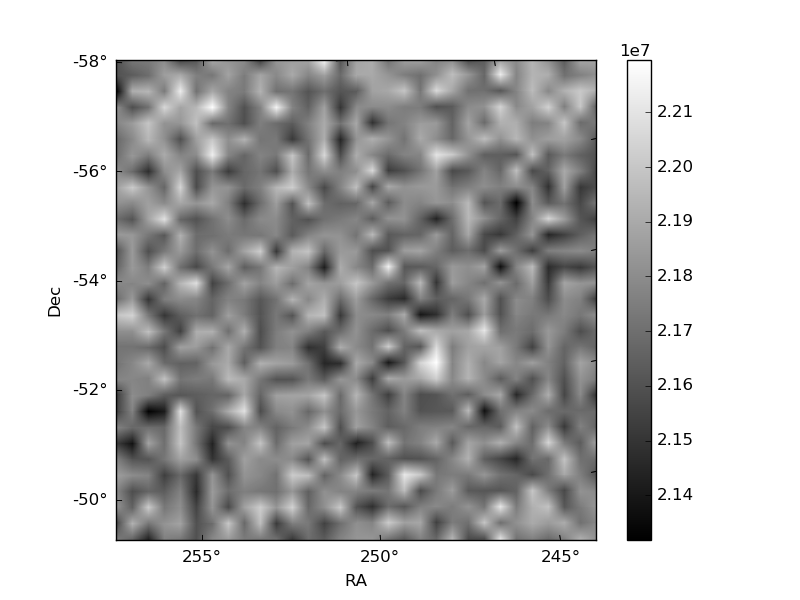
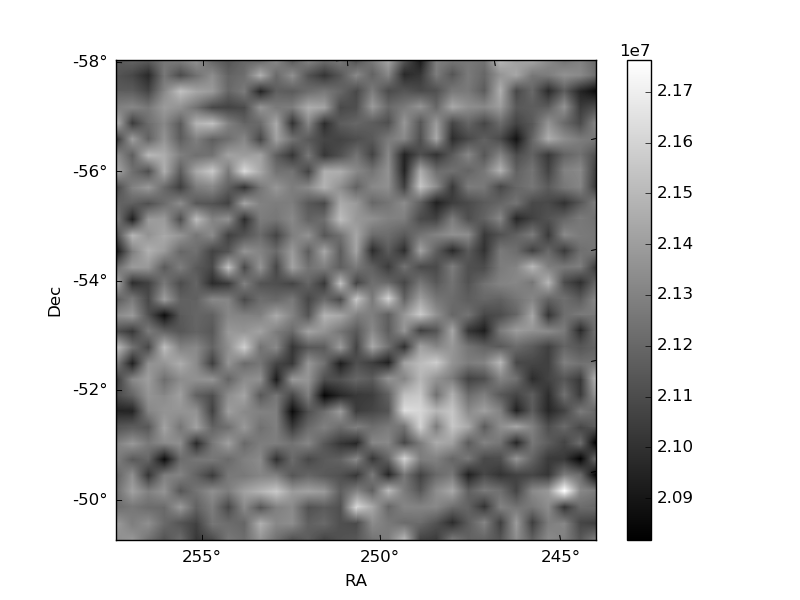
Histogram calculated using DETX and DETY for each event in the final _common_clean file
| Quadrant A | 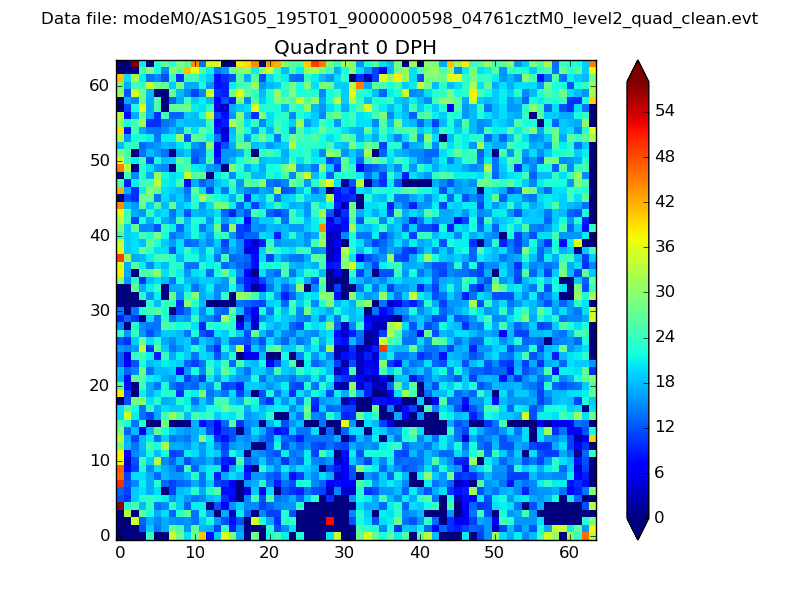 |
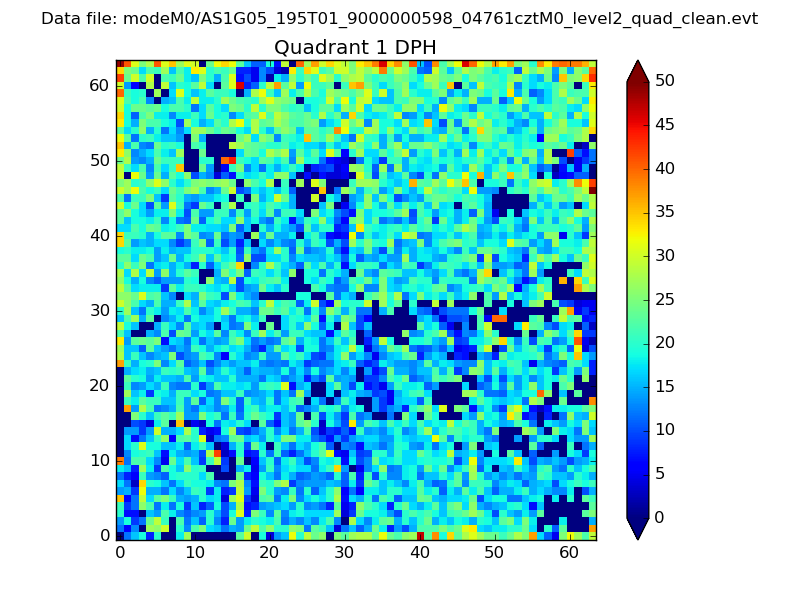 |
Quadrant B |
|---|---|---|---|
| Quadrant D | 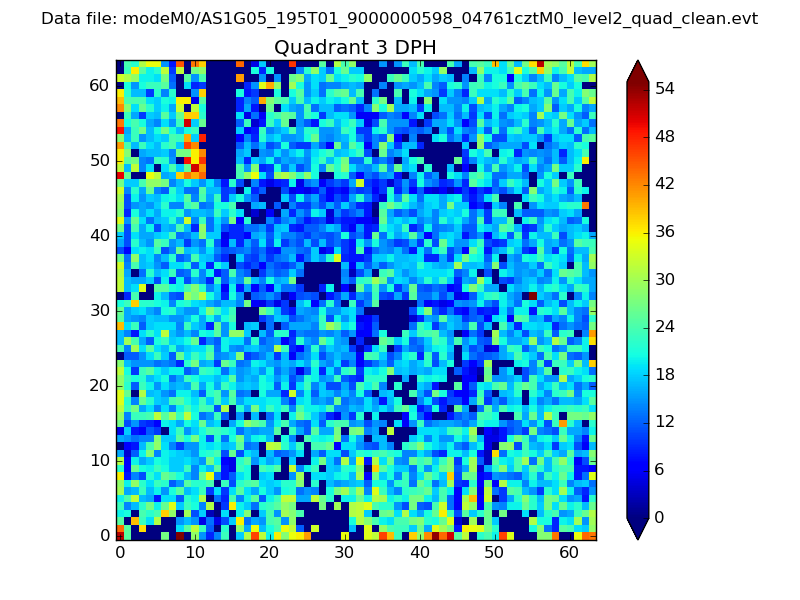 |
 |
Quadrant C |
| Plot type | Count rate plots | Images |
|---|---|---|
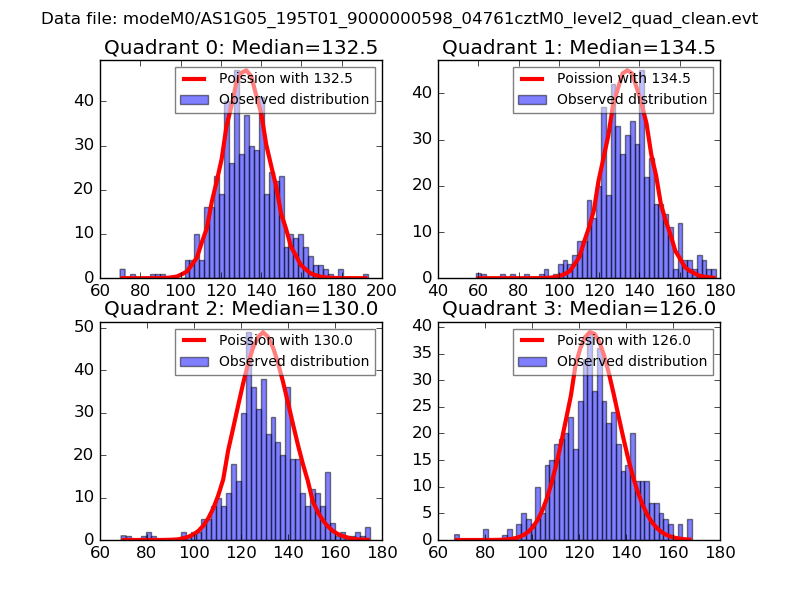
| Comparison with Poisson distribution Blue bars denote a histogram of data divided into 1 sec bins. Red curve is a Poisson curve with rate = median count rate of data. |
 |
 |
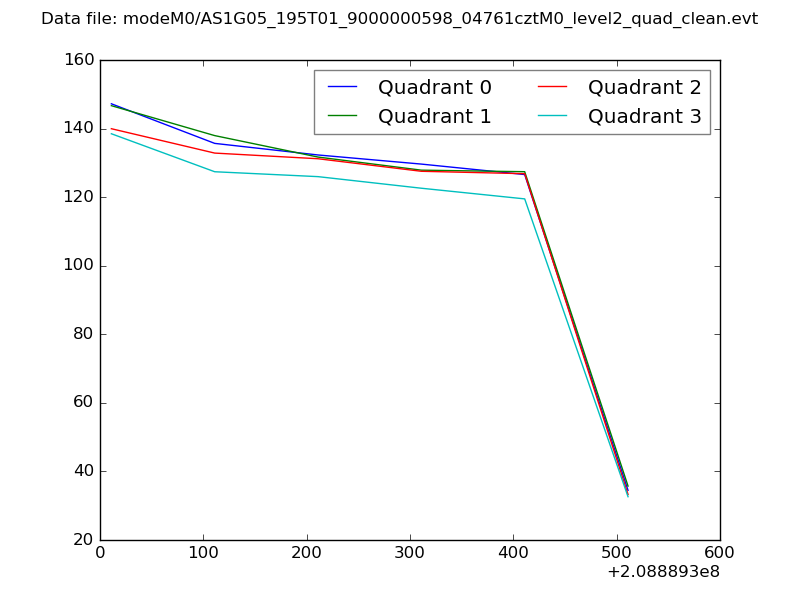
| Quadrant-wise count rates Data is divided into 100 sec bins |
 |
|
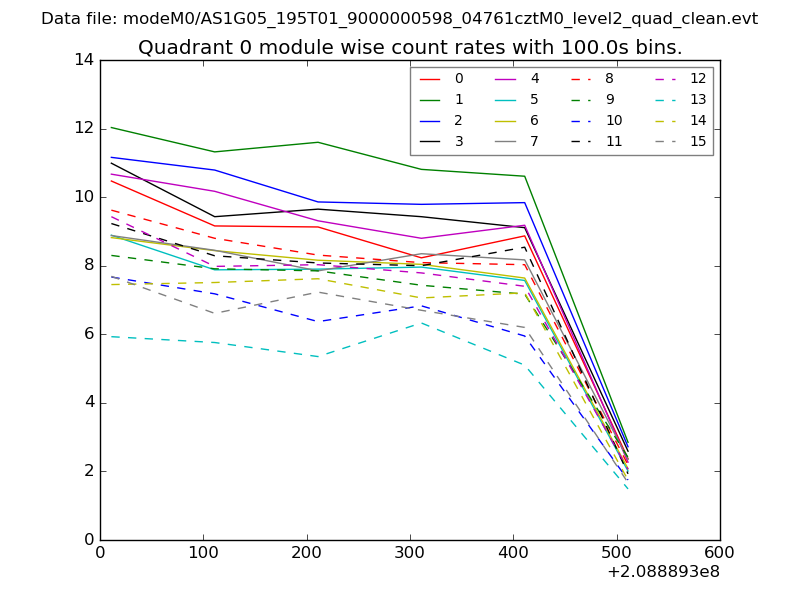
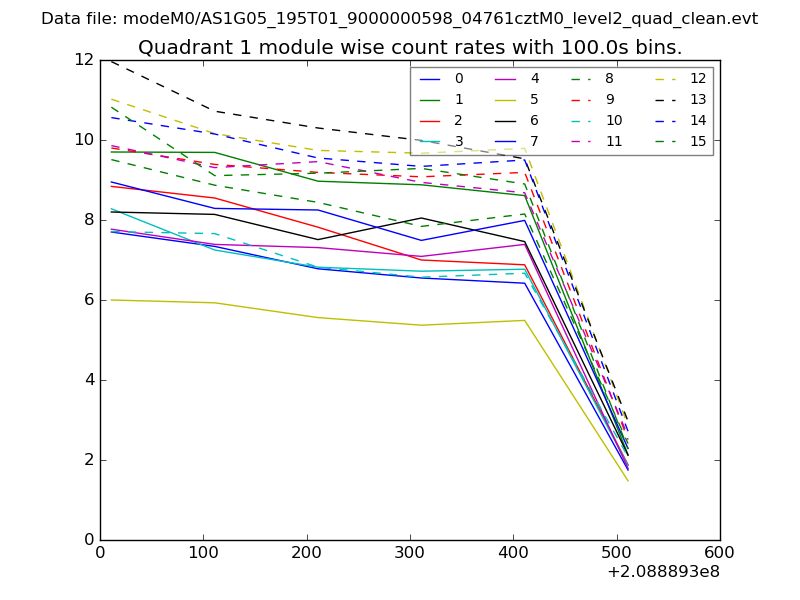
| Module-wise count rates for Quadrant A Data is divided into 100 sec bins |
 |
 |
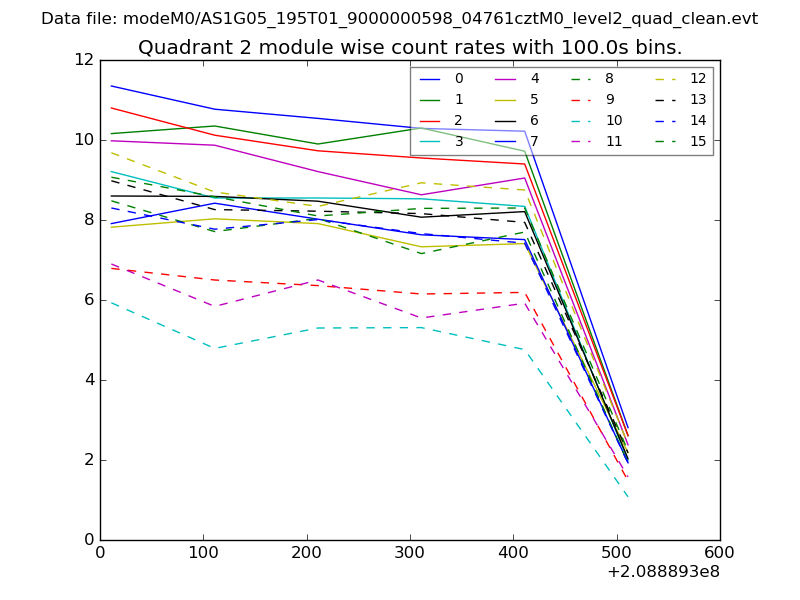
| Module-wise count rates for Quadrant B Data is divided into 100 sec bins |
 |
 |
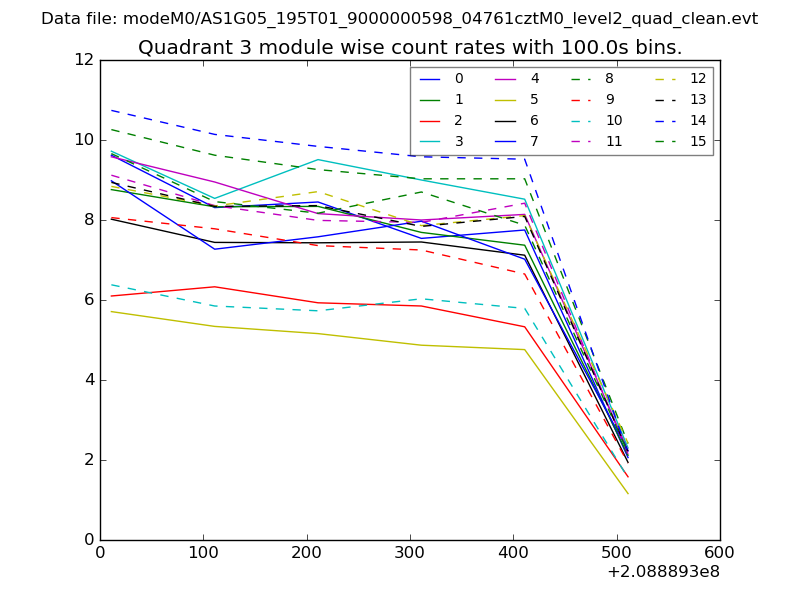
| Module-wise count rates for Quadrant C Data is divided into 100 sec bins |
 |
 |
| Module-wise count rates for Quadrant D Data is divided into 100 sec bins |
 |
 |
| Parameter | Plot |
|---|---|
| CZT HV Monitor | 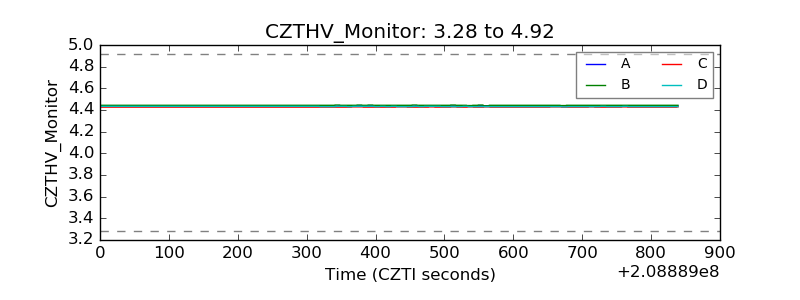 |
| D_VDD | 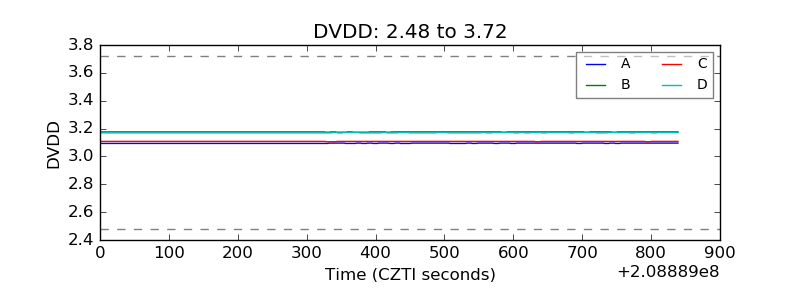 |
| Temperature 1 | 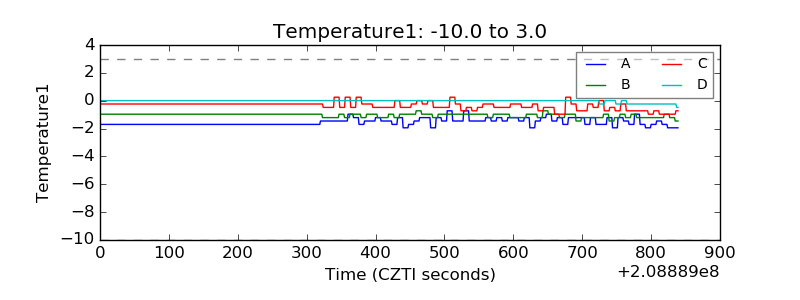 |
| Veto HV Monitor | 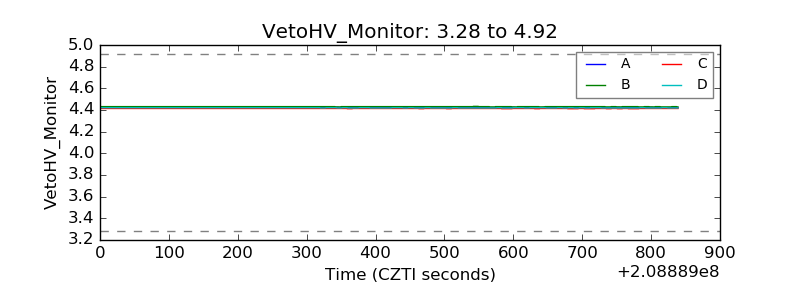 |
| Veto LLD | 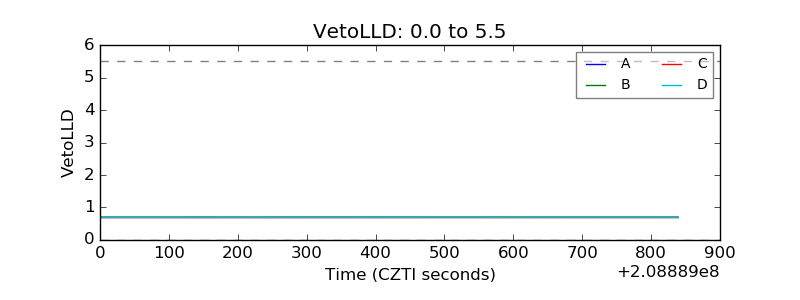 |
| Alpha Counter | 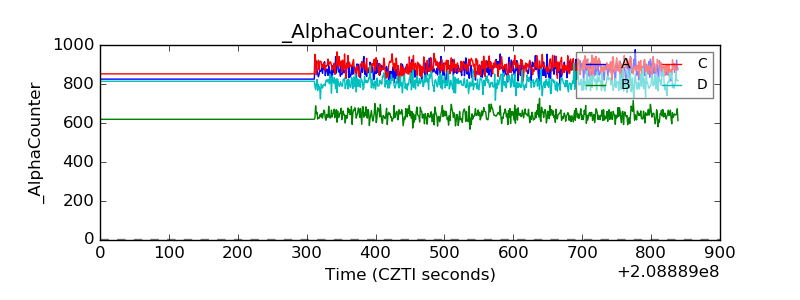 |
| _CPM_Rate | 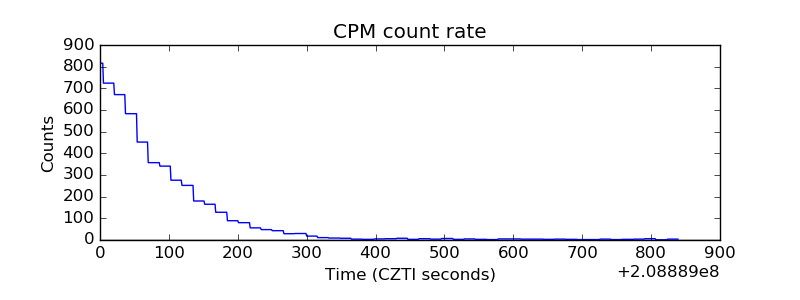 |
| CZT Counter | 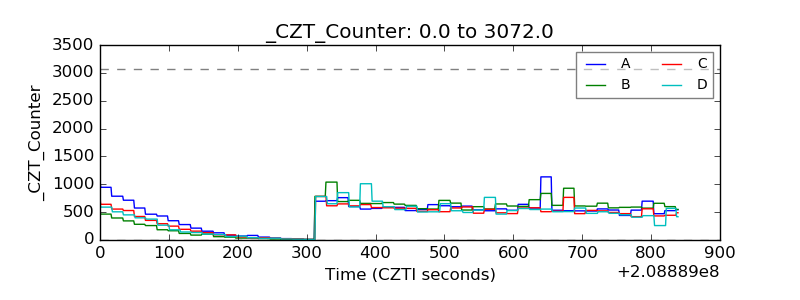 |
| +2.5 Volts monitor |  |
| +5 Volts monitor |  |
| _ROLL_ROT | 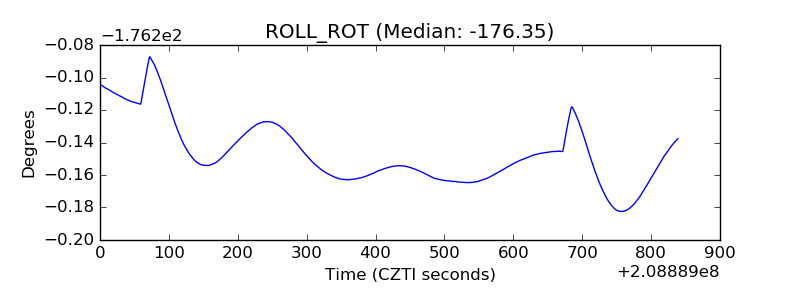 |
| _Roll_DEC | 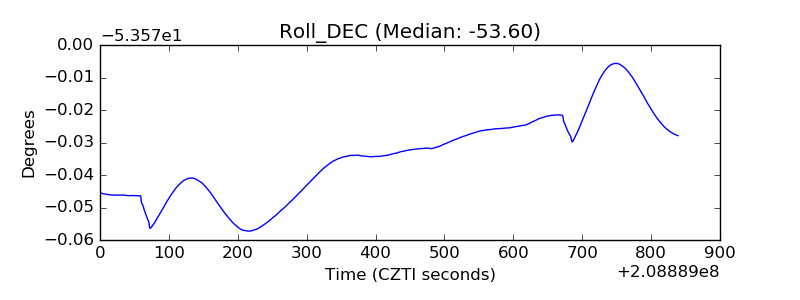 |
| _Roll_RA | 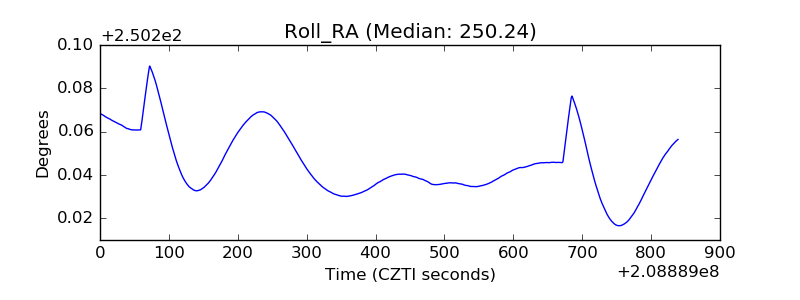 |
| Veto Counter | 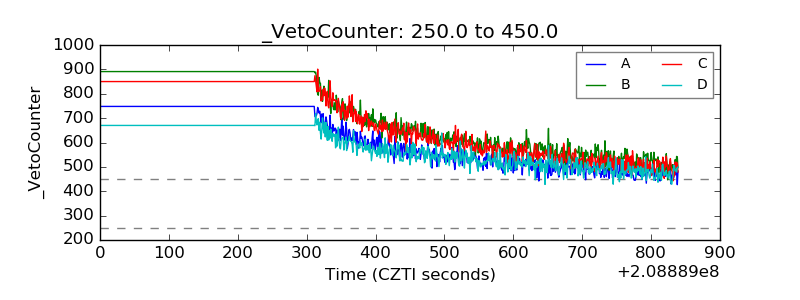 |