| Param | Original file | Final file |
|---|---|---|
| Filename | modeM0/AS1G05_207T01_9000000596cztM0_level2.fits | modeM0/AS1G05_207T01_9000000596cztM0_level2_quad_clean.evt |
| Size (bytes) | 369,619,200 | 373,501,440 |
| Size | 352.5 MB | 356.2 MB |
| Events in quadrant A | 2,244,452 | 2,297,287 |
| Events in quadrant B | 2,177,892 | 2,323,359 |
| Events in quadrant C | 2,035,732 | 1,854,461 |
| Events in quadrant D | 1,895,392 | 1,999,258 |
| Mode M0 | |||
|---|---|---|---|
| Quadrant | BADHDUFLAG | Total packets | Discarded packets |
| A | 0 | 85335 | 0 |
| B | 0 | 89640 | 0 |
| C | 0 | 136412 | 0 |
| D | 0 | 97208 | 0 |
| Mode SS | |||
|---|---|---|---|
| Quadrant | BADHDUFLAG | Total packets | Discarded packets |
| A | 0 | 846 | 0 |
| B | 0 | 846 | 0 |
| C | 0 | 846 | 0 |
| D | 0 | 846 | 0 |
| Mode M9 | |||
|---|---|---|---|
| Quadrant | BADHDUFLAG | Total packets | Discarded packets |
| A | 0 | 59 | 0 |
| B | 0 | 59 | 0 |
| C | 0 | 59 | 0 |
| D | 0 | 59 | 0 |
| Quadrant | Total seconds | Saturated seconds | Saturation percentage |
|---|---|---|---|
| A | 41304 | 696 | 1.685067% |
| B | 41304 | 881 | 2.132965% |
| C | 41304 | 5980 | 14.478017% |
| D | 41304 | 1584 | 3.834980% |
Noise dominated data is calculated using 1-second bins in cleaned event files. If a bin has >2000 counts, and if more than 50% of those come from <1% of pixels, then it is considered to be noise-dominated and hence unusable.
| Quadrant | # 1 sec bins | Bins with >0 counts | Bins with >2000 counts | High rate bins dominated by noise | Noise dominated (total time) | Noise dominated (detector-on time) | Marked lightcurve |
|---|---|---|---|---|---|---|---|
| A | 47374 | 41300 | 0 | 0 | 0.00% | 0.00% |  |
| B | 47374 | 41300 | 0 | 0 | 0.00% | 0.00% |  |
| C | 47374 | 41018 | 0 | 0 | 0.00% | 0.00% |  |
| D | 47374 | 41197 | 0 | 0 | 0.00% | 0.00% |  |
Top three noisy pixels from each quadrant. If the there are fewer than three noisy pixels in the level2.evt file, extra rows are filled as -1
| Pixel properties | Quadrant properties | ||||||
|---|---|---|---|---|---|---|---|
| Quadrant | DetID | PixID | Counts | Sigma | Mean | Median | Sigma |
| A | 0 | 29 | 2193 | 10.9 | 581 | 540 | 151.7 |
| A | 14 | 188 | 2174 | 10.77 | 581 | 540 | 151.7 |
| A | 7 | 110 | 1875 | 8.8 | 581 | 540 | 151.7 |
| B | 2 | 9 | 1894 | 11.34 | 573 | 543 | 119.1 |
| B | 12 | 226 | 1553 | 8.48 | 573 | 543 | 119.1 |
| B | 5 | 128 | 1525 | 8.24 | 573 | 543 | 119.1 |
| C | 1 | 80 | 1531 | 7.15 | 537 | 495 | 144.8 |
| C | 1 | 81 | 1527 | 7.13 | 537 | 495 | 144.8 |
| C | 3 | 158 | 1353 | 5.92 | 537 | 495 | 144.8 |
| D | 11 | 82 | 1444 | 6.55 | 540 | 489 | 145.8 |
| D | 3 | 14 | 1382 | 6.12 | 540 | 489 | 145.8 |
| D | 6 | 231 | 1374 | 6.07 | 540 | 489 | 145.8 |
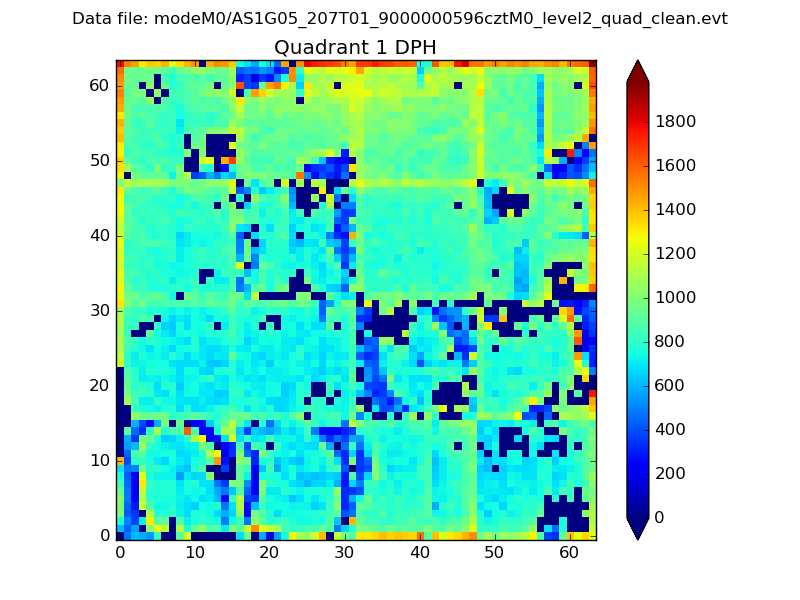
Histogram calculated using DETX and DETY for each event in the final _common_clean file
| Quadrant A |  |
 |
Quadrant B |
|---|---|---|---|
| Quadrant D |  |
 |
Quadrant C |
| Plot type | Count rate plots | Images |
|---|---|---|
| Comparison with Poisson distribution Blue bars denote a histogram of data divided into 1 sec bins. Red curve is a Poisson curve with rate = median count rate of data. |
 |
 |
| Quadrant-wise count rates Data is divided into 100 sec bins |
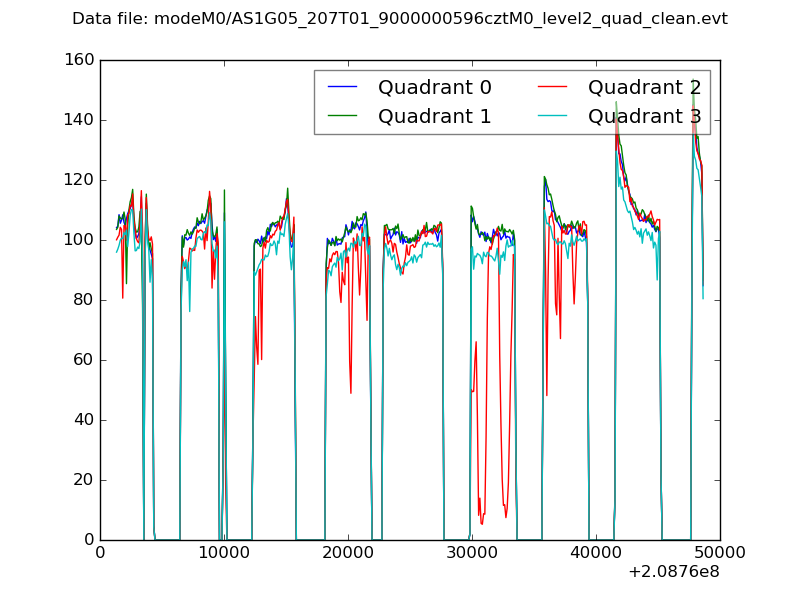 |
|
| Module-wise count rates for Quadrant A Data is divided into 100 sec bins |
 |
 |
| Module-wise count rates for Quadrant B Data is divided into 100 sec bins |
 |
 |
| Module-wise count rates for Quadrant C Data is divided into 100 sec bins |
 |
 |
| Module-wise count rates for Quadrant D Data is divided into 100 sec bins |
 |
 |
| Parameter | Plot |
|---|---|
| CZT HV Monitor |  |
| D_VDD | 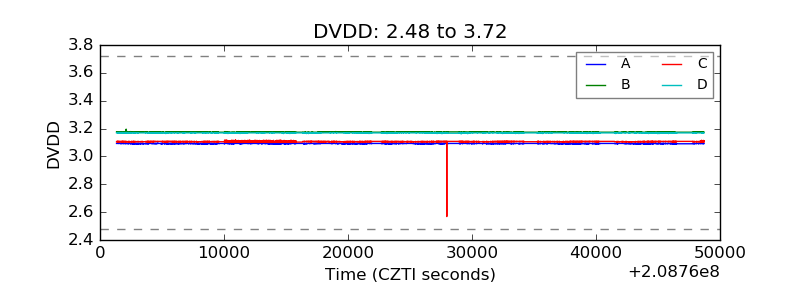 |
| Temperature 1 |  |
| Veto HV Monitor |  |
| Veto LLD | 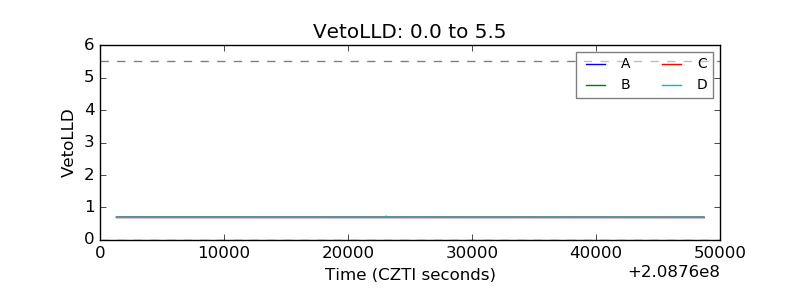 |
| Alpha Counter |  |
| _CPM_Rate |  |
| CZT Counter | 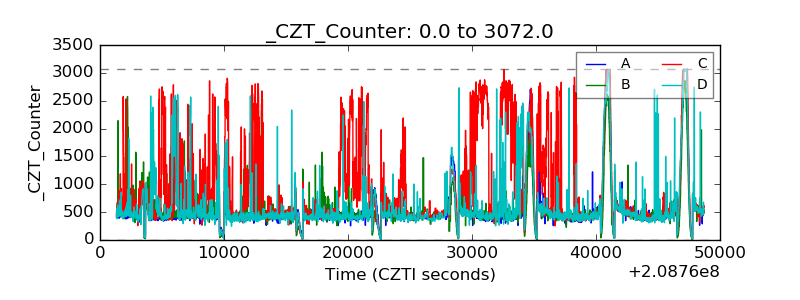 |
| +2.5 Volts monitor |  |
| +5 Volts monitor |  |
| _ROLL_ROT | 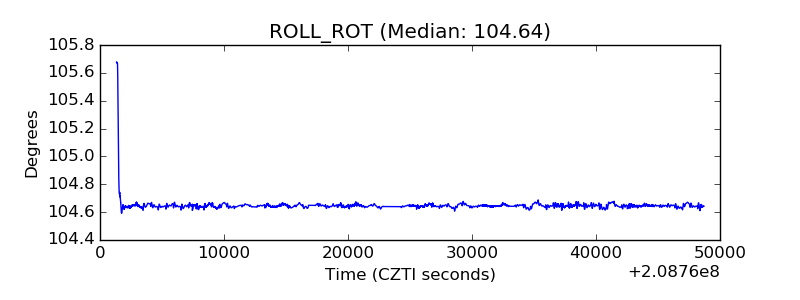 |
| _Roll_DEC |  |
| _Roll_RA | 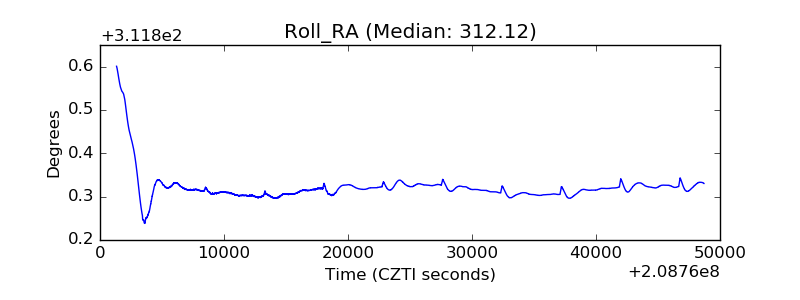 |
| Veto Counter |  |