| Param | Original file | Final file |
|---|---|---|
| Filename | modeM0/AS1G05_207T01_9000000596_04741cztM0_level2.evt | modeM0/AS1G05_207T01_9000000596_04741cztM0_level2_quad_clean.evt |
| Size (bytes) | 1,478,776,320 | 177,721,920 |
| Size | 1.4 GB | 169.5 MB |
| Events in quadrant A | 8,062,726 | 1,067,509 |
| Events in quadrant B | 9,299,666 | 1,080,754 |
| Events in quadrant C | 16,701,021 | 982,445 |
| Events in quadrant D | 9,503,992 | 1,007,440 |
| Mode M0 | |||
|---|---|---|---|
| Quadrant | BADHDUFLAG | Total packets | Discarded packets |
| A | 0 | 36703 | 4 |
| B | 0 | 39445 | 3 |
| C | 0 | 61420 | 3 |
| D | 0 | 41395 | 3 |
| Mode SS | |||
|---|---|---|---|
| Quadrant | BADHDUFLAG | Total packets | Discarded packets |
| A | 0 | 368 | 0 |
| B | 0 | 368 | 0 |
| C | 0 | 368 | 0 |
| D | 0 | 368 | 0 |
| Mode M9 | |||
|---|---|---|---|
| Quadrant | BADHDUFLAG | Total packets | Discarded packets |
| A | 0 | 16 | 0 |
| B | 0 | 16 | 0 |
| C | 0 | 16 | 0 |
| D | 0 | 16 | 0 |
| Quadrant | Total seconds | Saturated seconds | Saturation percentage |
|---|---|---|---|
| A | 18031 | 241 | 1.336587% |
| B | 18031 | 291 | 1.613887% |
| C | 18031 | 2385 | 13.227220% |
| D | 18031 | 544 | 3.017026% |
Noise dominated data is calculated using 1-second bins in cleaned event files. If a bin has >2000 counts, and if more than 50% of those come from <1% of pixels, then it is considered to be noise-dominated and hence unusable.
| Quadrant | # 1 sec bins | Bins with >0 counts | Bins with >2000 counts | High rate bins dominated by noise | Noise dominated (total time) | Noise dominated (detector-on time) | Marked lightcurve |
|---|---|---|---|---|---|---|---|
| A | 19696 | 18034 | 0 | 0 | 0.00% | 0.00% | 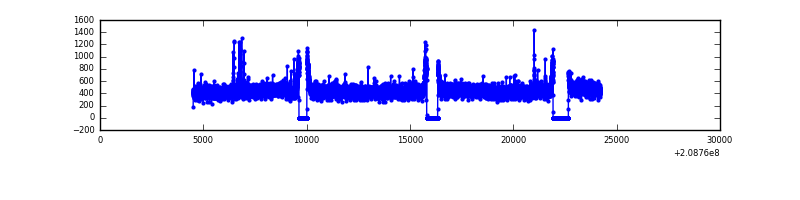 |
| B | 19696 | 18033 | 27 | 27 | 0.14% | 0.15% | 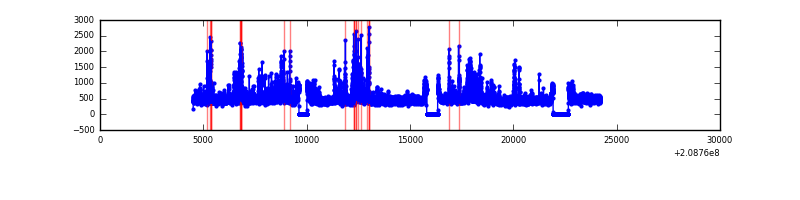 |
| C | 19696 | 18034 | 1891 | 1891 | 9.60% | 10.49% | 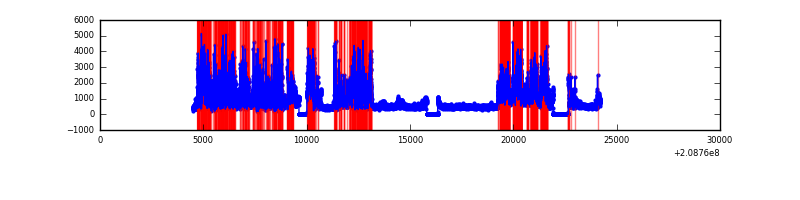 |
| D | 19696 | 18034 | 325 | 325 | 1.65% | 1.80% | 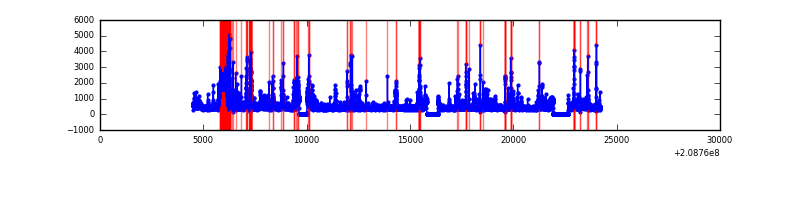 |
Top three noisy pixels from each quadrant. If the there are fewer than three noisy pixels in the level2.evt file, extra rows are filled as -1
| Pixel properties | Quadrant properties | ||||||
|---|---|---|---|---|---|---|---|
| Quadrant | DetID | PixID | Counts | Sigma | Mean | Median | Sigma |
| A | 7 | 16 | 48415 | 108.85 | 2081 | 2033 | 426.1 |
| A | 0 | 226 | 20427 | 43.17 | 2081 | 2033 | 426.1 |
| A | 12 | 194 | 20215 | 42.67 | 2081 | 2033 | 426.1 |
| B | 14 | 167 | 851546 | 2087.66 | 2100 | 2044 | 406.9 |
| B | 4 | 80 | 231040 | 562.76 | 2100 | 2044 | 406.9 |
| B | 15 | 204 | 100806 | 242.71 | 2100 | 2044 | 406.9 |
| C | 14 | 48 | 8963481 | 20083.87 | 1917 | 1925 | 446.2 |
| C | 8 | 208 | 174667 | 387.13 | 1917 | 1925 | 446.2 |
| C | 12 | 4 | 28167 | 58.81 | 1917 | 1925 | 446.2 |
| D | 13 | 53 | 776130 | 1613.12 | 1990 | 1927 | 479.9 |
| D | 1 | 31 | 348682 | 722.5 | 1990 | 1927 | 479.9 |
| D | 13 | 239 | 286021 | 591.94 | 1990 | 1927 | 479.9 |
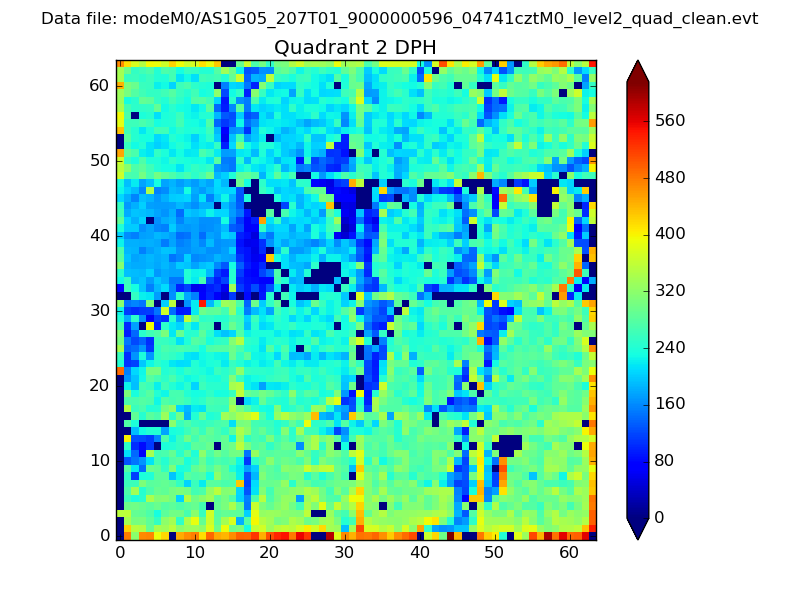
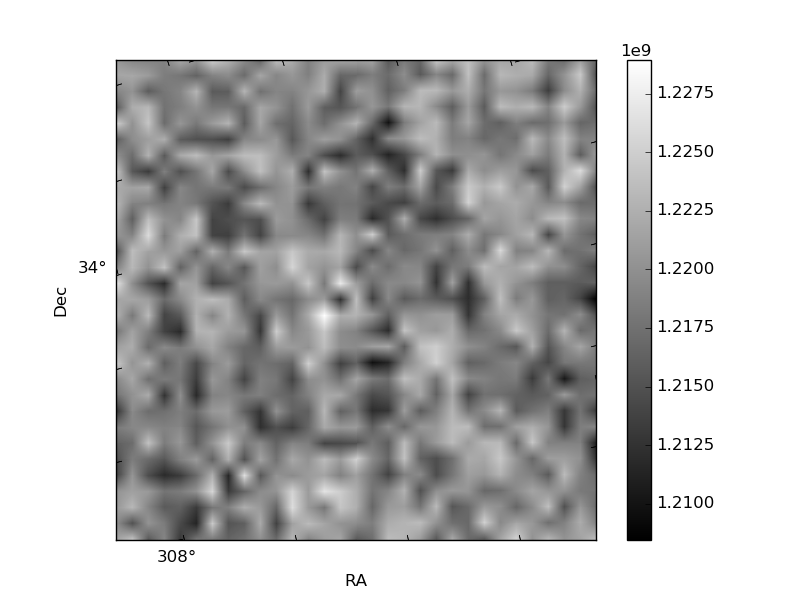
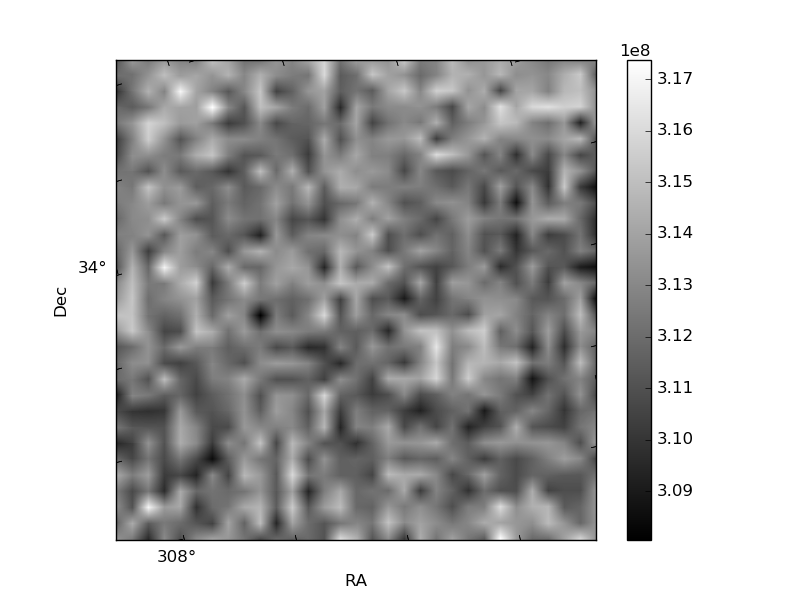
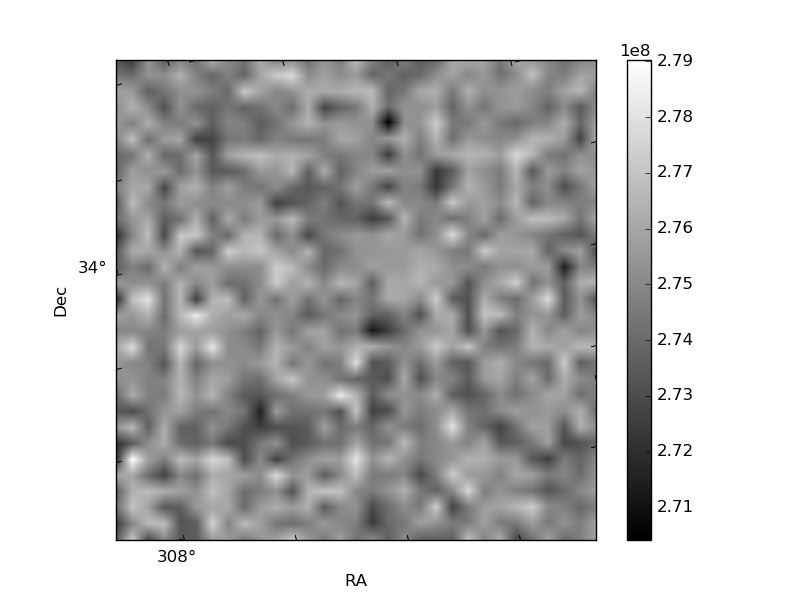
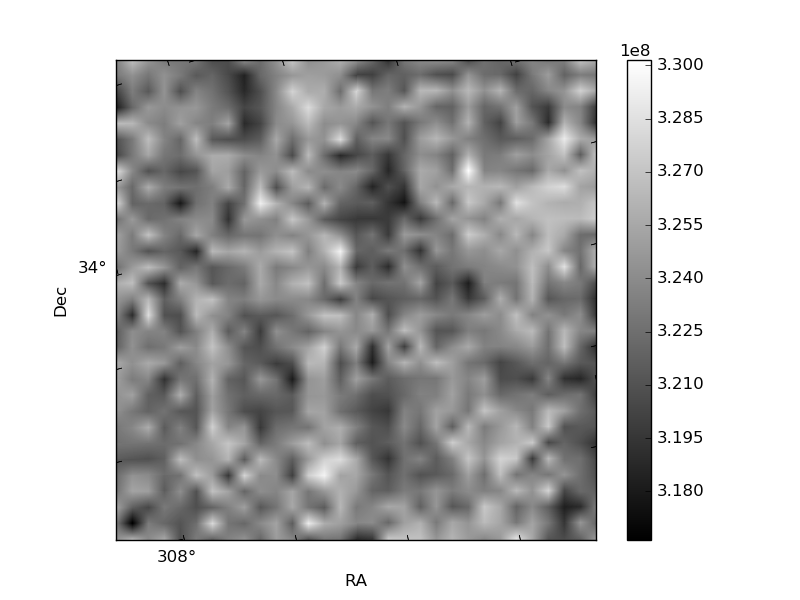
Histogram calculated using DETX and DETY for each event in the final _common_clean file
| Quadrant A | 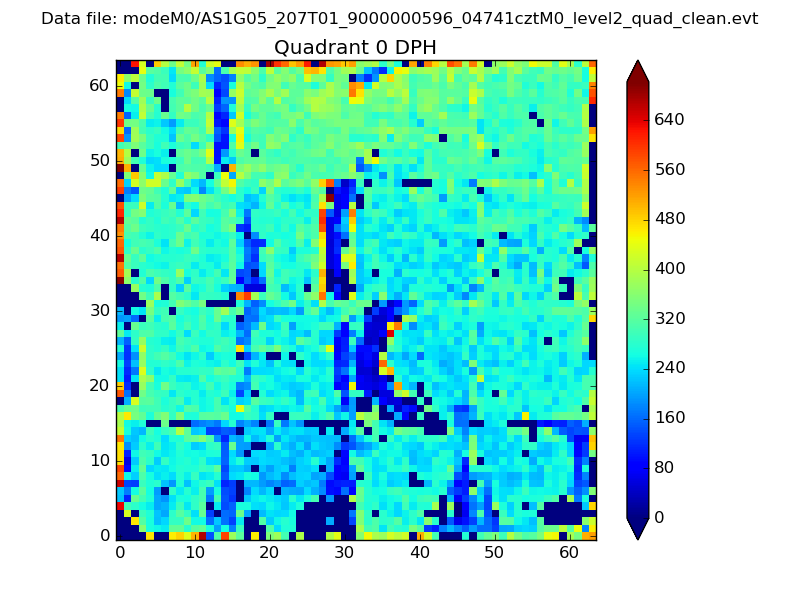 |
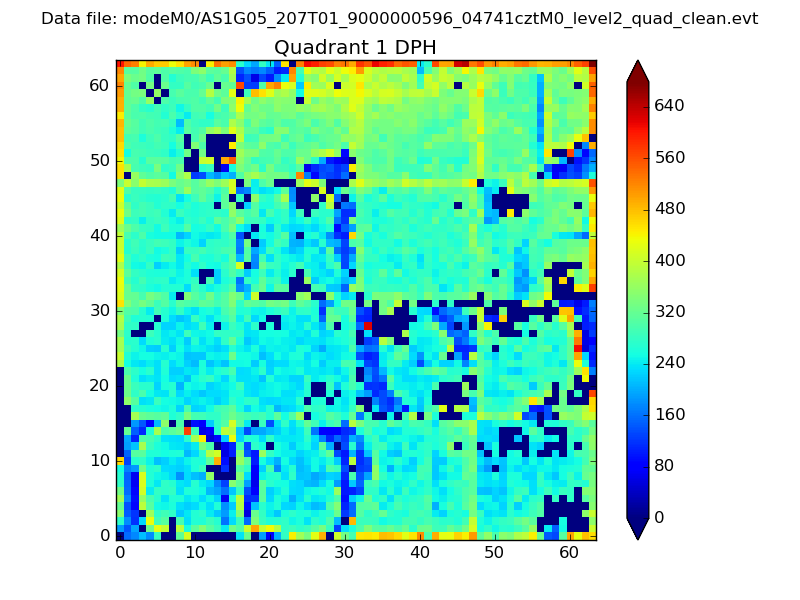 |
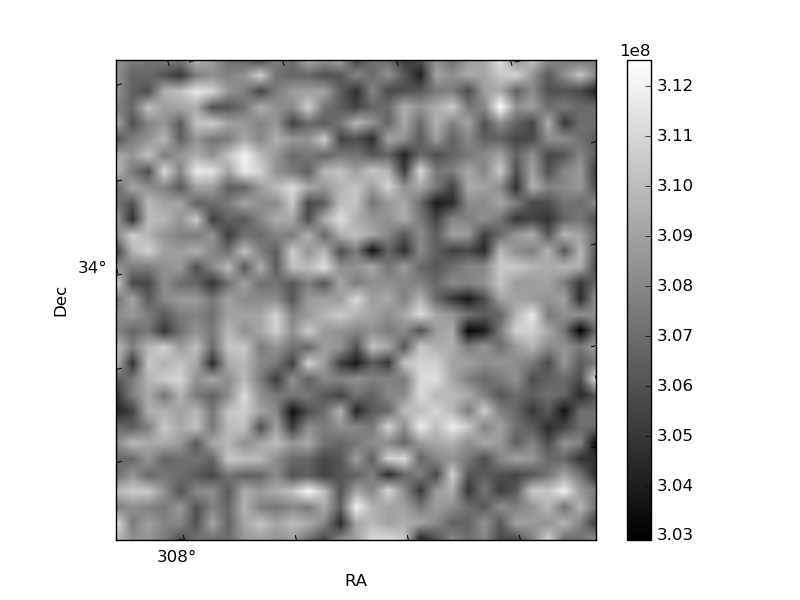
Quadrant B |
|---|---|---|---|
| Quadrant D | 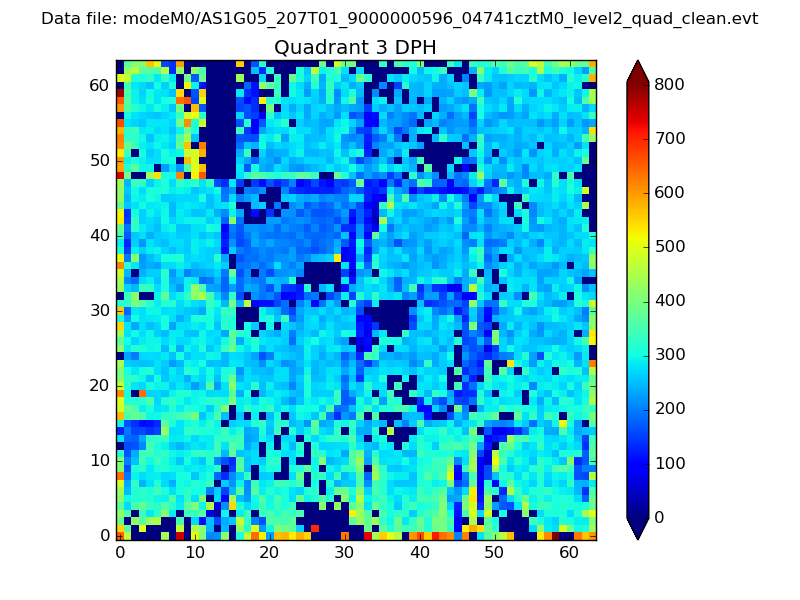 |
 |
Quadrant C |
| Plot type | Count rate plots | Images |
|---|---|---|
| Comparison with Poisson distribution Blue bars denote a histogram of data divided into 1 sec bins. Red curve is a Poisson curve with rate = median count rate of data. |
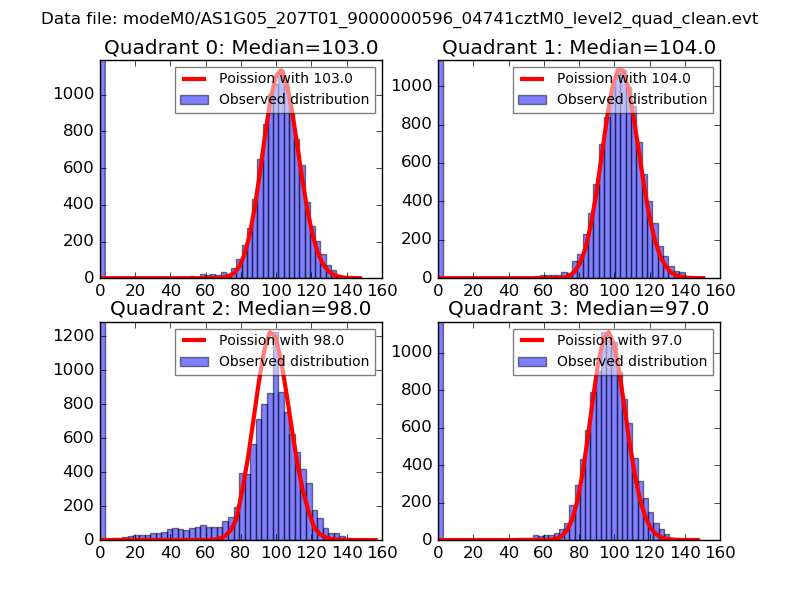 |
 |
| Quadrant-wise count rates Data is divided into 100 sec bins |
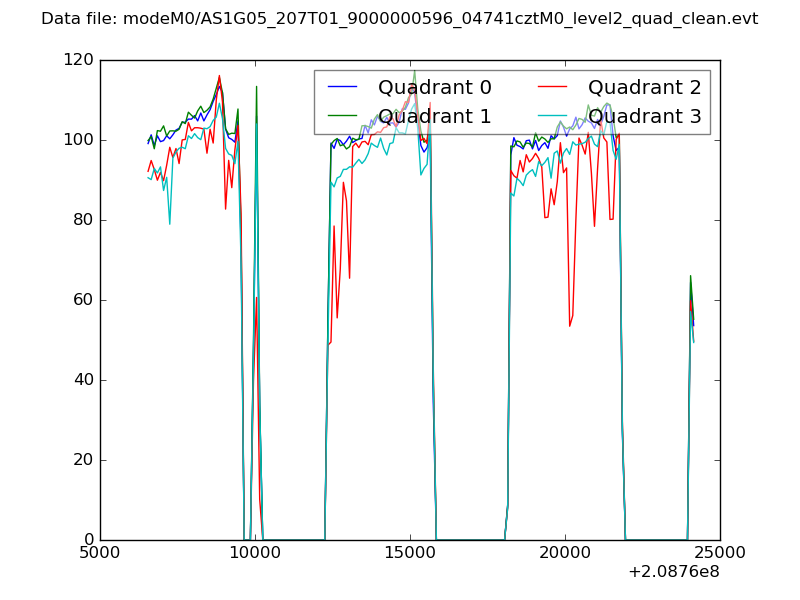 |
|
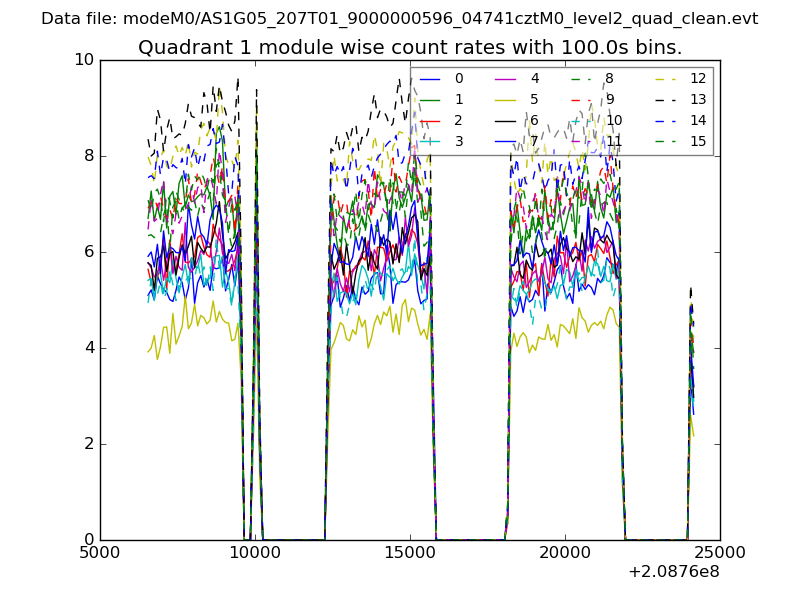
| Module-wise count rates for Quadrant A Data is divided into 100 sec bins |
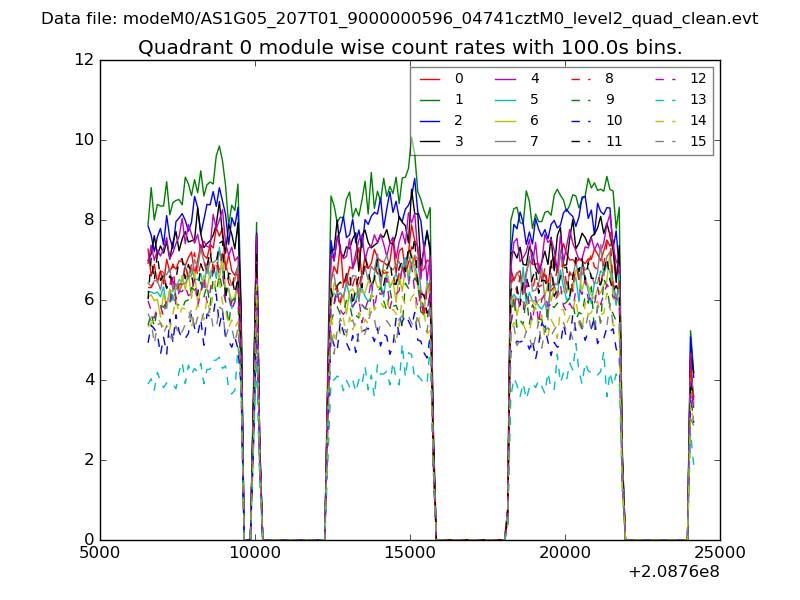 |
 |
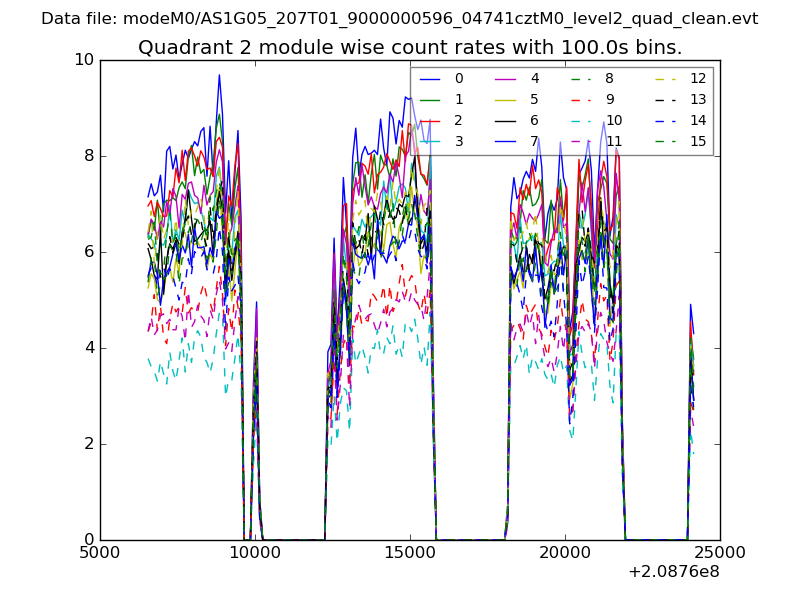
| Module-wise count rates for Quadrant B Data is divided into 100 sec bins |
 |
 |
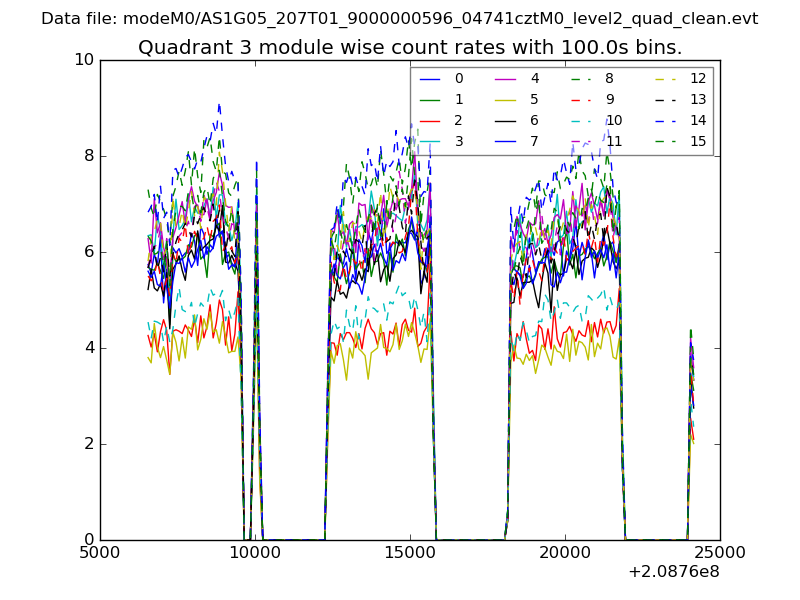
| Module-wise count rates for Quadrant C Data is divided into 100 sec bins |
 |
 |
| Module-wise count rates for Quadrant D Data is divided into 100 sec bins |
 |
 |
| Parameter | Plot |
|---|---|
| CZT HV Monitor | 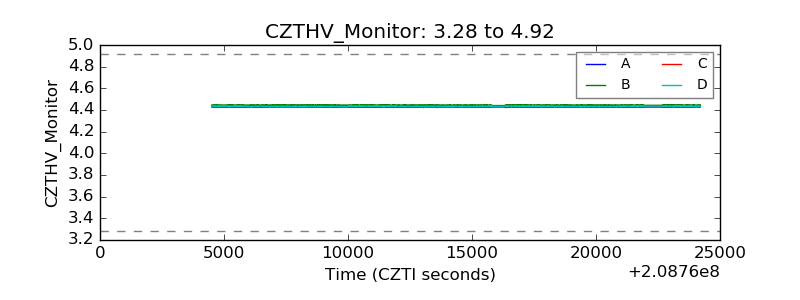 |
| D_VDD | 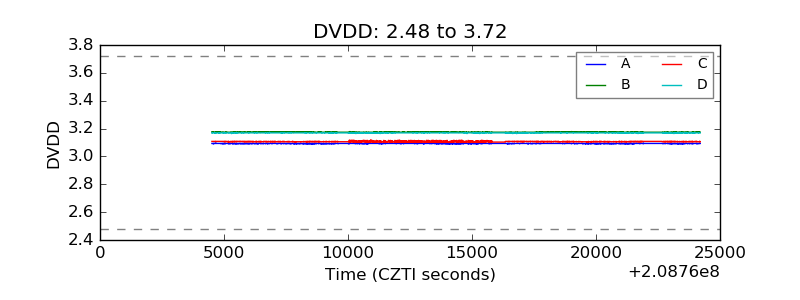 |
| Temperature 1 | 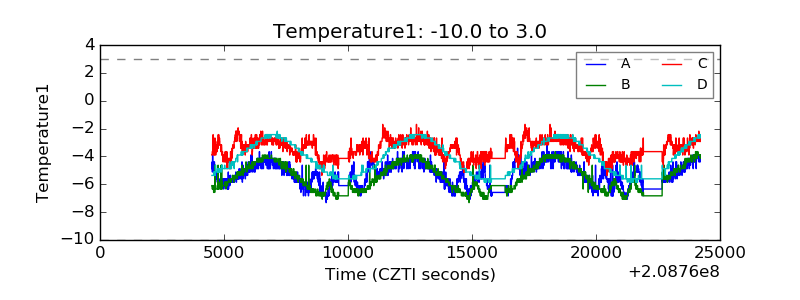 |
| Veto HV Monitor | 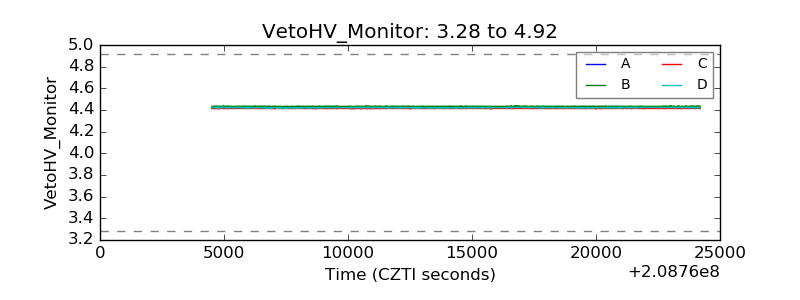 |
| Veto LLD | 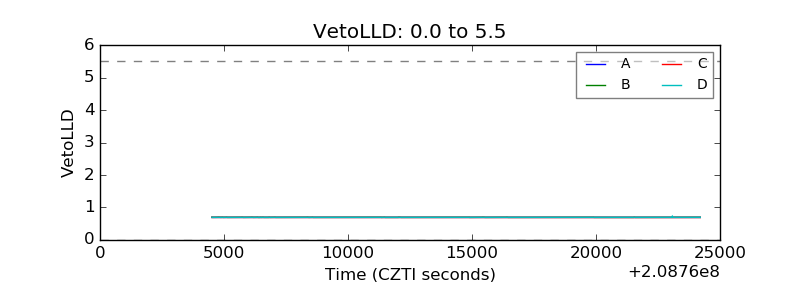 |
| Alpha Counter | 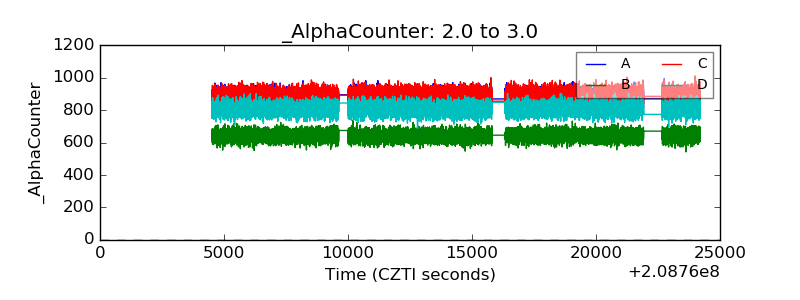 |
| _CPM_Rate | 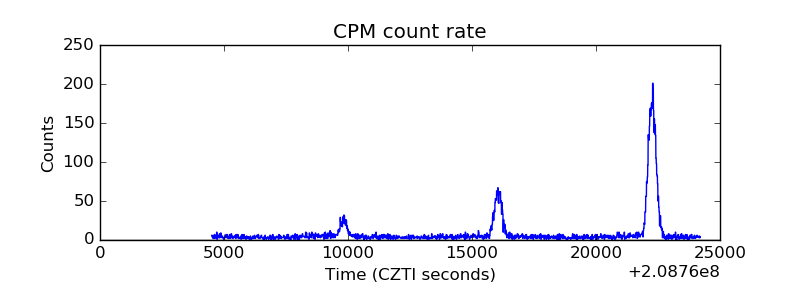 |
| CZT Counter | 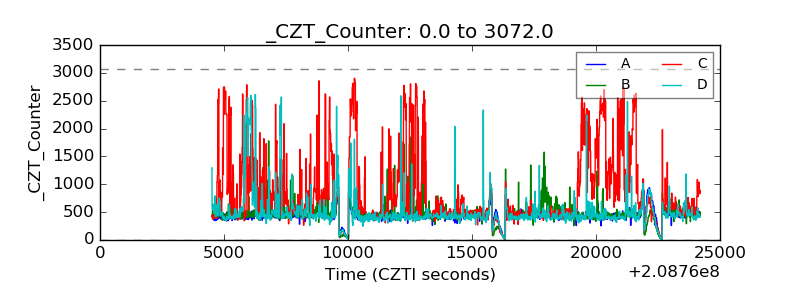 |
| +2.5 Volts monitor | 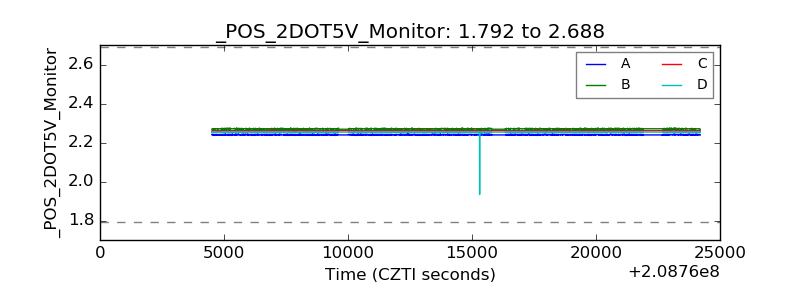 |
| +5 Volts monitor | 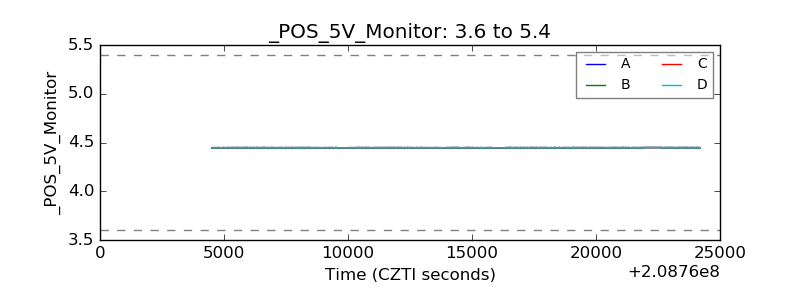 |
| _ROLL_ROT | 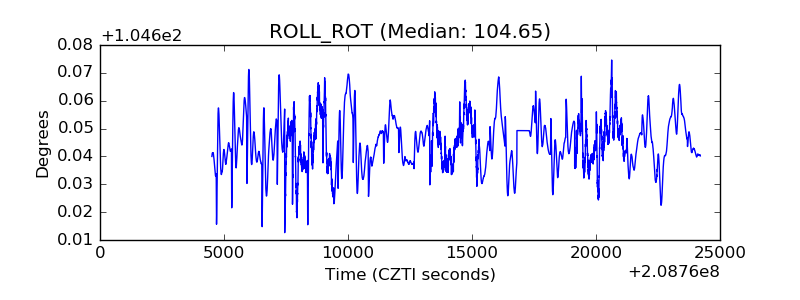 |
| _Roll_DEC | 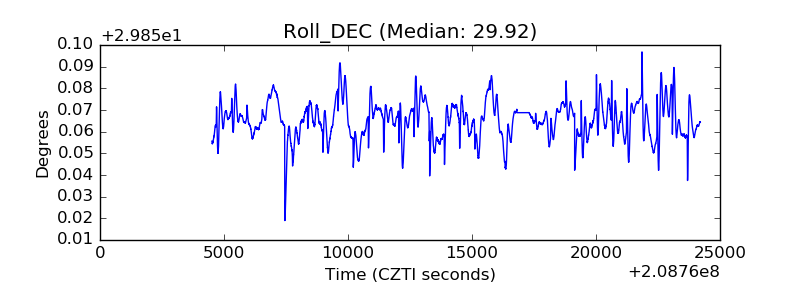 |
| _Roll_RA |  |
| Veto Counter | 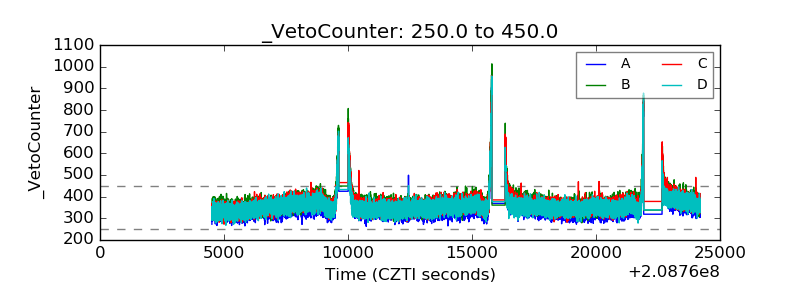 |