| Param | Original file | Final file |
|---|---|---|
| Filename | modeM0/AS1G05_207T01_9000000596_04744cztM0_level2.evt | modeM0/AS1G05_207T01_9000000596_04744cztM0_level2_quad_clean.evt |
| Size (bytes) | 684,694,080 | 69,445,440 |
| Size | 653.0 MB | 66.2 MB |
| Events in quadrant A | 3,011,834 | 468,546 |
| Events in quadrant B | 3,048,056 | 473,889 |
| Events in quadrant C | 10,002,810 | 277,442 |
| Events in quadrant D | 4,242,854 | 438,530 |
| Mode M0 | |||
|---|---|---|---|
| Quadrant | BADHDUFLAG | Total packets | Discarded packets |
| A | 0 | 13374 | 2 |
| B | 0 | 13207 | 1 |
| C | 0 | 34000 | 1 |
| D | 0 | 16992 | 1 |
| Mode SS | |||
|---|---|---|---|
| Quadrant | BADHDUFLAG | Total packets | Discarded packets |
| A | 0 | 130 | 0 |
| B | 0 | 130 | 0 |
| C | 0 | 130 | 0 |
| D | 0 | 130 | 0 |
| Mode M9 | |||
|---|---|---|---|
| Quadrant | BADHDUFLAG | Total packets | Discarded packets |
| A | 0 | 10 | 0 |
| B | 0 | 10 | 0 |
| C | 0 | 10 | 0 |
| D | 0 | 10 | 0 |
| Quadrant | Total seconds | Saturated seconds | Saturation percentage |
|---|---|---|---|
| A | 6347 | 73 | 1.150150% |
| B | 6347 | 60 | 0.945329% |
| C | 6347 | 2872 | 45.249724% |
| D | 6347 | 513 | 8.082559% |
Noise dominated data is calculated using 1-second bins in cleaned event files. If a bin has >2000 counts, and if more than 50% of those come from <1% of pixels, then it is considered to be noise-dominated and hence unusable.
| Quadrant | # 1 sec bins | Bins with >0 counts | Bins with >2000 counts | High rate bins dominated by noise | Noise dominated (total time) | Noise dominated (detector-on time) | Marked lightcurve |
|---|---|---|---|---|---|---|---|
| A | 7392 | 6347 | 7 | 7 | 0.09% | 0.11% | 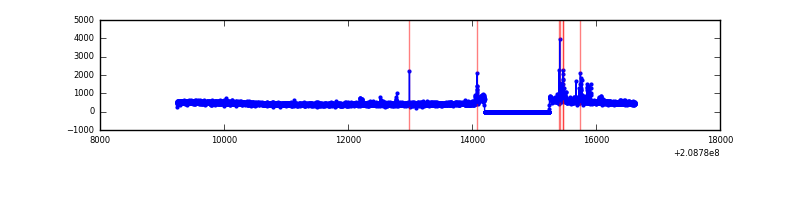 |
| B | 7392 | 6347 | 0 | 0 | 0.00% | 0.00% | 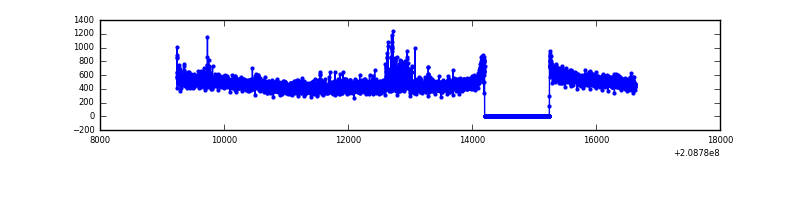 |
| C | 7392 | 6348 | 2525 | 2525 | 34.16% | 39.78% | 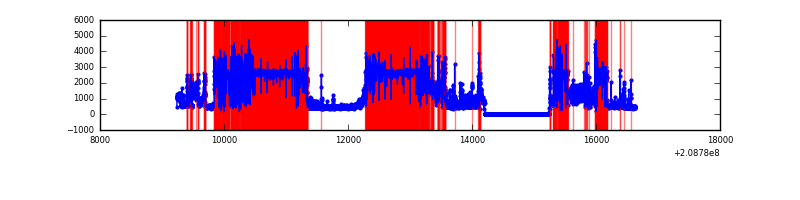 |
| D | 7392 | 6347 | 270 | 270 | 3.65% | 4.25% | 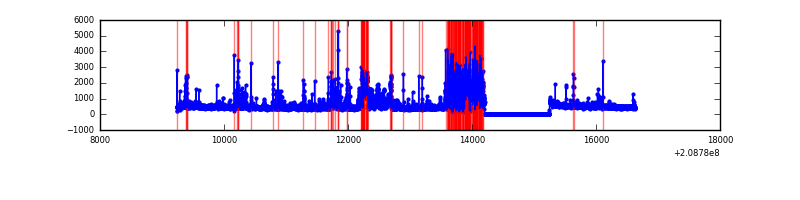 |
Top three noisy pixels from each quadrant. If the there are fewer than three noisy pixels in the level2.evt file, extra rows are filled as -1
| Pixel properties | Quadrant properties | ||||||
|---|---|---|---|---|---|---|---|
| Quadrant | DetID | PixID | Counts | Sigma | Mean | Median | Sigma |
| A | 7 | 16 | 94242 | 604.07 | 754 | 737 | 154.8 |
| A | 0 | 50 | 14120 | 86.46 | 754 | 737 | 154.8 |
| A | 0 | 226 | 7579 | 44.2 | 754 | 737 | 154.8 |
| B | 4 | 80 | 74721 | 504.14 | 759 | 739 | 146.7 |
| B | 14 | 167 | 16052 | 104.35 | 759 | 739 | 146.7 |
| B | 12 | 111 | 13983 | 90.25 | 759 | 739 | 146.7 |
| C | 14 | 48 | 7929576 | 64065.95 | 530 | 533 | 123.8 |
| C | 13 | 61 | 4167 | 29.36 | 530 | 533 | 123.8 |
| C | 12 | 4 | 1783 | 10.1 | 530 | 533 | 123.8 |
| D | 13 | 239 | 845037 | 5081.22 | 691 | 672 | 166.2 |
| D | 13 | 137 | 392312 | 2356.81 | 691 | 672 | 166.2 |
| D | 1 | 31 | 248296 | 1490.15 | 691 | 672 | 166.2 |
Histogram calculated using DETX and DETY for each event in the final _common_clean file
| Quadrant A | 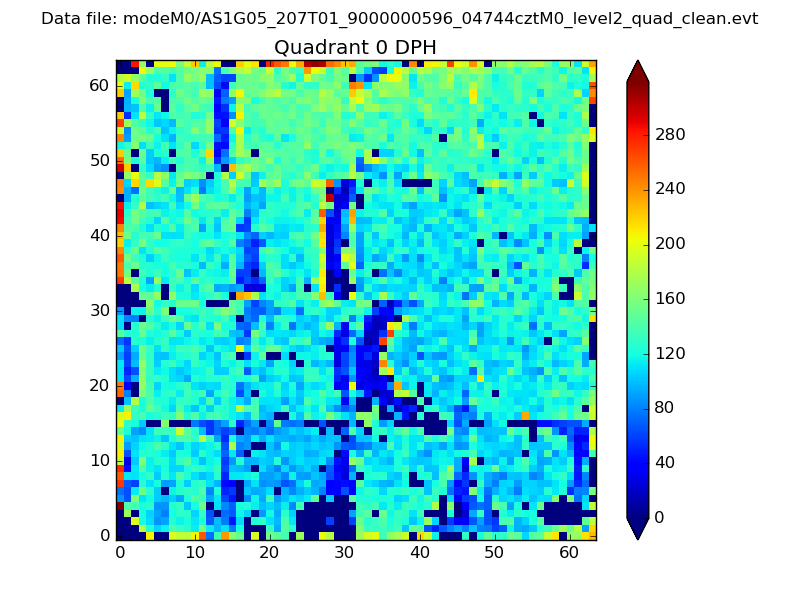 |
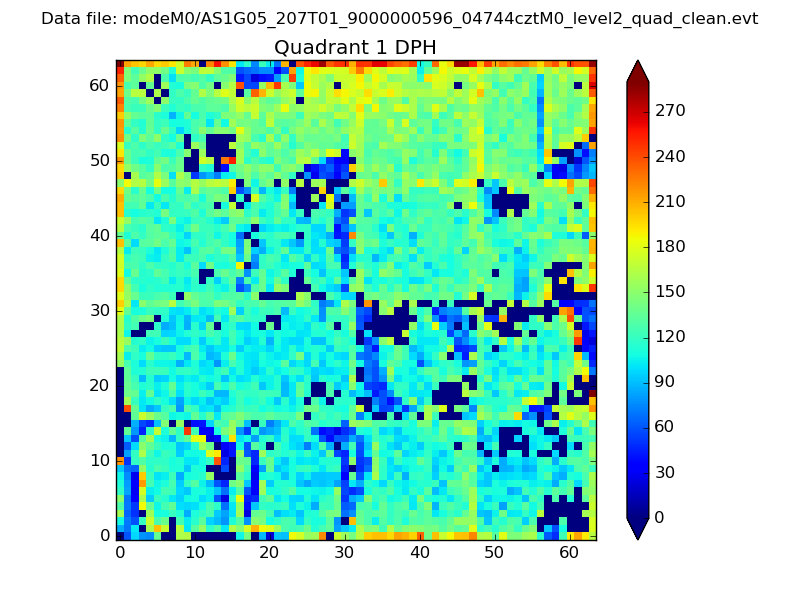 |
Quadrant B |
|---|---|---|---|
| Quadrant D | 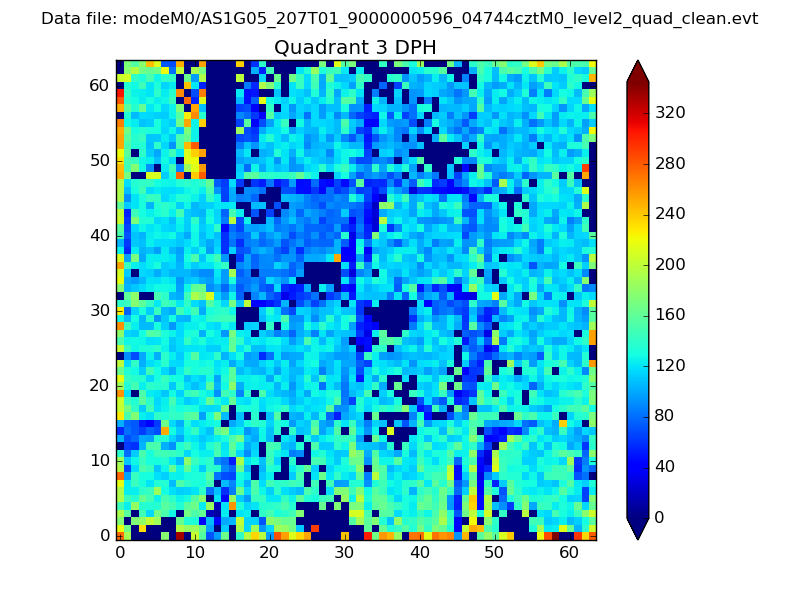 |
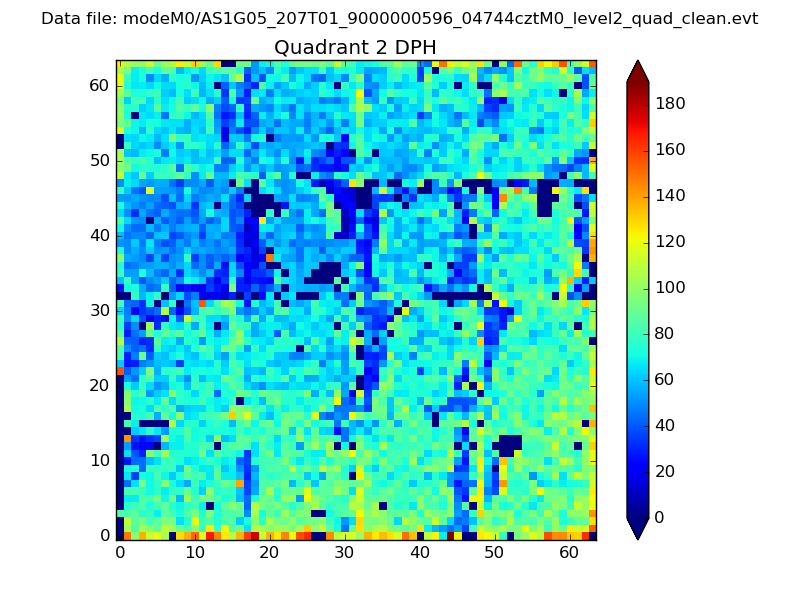 |
Quadrant C |
| Plot type | Count rate plots | Images |
|---|---|---|
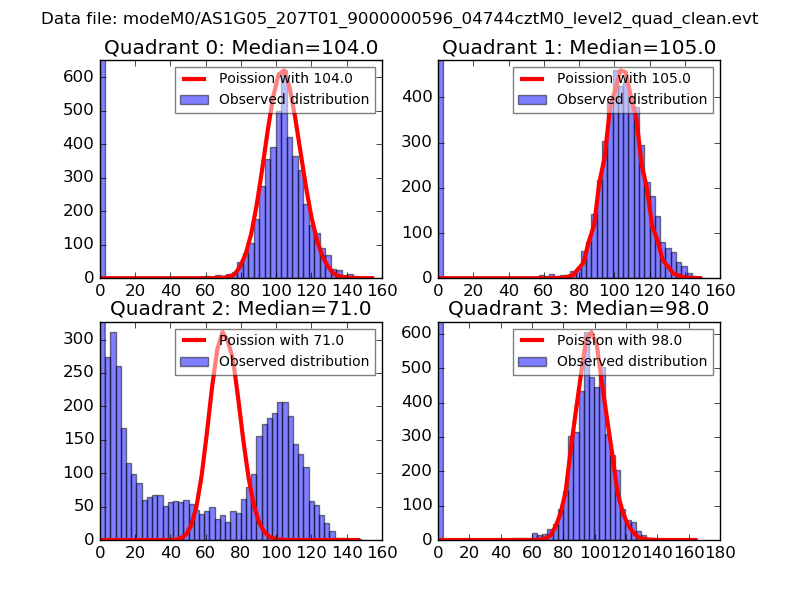
| Comparison with Poisson distribution Blue bars denote a histogram of data divided into 1 sec bins. Red curve is a Poisson curve with rate = median count rate of data. |
 |
 |
| Quadrant-wise count rates Data is divided into 100 sec bins |
 |
|
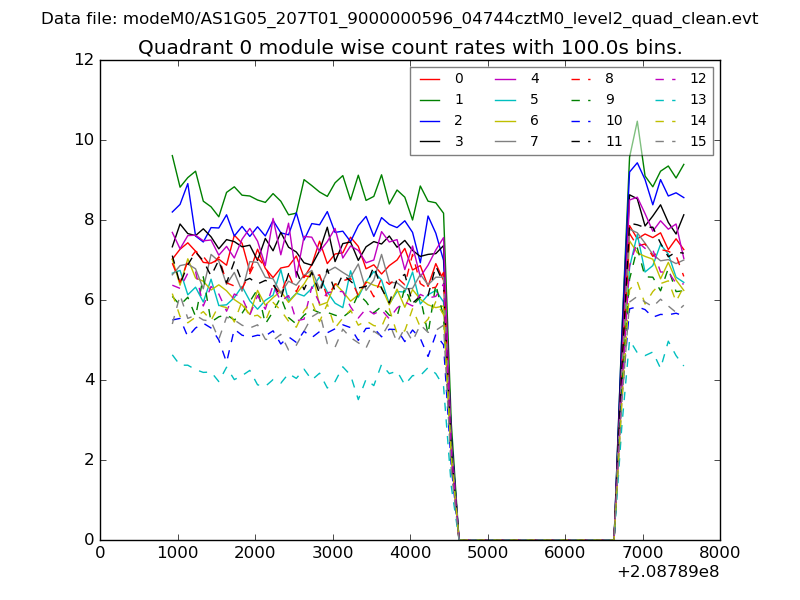
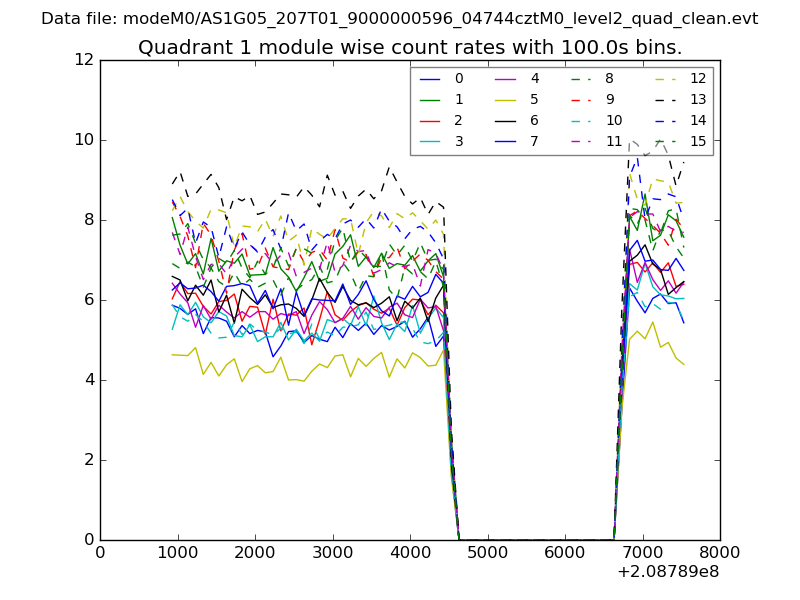
| Module-wise count rates for Quadrant A Data is divided into 100 sec bins |
 |
 |
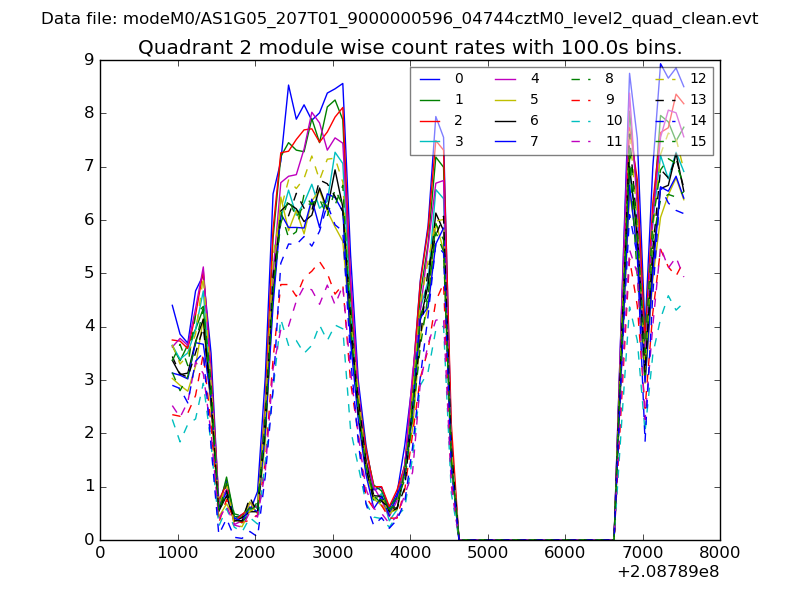
| Module-wise count rates for Quadrant B Data is divided into 100 sec bins |
 |
 |
| Module-wise count rates for Quadrant C Data is divided into 100 sec bins |
 |
 |
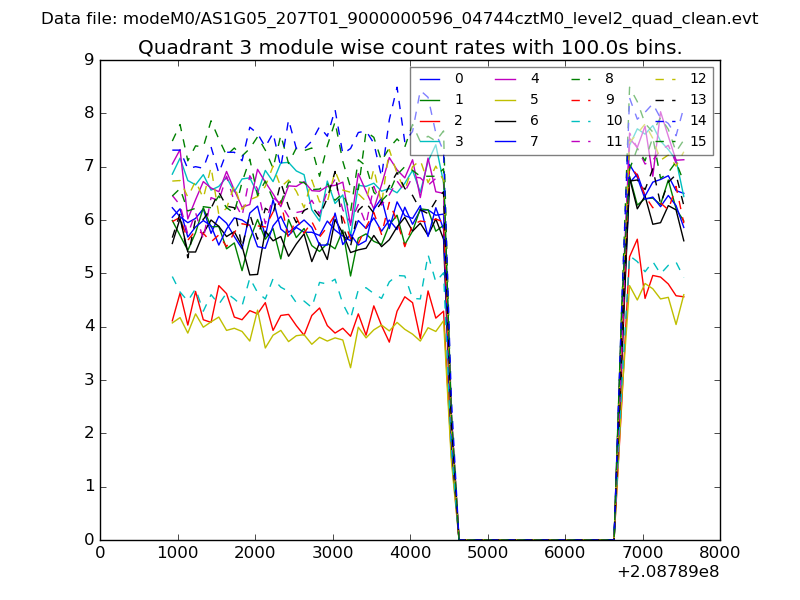
| Module-wise count rates for Quadrant D Data is divided into 100 sec bins |
 |
 |
| Parameter | Plot |
|---|---|
| CZT HV Monitor | 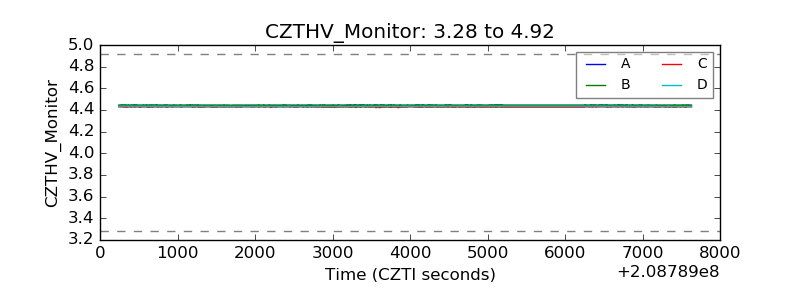 |
| D_VDD | 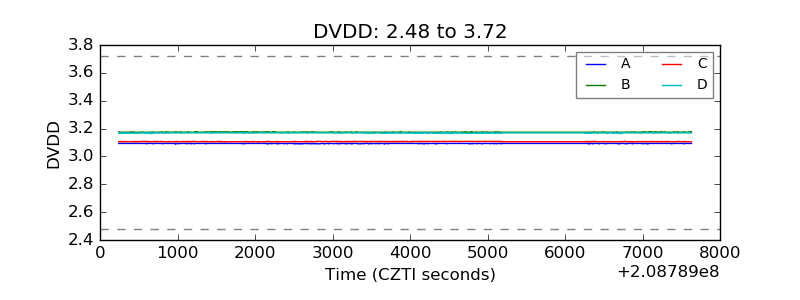 |
| Temperature 1 | 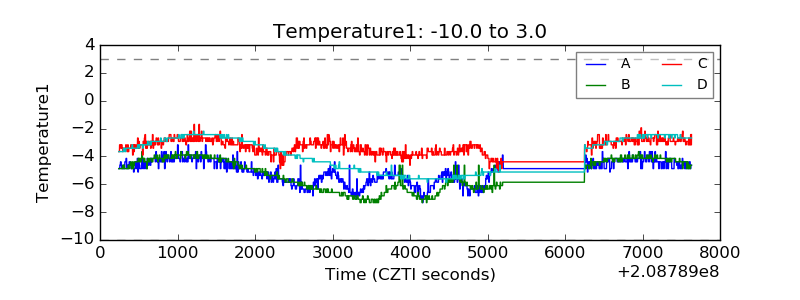 |
| Veto HV Monitor | 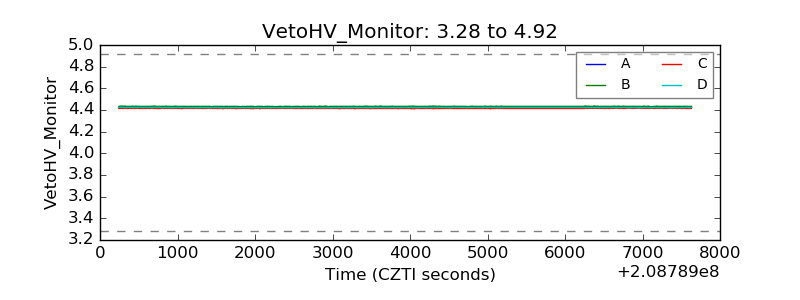 |
| Veto LLD | 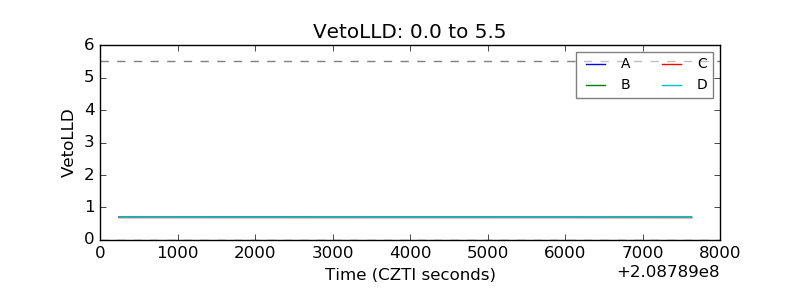 |
| Alpha Counter | 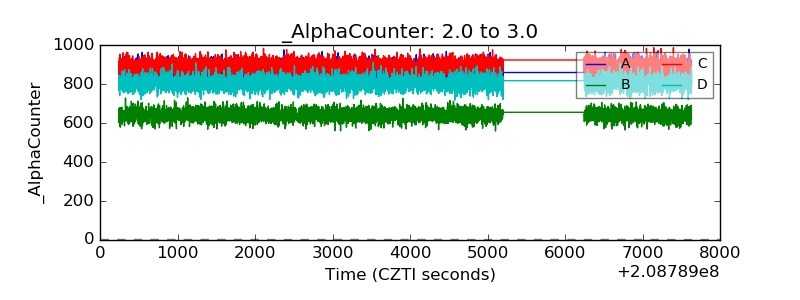 |
| _CPM_Rate | 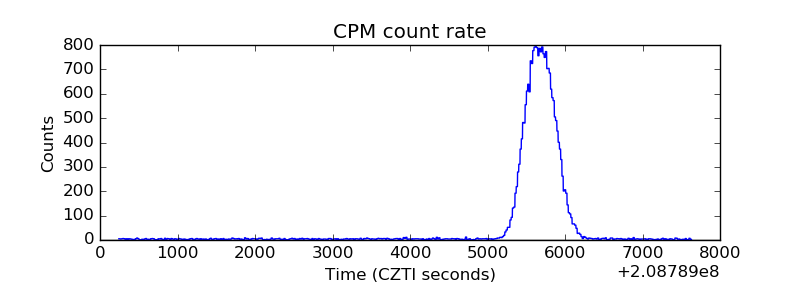 |
| CZT Counter | 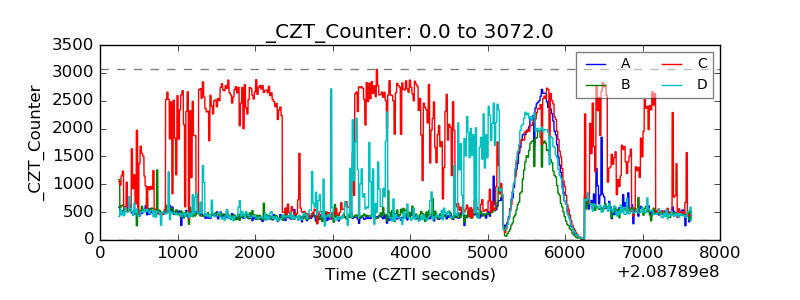 |
| +2.5 Volts monitor |  |
| +5 Volts monitor | 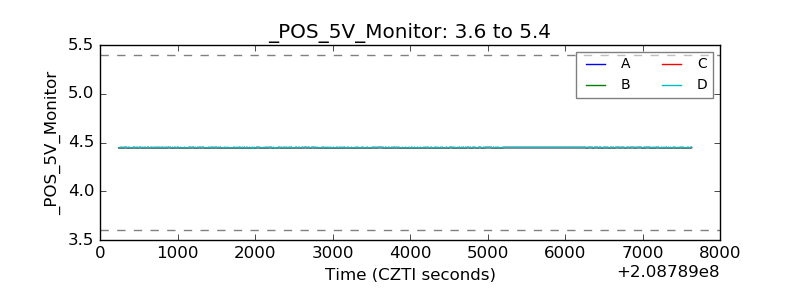 |
| _ROLL_ROT | 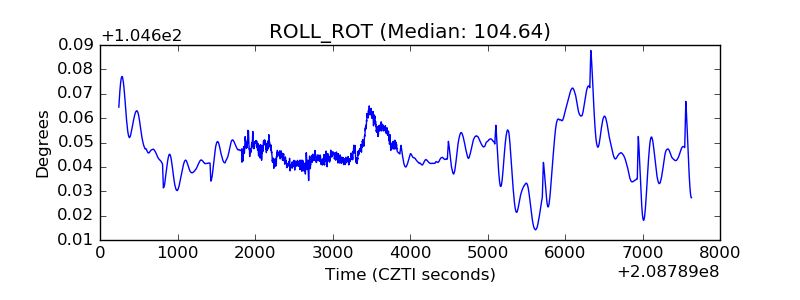 |
| _Roll_DEC | 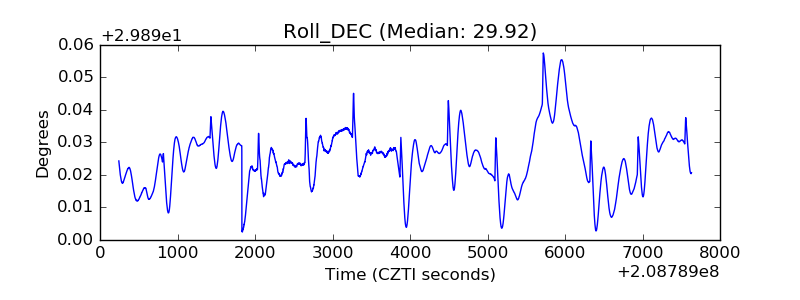 |
| _Roll_RA | 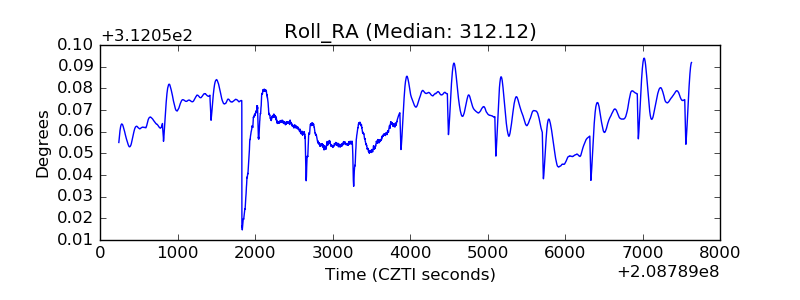 |
| Veto Counter | 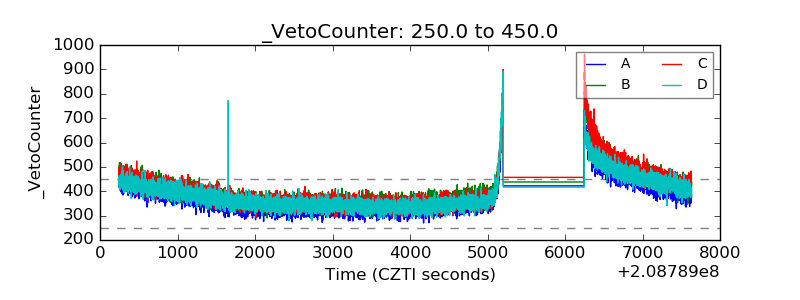 |