| Param | Original file | Final file |
|---|---|---|
| Filename | modeM0/AS1G05_207T01_9000000596_04747cztM0_level2.evt | modeM0/AS1G05_207T01_9000000596_04747cztM0_level2_quad_clean.evt |
| Size (bytes) | 398,551,680 | 83,350,080 |
| Size | 380.1 MB | 79.5 MB |
| Events in quadrant A | 2,808,254 | 532,415 |
| Events in quadrant B | 2,907,174 | 543,252 |
| Events in quadrant C | 2,892,064 | 533,848 |
| Events in quadrant D | 3,061,063 | 502,095 |
| Mode M0 | |||
|---|---|---|---|
| Quadrant | BADHDUFLAG | Total packets | Discarded packets |
| A | 0 | 12389 | 1 |
| B | 0 | 12668 | 1 |
| C | 0 | 12556 | 1 |
| D | 0 | 13235 | 1 |
| Mode SS | |||
|---|---|---|---|
| Quadrant | BADHDUFLAG | Total packets | Discarded packets |
| A | 0 | 122 | 0 |
| B | 0 | 122 | 0 |
| C | 0 | 122 | 0 |
| D | 0 | 122 | 0 |
| Mode M9 | |||
|---|---|---|---|
| Quadrant | BADHDUFLAG | Total packets | Discarded packets |
| A | 0 | 12 | 0 |
| B | 0 | 12 | 0 |
| C | 0 | 12 | 0 |
| D | 0 | 12 | 0 |
| Quadrant | Total seconds | Saturated seconds | Saturation percentage |
|---|---|---|---|
| A | 5895 | 43 | 0.729432% |
| B | 5895 | 50 | 0.848176% |
| C | 5895 | 54 | 0.916031% |
| D | 5895 | 105 | 1.781170% |
Noise dominated data is calculated using 1-second bins in cleaned event files. If a bin has >2000 counts, and if more than 50% of those come from <1% of pixels, then it is considered to be noise-dominated and hence unusable.
| Quadrant | # 1 sec bins | Bins with >0 counts | Bins with >2000 counts | High rate bins dominated by noise | Noise dominated (total time) | Noise dominated (detector-on time) | Marked lightcurve |
|---|---|---|---|---|---|---|---|
| A | 7145 | 5896 | 0 | 0 | 0.00% | 0.00% | 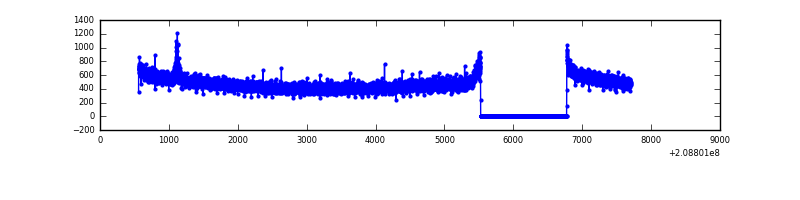 |
| B | 7145 | 5896 | 3 | 3 | 0.04% | 0.05% | 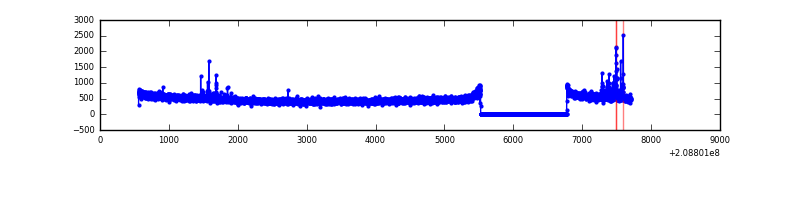 |
| C | 7145 | 5896 | 4 | 4 | 0.06% | 0.07% | 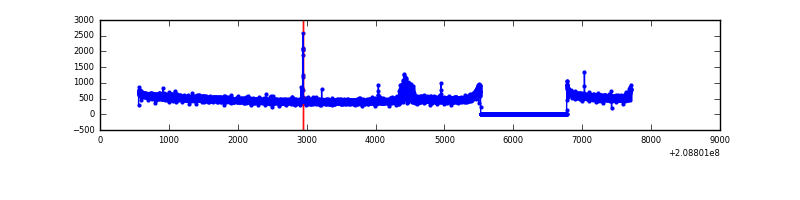 |
| D | 7145 | 5896 | 58 | 58 | 0.81% | 0.98% | 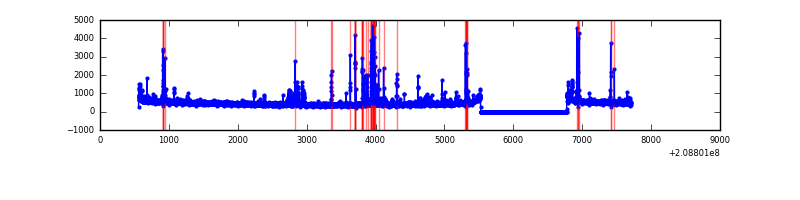 |
Top three noisy pixels from each quadrant. If the there are fewer than three noisy pixels in the level2.evt file, extra rows are filled as -1
| Pixel properties | Quadrant properties | ||||||
|---|---|---|---|---|---|---|---|
| Quadrant | DetID | PixID | Counts | Sigma | Mean | Median | Sigma |
| A | 13 | 14 | 15581 | 101.16 | 722 | 707 | 147.0 |
| A | 0 | 50 | 15453 | 100.29 | 722 | 707 | 147.0 |
| A | 12 | 194 | 7037 | 43.05 | 722 | 707 | 147.0 |
| B | 14 | 167 | 66273 | 475.04 | 729 | 712 | 138.0 |
| B | 12 | 111 | 13231 | 90.71 | 729 | 712 | 138.0 |
| B | 11 | 111 | 10232 | 68.98 | 729 | 712 | 138.0 |
| C | 14 | 48 | 99987 | 598.31 | 714 | 718 | 165.9 |
| C | 13 | 61 | 5733 | 30.23 | 714 | 718 | 165.9 |
| C | 12 | 4 | 3319 | 15.68 | 714 | 718 | 165.9 |
| D | 13 | 239 | 124008 | 736.29 | 701 | 681 | 167.5 |
| D | 13 | 235 | 72320 | 427.7 | 701 | 681 | 167.5 |
| D | 1 | 31 | 44935 | 264.21 | 701 | 681 | 167.5 |
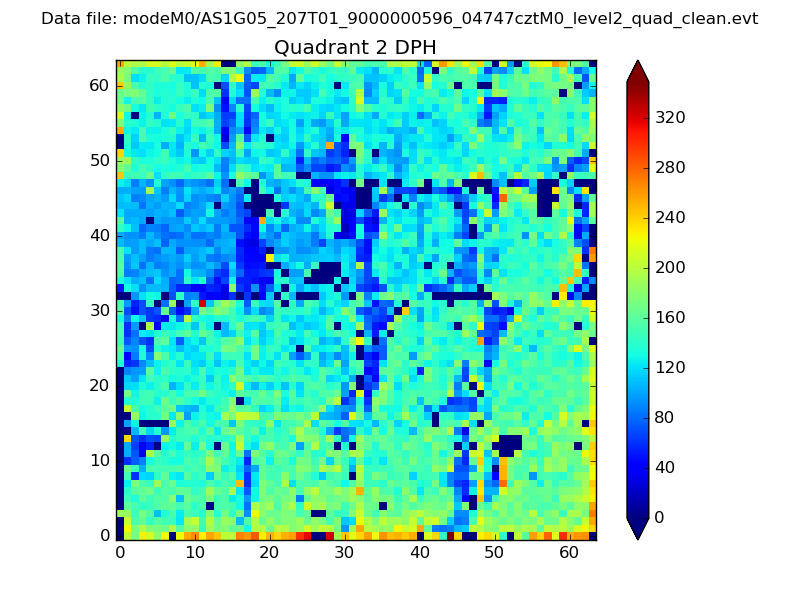
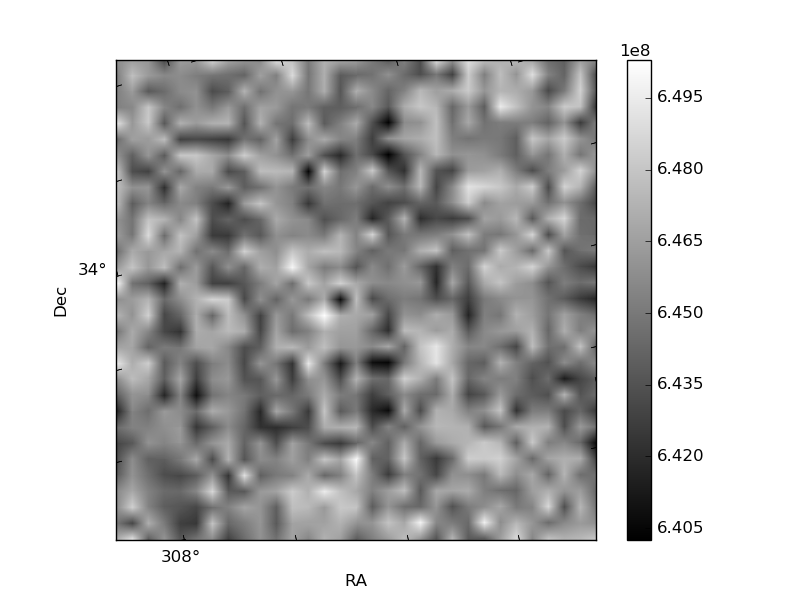
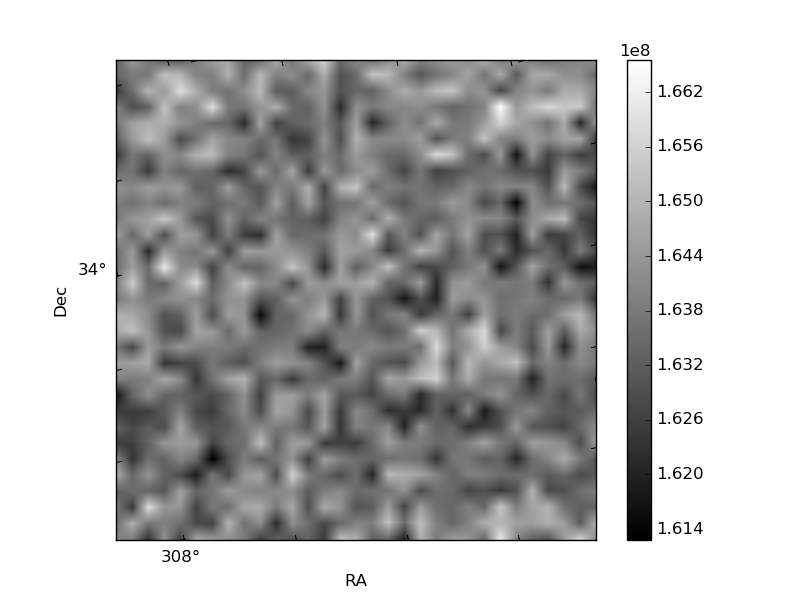
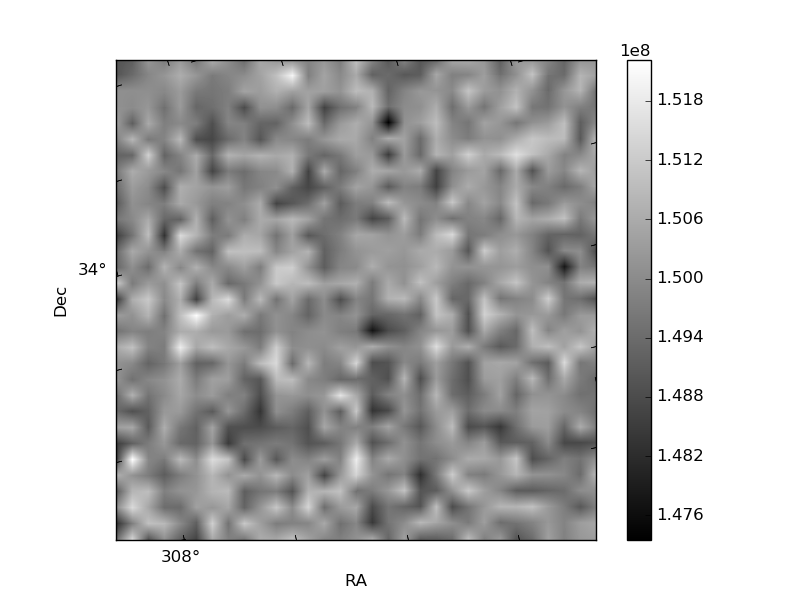
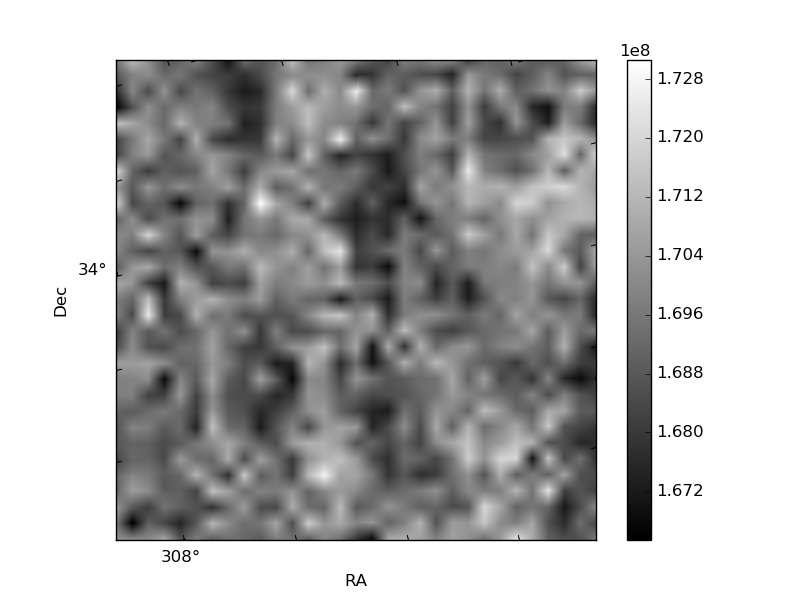
Histogram calculated using DETX and DETY for each event in the final _common_clean file
| Quadrant A | 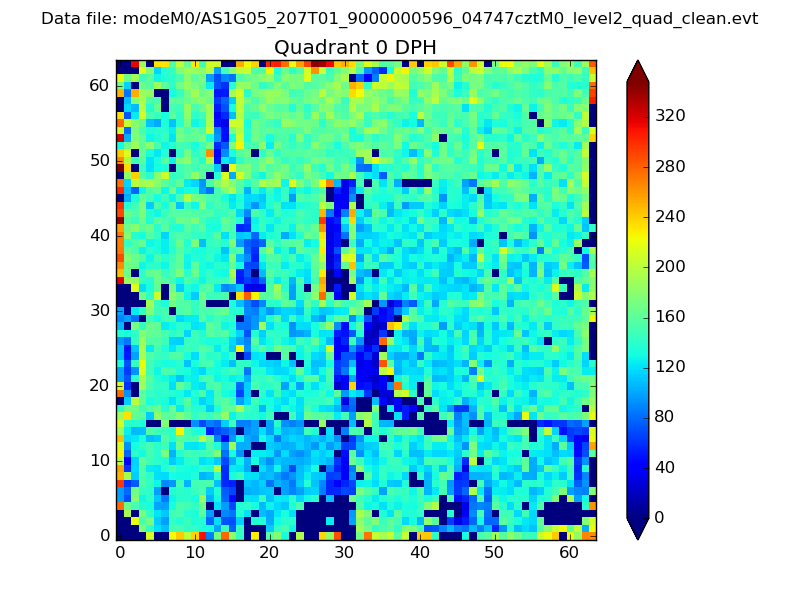 |
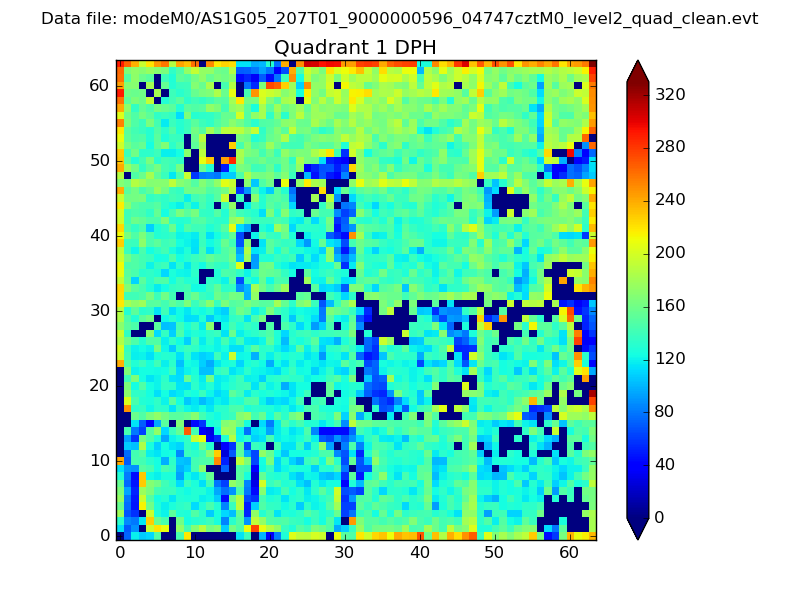 |
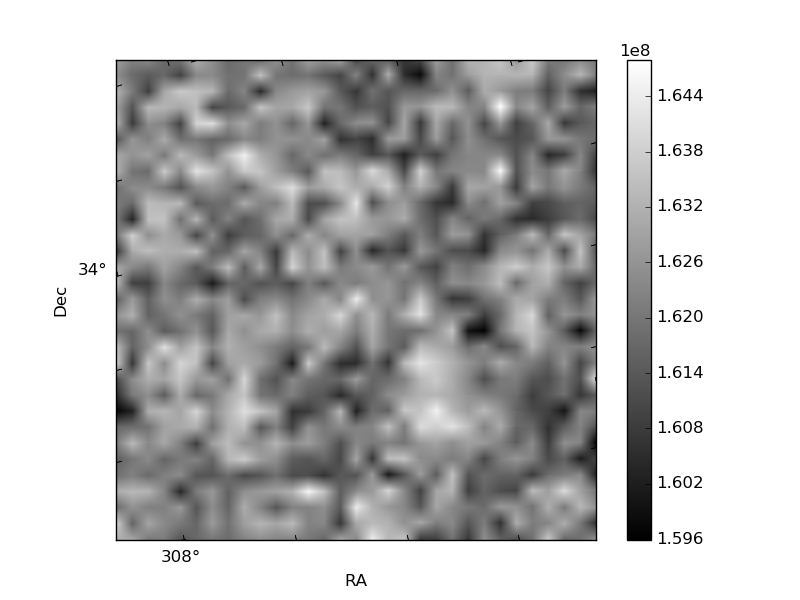
Quadrant B |
|---|---|---|---|
| Quadrant D | 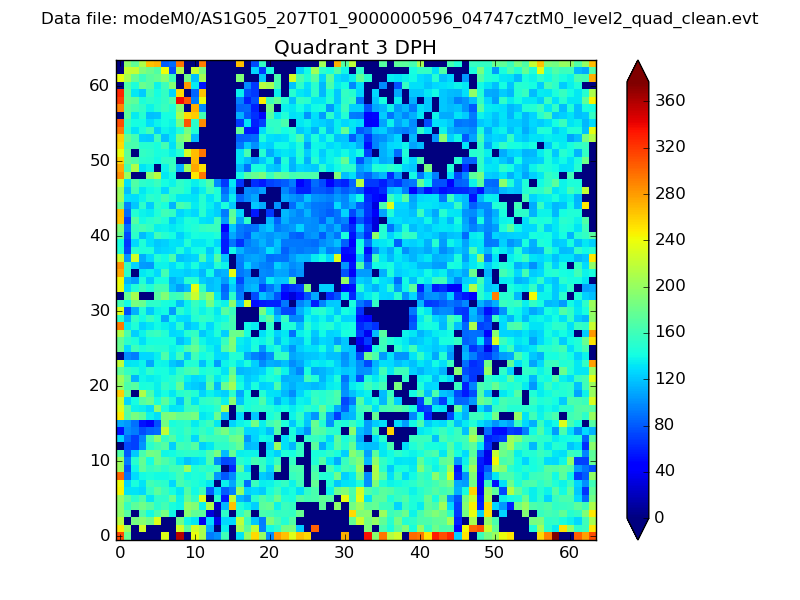 |
 |
Quadrant C |
| Plot type | Count rate plots | Images |
|---|---|---|
| Comparison with Poisson distribution Blue bars denote a histogram of data divided into 1 sec bins. Red curve is a Poisson curve with rate = median count rate of data. |
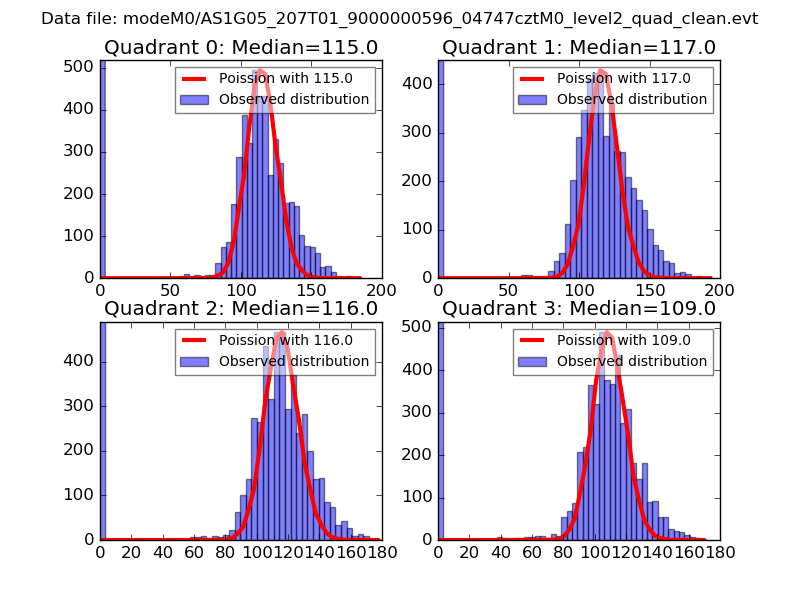 |
 |
| Quadrant-wise count rates Data is divided into 100 sec bins |
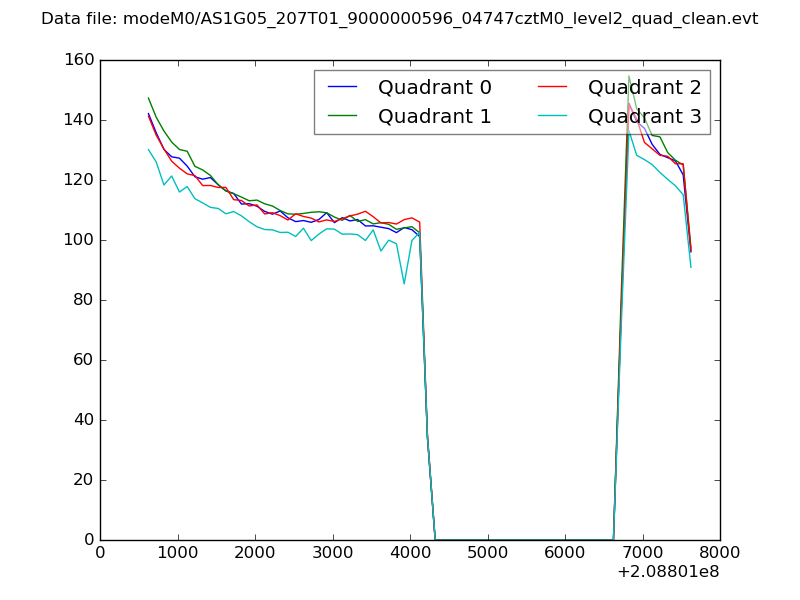 |
|
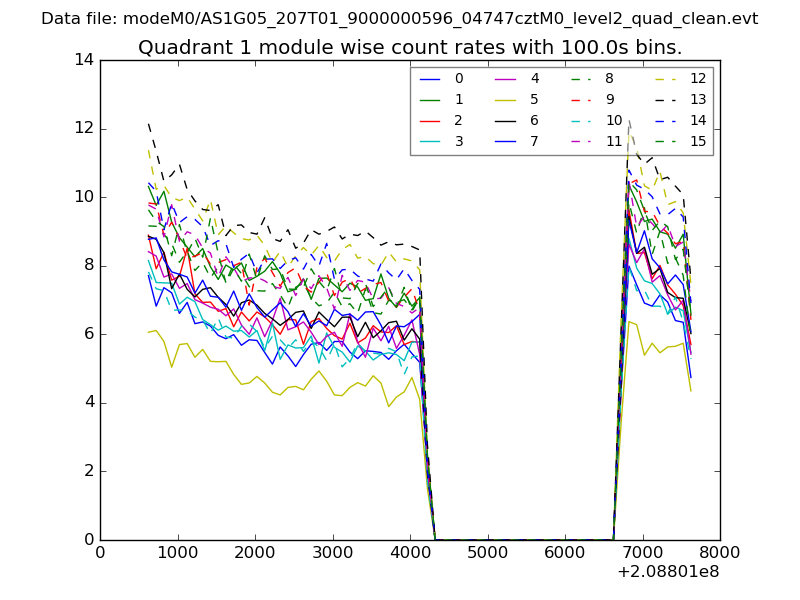
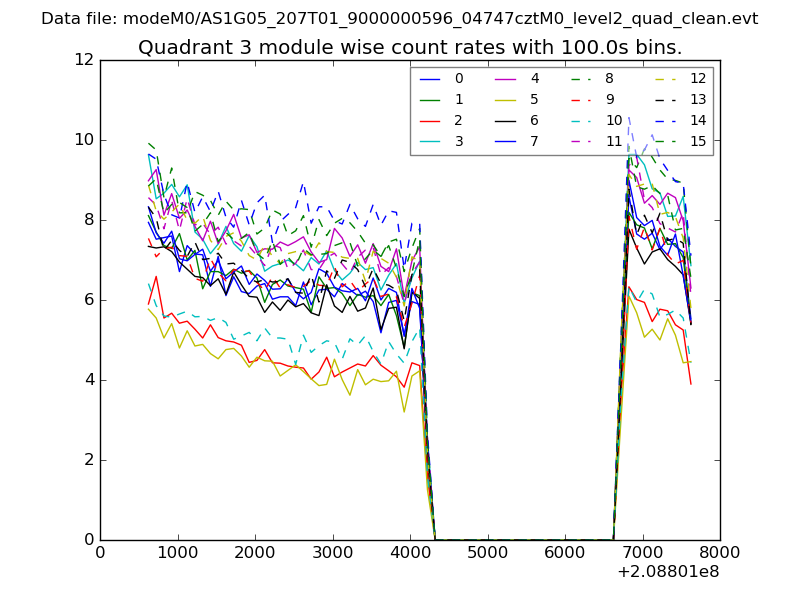
| Module-wise count rates for Quadrant A Data is divided into 100 sec bins |
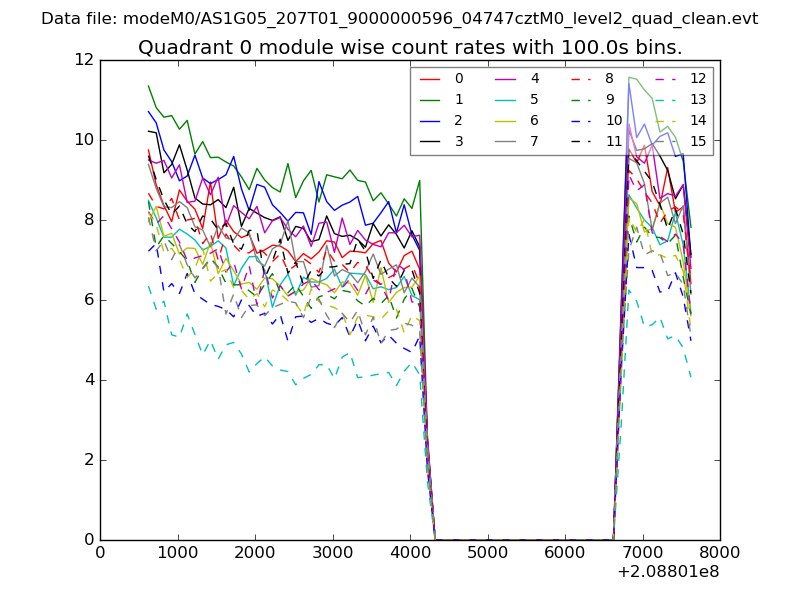 |
 |
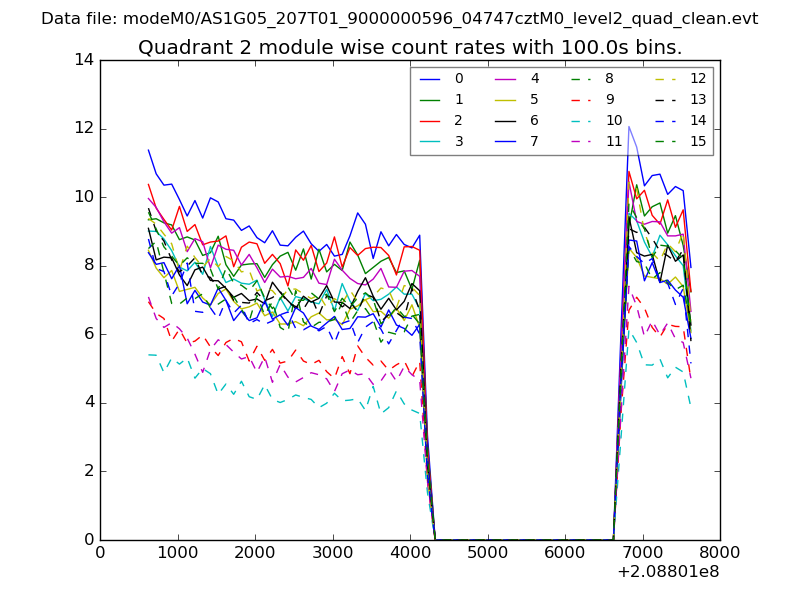
| Module-wise count rates for Quadrant B Data is divided into 100 sec bins |
 |
 |
| Module-wise count rates for Quadrant C Data is divided into 100 sec bins |
 |
 |
| Module-wise count rates for Quadrant D Data is divided into 100 sec bins |
 |
 |
| Parameter | Plot |
|---|---|
| CZT HV Monitor | 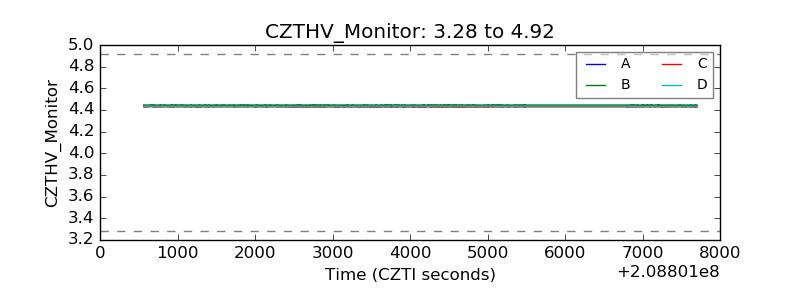 |
| D_VDD | 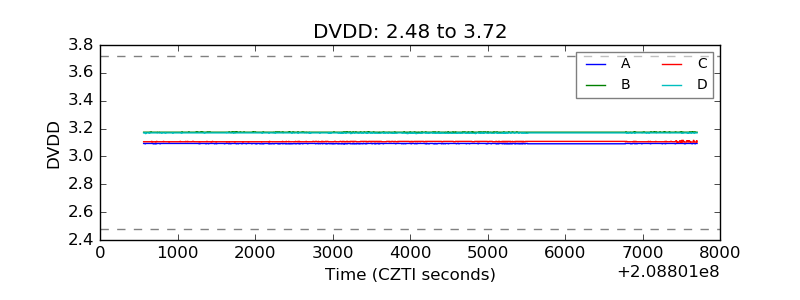 |
| Temperature 1 | 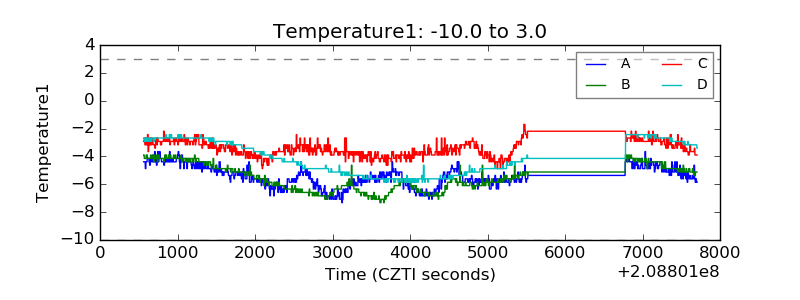 |
| Veto HV Monitor | 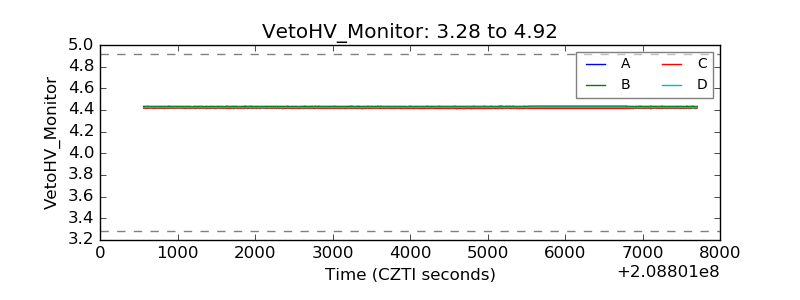 |
| Veto LLD | 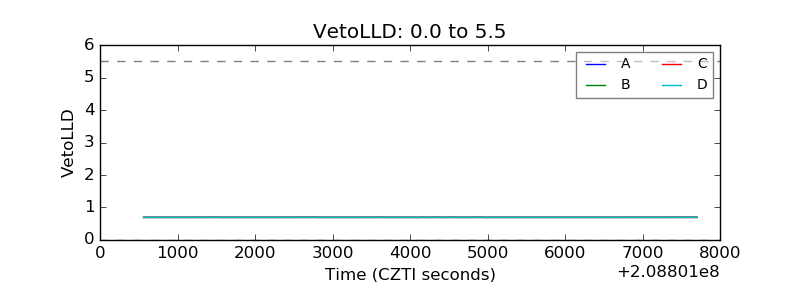 |
| Alpha Counter | 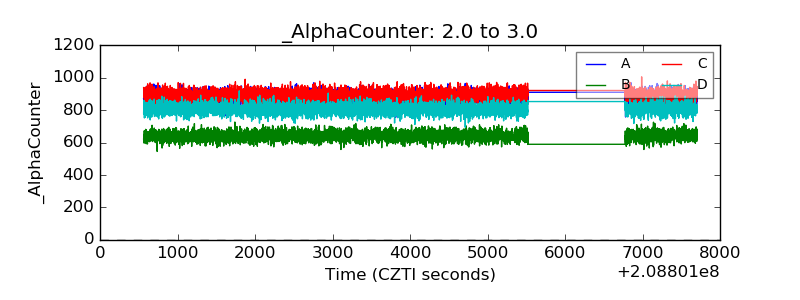 |
| _CPM_Rate | 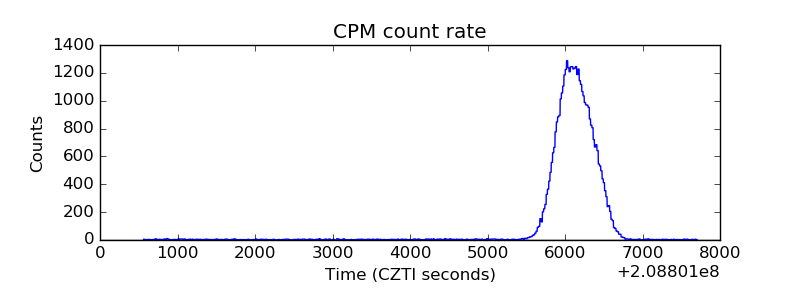 |
| CZT Counter | 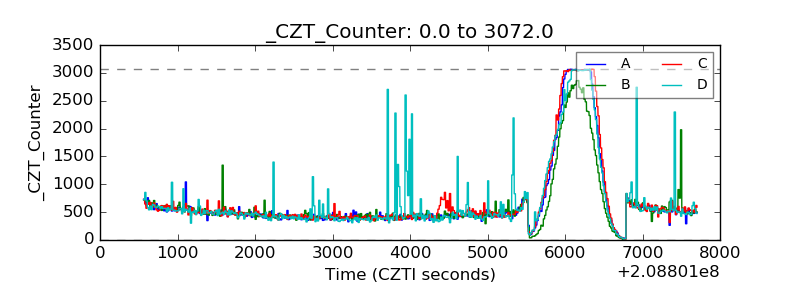 |
| +2.5 Volts monitor | 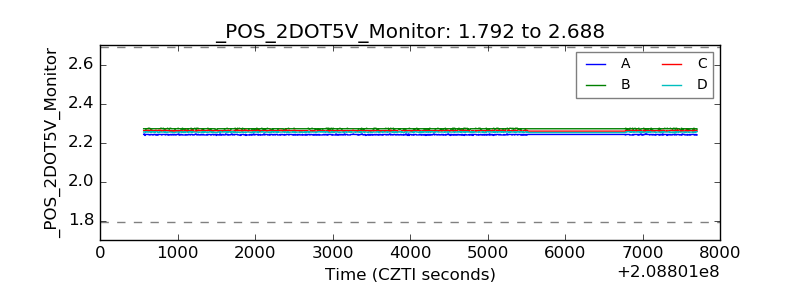 |
| +5 Volts monitor | 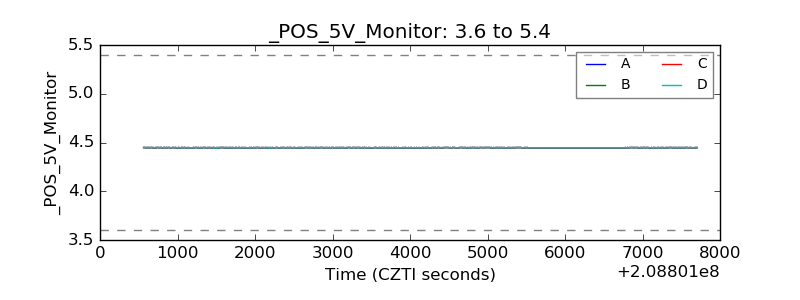 |
| _ROLL_ROT | 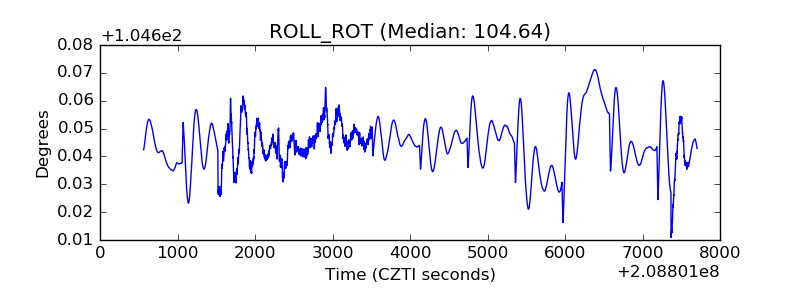 |
| _Roll_DEC | 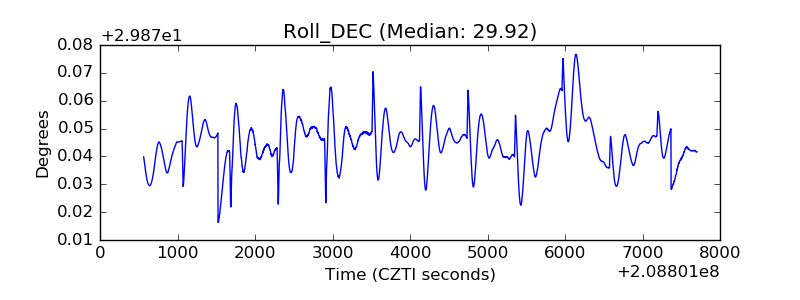 |
| _Roll_RA |  |
| Veto Counter | 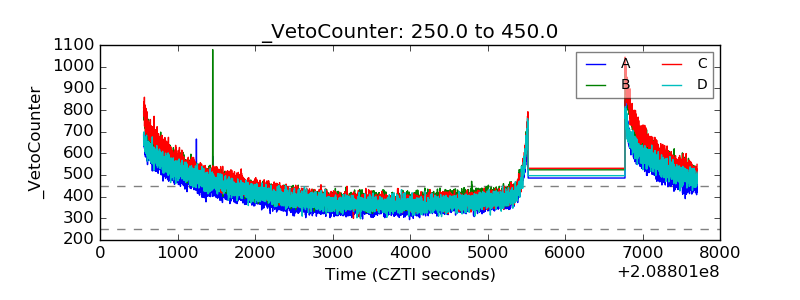 |