| Param | Original file | Final file |
|---|---|---|
| Filename | modeM0/AS1SLEW_01234_9000000597_04747cztM0_level2.evt | modeM0/AS1SLEW_01234_9000000597_04747cztM0_level2_quad_clean.evt |
| Size (bytes) | 77,817,600 | 4,000,320 |
| Size | 74.2 MB | 3.8 MB |
| Events in quadrant A | 543,337 | 6,600 |
| Events in quadrant B | 612,715 | 6,502 |
| Events in quadrant C | 562,196 | 6,528 |
| Events in quadrant D | 550,095 | 6,420 |
| Mode M0 | |||
|---|---|---|---|
| Quadrant | BADHDUFLAG | Total packets | Discarded packets |
| A | 0 | 2522 | 0 |
| B | 0 | 2679 | 0 |
| C | 0 | 2532 | 0 |
| D | 0 | 2576 | 0 |
| Mode SS | |||
|---|---|---|---|
| Quadrant | BADHDUFLAG | Total packets | Discarded packets |
| A | 0 | 24 | 0 |
| B | 0 | 24 | 0 |
| C | 0 | 24 | 0 |
| D | 0 | 24 | 0 |
| Quadrant | Total seconds | Saturated seconds | Saturation percentage |
|---|---|---|---|
| A | 1256 | 0 | 0.000000% |
| B | 1256 | 3 | 0.238854% |
| C | 1256 | 0 | 0.000000% |
| D | 1256 | 0 | 0.000000% |
Noise dominated data is calculated using 1-second bins in cleaned event files. If a bin has >2000 counts, and if more than 50% of those come from <1% of pixels, then it is considered to be noise-dominated and hence unusable.
| Quadrant | # 1 sec bins | Bins with >0 counts | Bins with >2000 counts | High rate bins dominated by noise | Noise dominated (total time) | Noise dominated (detector-on time) | Marked lightcurve |
|---|---|---|---|---|---|---|---|
| A | 1256 | 1256 | 1 | 1 | 0.08% | 0.08% | 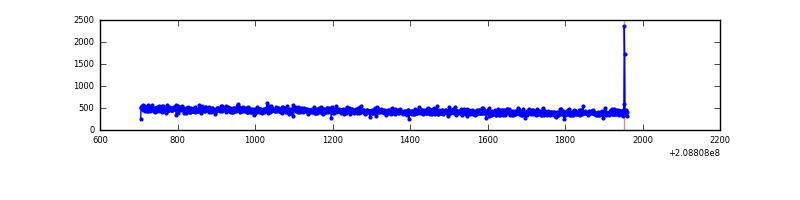 |
| B | 1256 | 1256 | 2 | 2 | 0.16% | 0.16% | 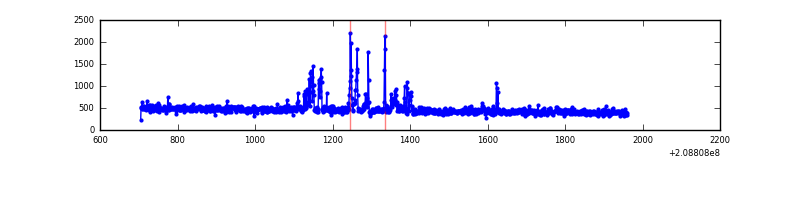 |
| C | 1256 | 1256 | 0 | 0 | 0.00% | 0.00% | 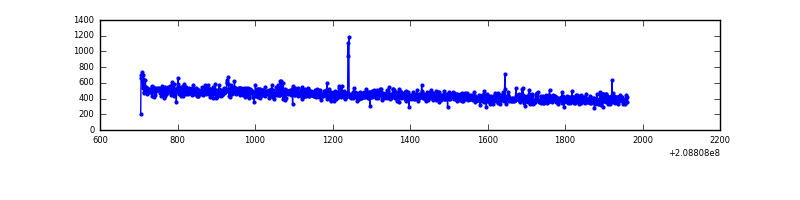 |
| D | 1256 | 1256 | 0 | 0 | 0.00% | 0.00% | 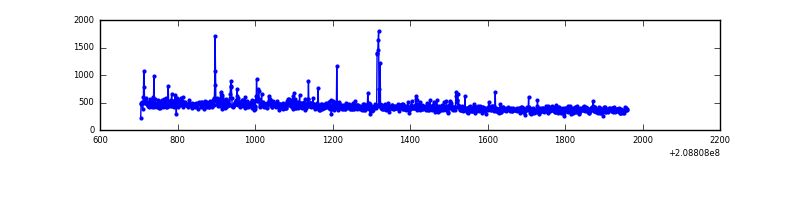 |
Top three noisy pixels from each quadrant. If the there are fewer than three noisy pixels in the level2.evt file, extra rows are filled as -1
| Pixel properties | Quadrant properties | ||||||
|---|---|---|---|---|---|---|---|
| Quadrant | DetID | PixID | Counts | Sigma | Mean | Median | Sigma |
| A | 10 | 17 | 4058 | 127.14 | 140 | 137 | 30.8 |
| A | 0 | 226 | 1397 | 40.86 | 140 | 137 | 30.8 |
| A | 12 | 194 | 1339 | 38.98 | 140 | 137 | 30.8 |
| B | 14 | 167 | 57686 | 2018.05 | 142 | 139 | 28.5 |
| B | 12 | 111 | 2465 | 81.57 | 142 | 139 | 28.5 |
| B | 11 | 111 | 1958 | 63.79 | 142 | 139 | 28.5 |
| C | 8 | 128 | 5854 | 166.35 | 140 | 141 | 34.3 |
| C | 14 | 48 | 4282 | 120.58 | 140 | 141 | 34.3 |
| C | 8 | 144 | 2130 | 57.92 | 140 | 141 | 34.3 |
| D | 2 | 234 | 11754 | 341.53 | 138 | 134 | 34.0 |
| D | 1 | 31 | 8871 | 256.79 | 138 | 134 | 34.0 |
| D | 13 | 238 | 4827 | 137.94 | 138 | 134 | 34.0 |
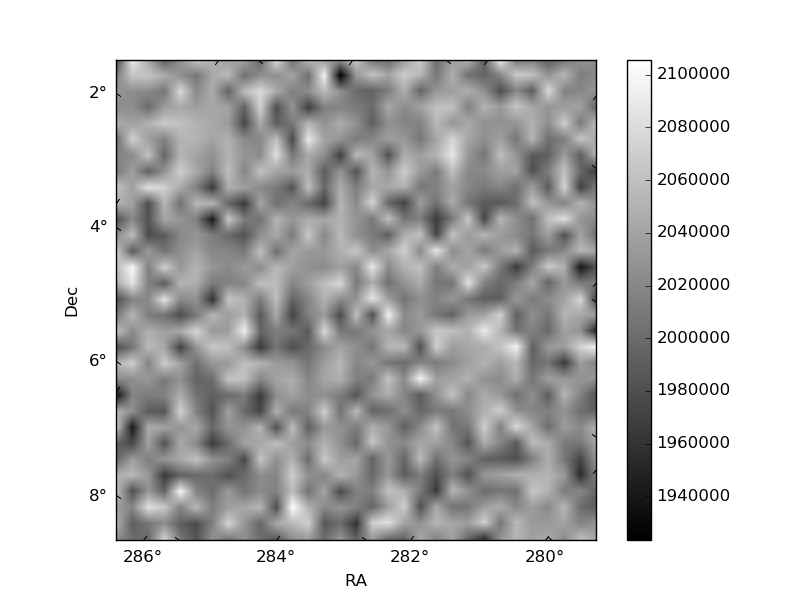
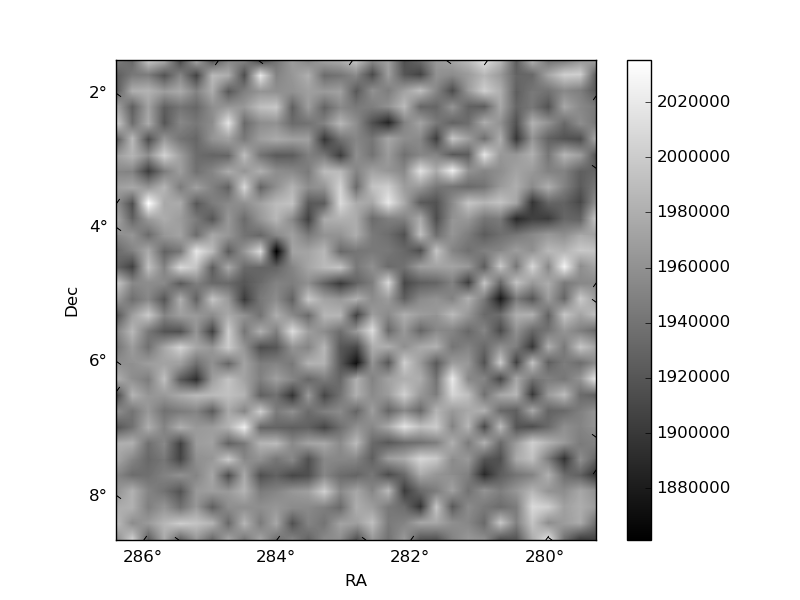
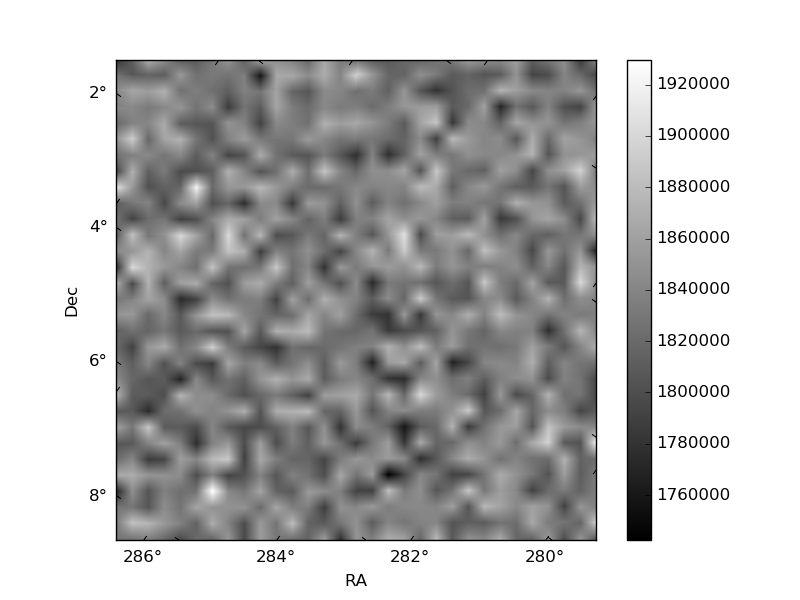
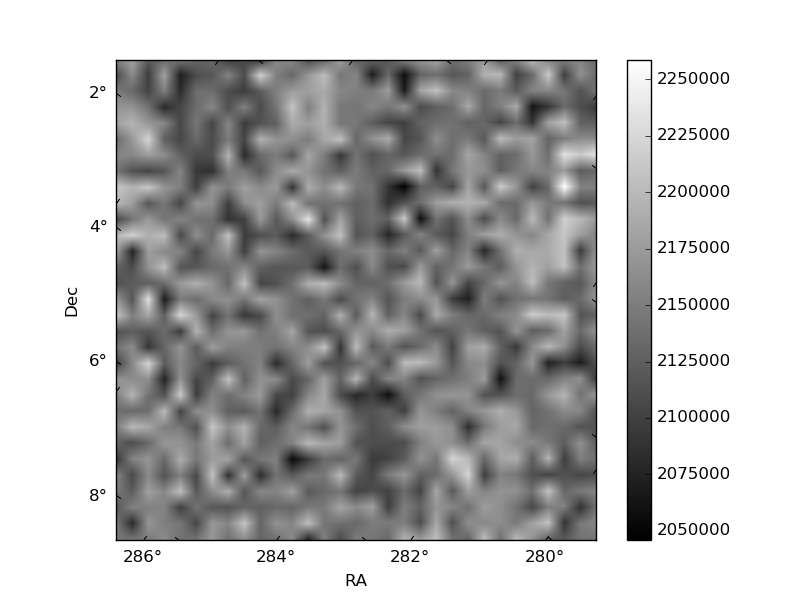
Histogram calculated using DETX and DETY for each event in the final _common_clean file
| Quadrant A | 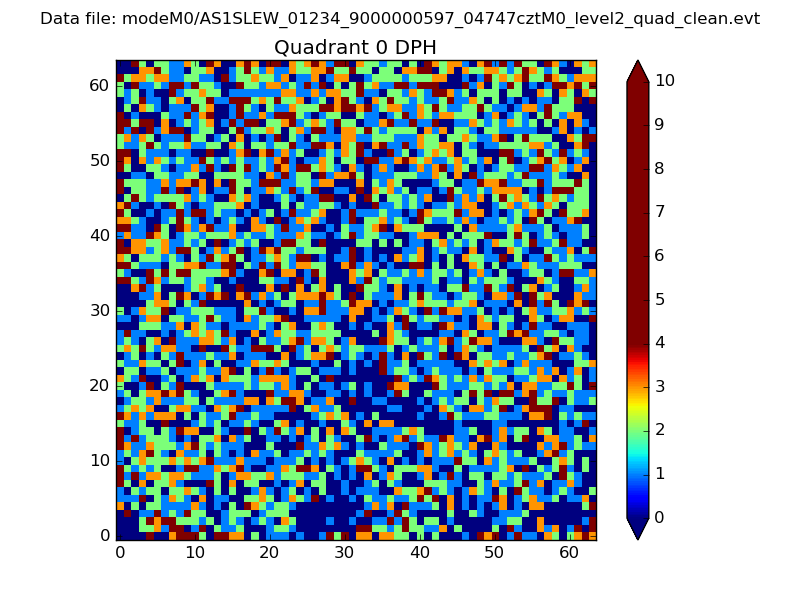 |
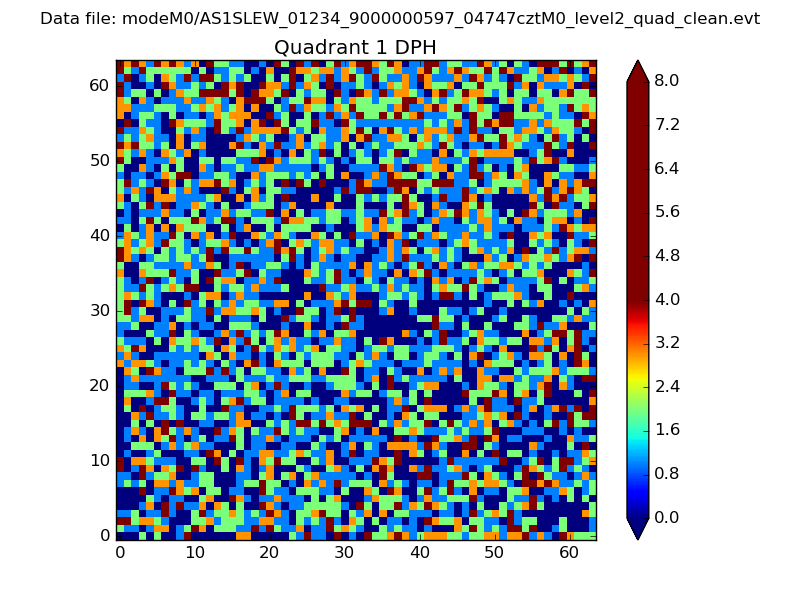 |
Quadrant B |
|---|---|---|---|
| Quadrant D | 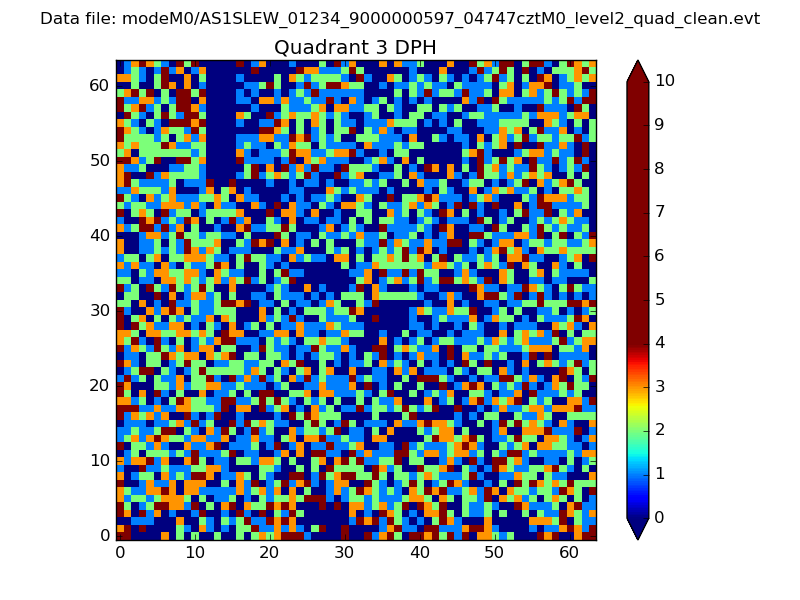 |
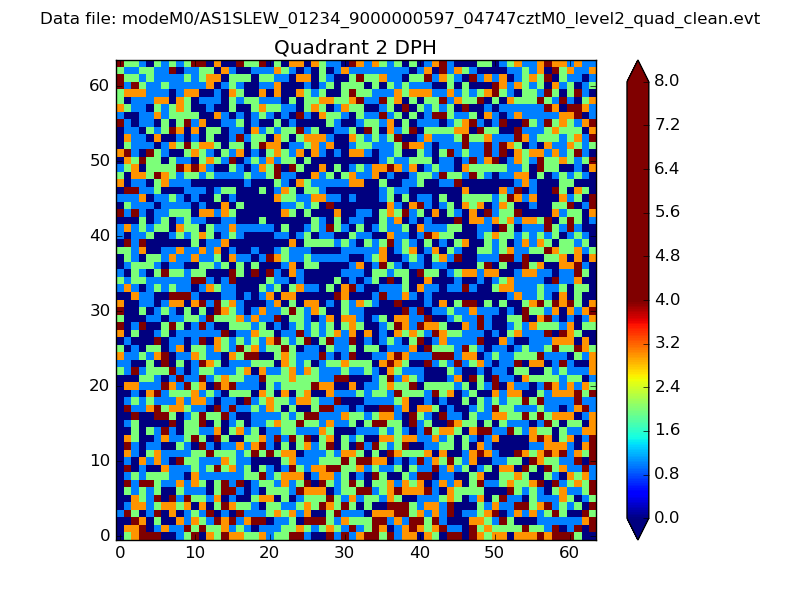 |
Quadrant C |
| Plot type | Count rate plots | Images |
|---|---|---|
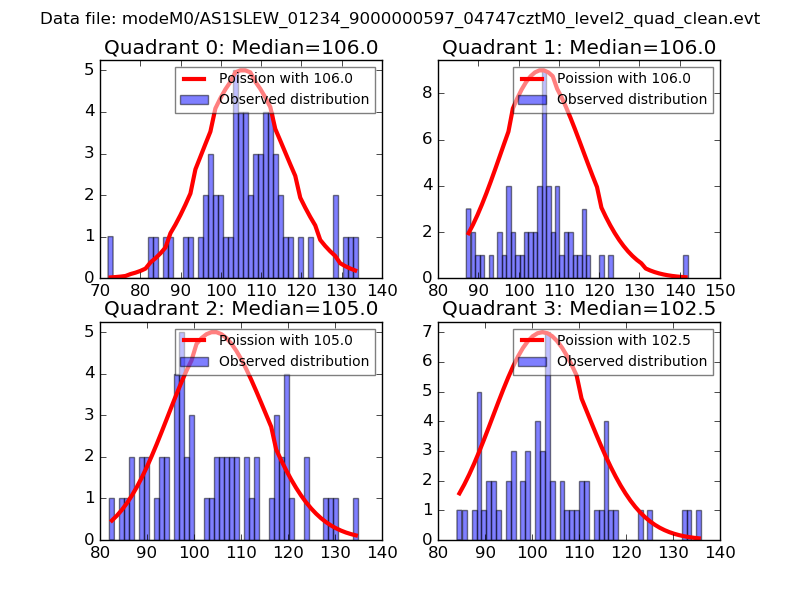
| Comparison with Poisson distribution Blue bars denote a histogram of data divided into 1 sec bins. Red curve is a Poisson curve with rate = median count rate of data. |
 |
 |
| Quadrant-wise count rates Data is divided into 100 sec bins |
 |
|
| Module-wise count rates for Quadrant A Data is divided into 100 sec bins |
 |
 |
| Module-wise count rates for Quadrant B Data is divided into 100 sec bins |
 |
 |
| Module-wise count rates for Quadrant C Data is divided into 100 sec bins |
 |
 |
| Module-wise count rates for Quadrant D Data is divided into 100 sec bins |
 |
 |
| Parameter | Plot |
|---|---|
| CZT HV Monitor | 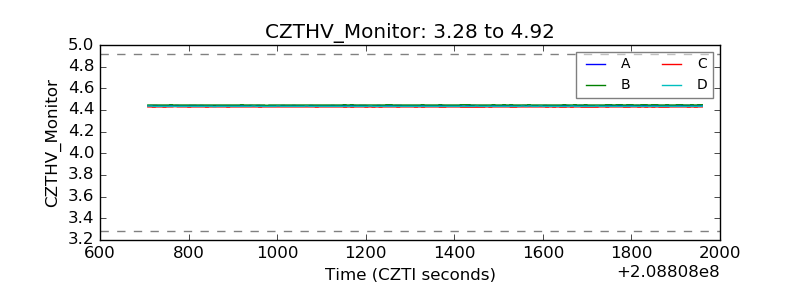 |
| D_VDD | 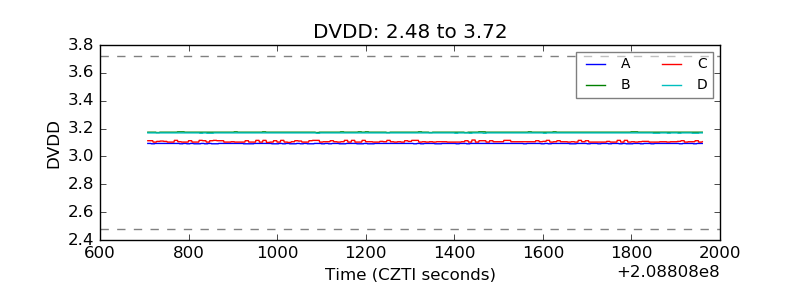 |
| Temperature 1 | 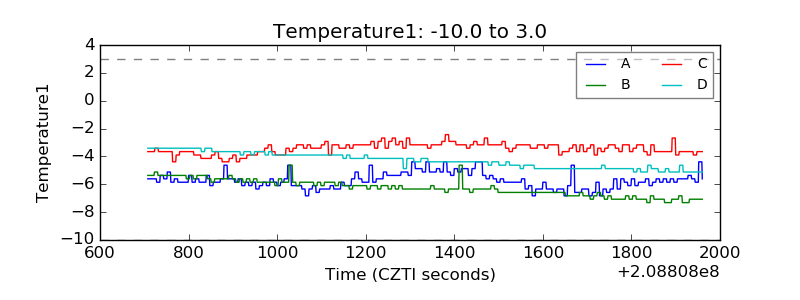 |
| Veto HV Monitor | 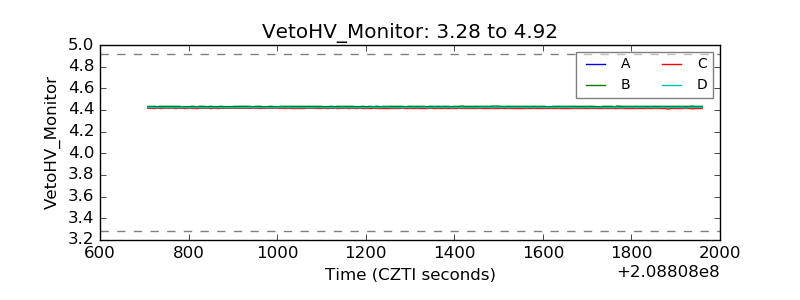 |
| Veto LLD | 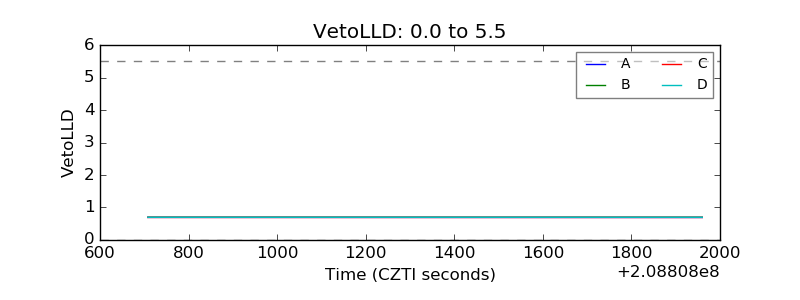 |
| Alpha Counter | 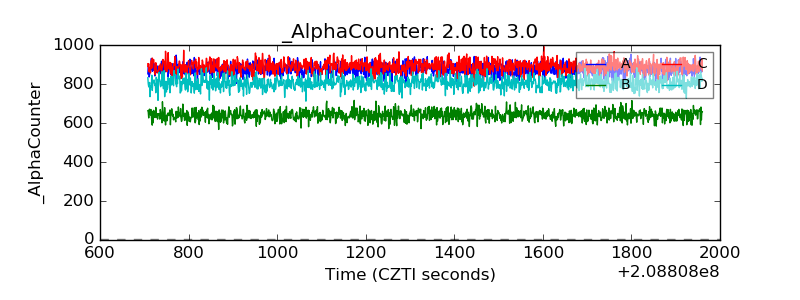 |
| _CPM_Rate | 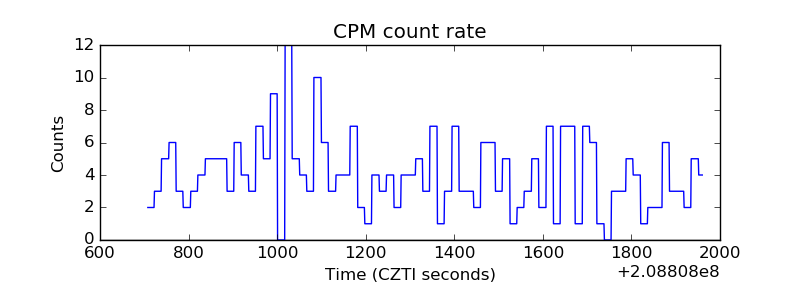 |
| CZT Counter | 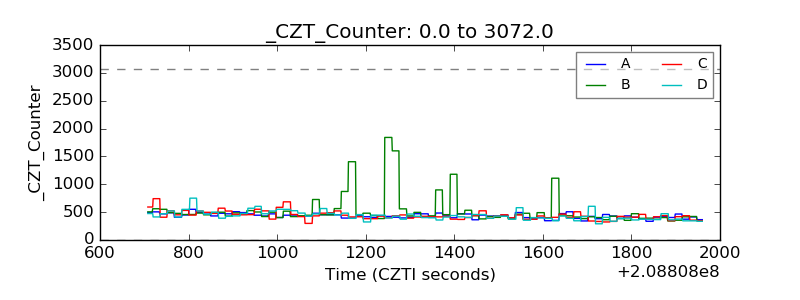 |
| +2.5 Volts monitor |  |
| +5 Volts monitor |  |
| _ROLL_ROT | 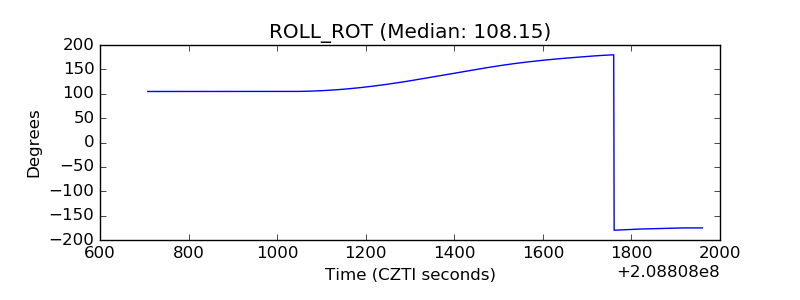 |
| _Roll_DEC | 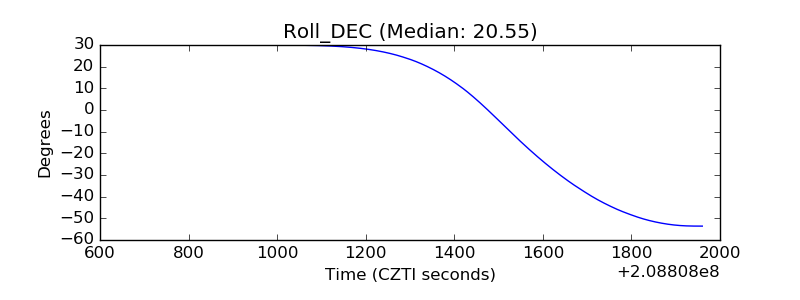 |
| _Roll_RA | 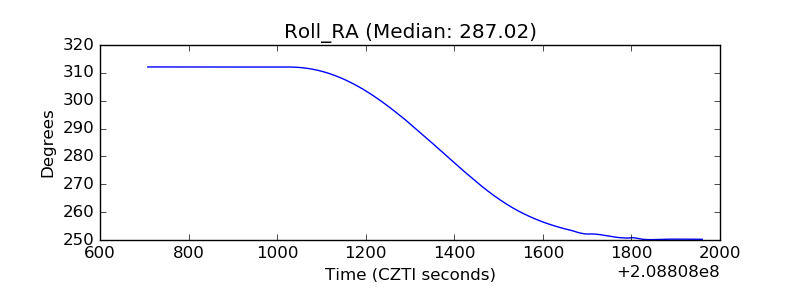 |
| Veto Counter | 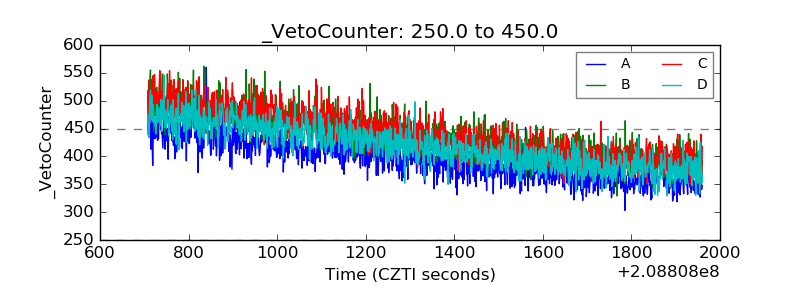 |