| Param | Original file | Final file |
|---|---|---|
| Filename | modeM0/AS1G05_212T01_9000000600cztM0_level2.fits | modeM0/AS1G05_212T01_9000000600cztM0_level2_quad_clean.evt |
| Size (bytes) | 325,540,800 | 376,401,600 |
| Size | 310.5 MB | 359.0 MB |
| Events in quadrant A | 1,956,224 | 2,357,734 |
| Events in quadrant B | 1,897,244 | 2,354,274 |
| Events in quadrant C | 1,864,218 | 2,149,891 |
| Events in quadrant D | 1,643,088 | 2,040,630 |
| Mode M0 | |||
|---|---|---|---|
| Quadrant | BADHDUFLAG | Total packets | Discarded packets |
| A | 0 | 74438 | 0 |
| B | 0 | 81755 | 0 |
| C | 0 | 103468 | 0 |
| D | 0 | 101848 | 0 |
| Mode M9 | |||
|---|---|---|---|
| Quadrant | BADHDUFLAG | Total packets | Discarded packets |
| A | 0 | 60 | 0 |
| B | 0 | 60 | 0 |
| C | 0 | 60 | 0 |
| D | 0 | 60 | 0 |
| Mode SS | |||
|---|---|---|---|
| Quadrant | BADHDUFLAG | Total packets | Discarded packets |
| A | 0 | 738 | 0 |
| B | 0 | 738 | 0 |
| C | 0 | 738 | 0 |
| D | 0 | 738 | 0 |
| Quadrant | Total seconds | Saturated seconds | Saturation percentage |
|---|---|---|---|
| A | 36365 | 211 | 0.580228% |
| B | 36364 | 596 | 1.638984% |
| C | 36367 | 1773 | 4.875299% |
| D | 36362 | 1387 | 3.814422% |
Noise dominated data is calculated using 1-second bins in cleaned event files. If a bin has >2000 counts, and if more than 50% of those come from <1% of pixels, then it is considered to be noise-dominated and hence unusable.
| Quadrant | # 1 sec bins | Bins with >0 counts | Bins with >2000 counts | High rate bins dominated by noise | Noise dominated (total time) | Noise dominated (detector-on time) | Marked lightcurve |
|---|---|---|---|---|---|---|---|
| A | 42165 | 36370 | 0 | 0 | 0.00% | 0.00% |  |
| B | 42165 | 36368 | 0 | 0 | 0.00% | 0.00% |  |
| C | 42165 | 36179 | 0 | 0 | 0.00% | 0.00% |  |
| D | 42165 | 36367 | 0 | 0 | 0.00% | 0.00% |  |
Top three noisy pixels from each quadrant. If the there are fewer than three noisy pixels in the level2.evt file, extra rows are filled as -1
| Pixel properties | Quadrant properties | ||||||
|---|---|---|---|---|---|---|---|
| Quadrant | DetID | PixID | Counts | Sigma | Mean | Median | Sigma |
| A | 0 | 29 | 1870 | 10.74 | 509 | 477 | 129.7 |
| A | 7 | 110 | 1642 | 8.98 | 509 | 477 | 129.7 |
| A | 9 | 19 | 1469 | 7.65 | 509 | 477 | 129.7 |
| B | 2 | 9 | 1643 | 11.55 | 501 | 478 | 100.9 |
| B | 12 | 226 | 1426 | 9.4 | 501 | 478 | 100.9 |
| B | 5 | 128 | 1273 | 7.88 | 501 | 478 | 100.9 |
| C | 1 | 80 | 1388 | 7.15 | 492 | 458 | 130.0 |
| C | 1 | 81 | 1327 | 6.68 | 492 | 458 | 130.0 |
| C | 9 | 188 | 1325 | 6.67 | 492 | 458 | 130.0 |
| D | 11 | 82 | 1283 | 6.81 | 467 | 424 | 126.1 |
| D | 3 | 31 | 1201 | 6.16 | 467 | 424 | 126.1 |
| D | 3 | 14 | 1193 | 6.1 | 467 | 424 | 126.1 |
Histogram calculated using DETX and DETY for each event in the final _common_clean file
| Quadrant A |  |
 |
Quadrant B |
|---|---|---|---|
| Quadrant D |  |
 |
Quadrant C |
| Plot type | Count rate plots | Images |
|---|---|---|
| Comparison with Poisson distribution Blue bars denote a histogram of data divided into 1 sec bins. Red curve is a Poisson curve with rate = median count rate of data. |
 |
 |
| Quadrant-wise count rates Data is divided into 100 sec bins |
 |
|
| Module-wise count rates for Quadrant A Data is divided into 100 sec bins |
 |
 |
| Module-wise count rates for Quadrant B Data is divided into 100 sec bins |
 |
 |
| Module-wise count rates for Quadrant C Data is divided into 100 sec bins |
 |
 |
| Module-wise count rates for Quadrant D Data is divided into 100 sec bins |
 |
 |
| Parameter | Plot |
|---|---|
| CZT HV Monitor |  |
| D_VDD | 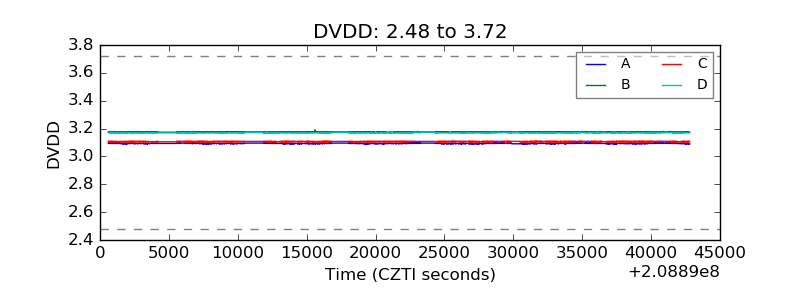 |
| Temperature 1 |  |
| Veto HV Monitor |  |
| Veto LLD |  |
| Alpha Counter |  |
| _CPM_Rate |  |
| CZT Counter |  |
| +2.5 Volts monitor |  |
| +5 Volts monitor |  |
| _ROLL_ROT |  |
| _Roll_DEC |  |
| _Roll_RA |  |
| Veto Counter |  |