| Param | Original file | Final file |
|---|---|---|
| Filename | modeM0/AS1G05_212T01_9000000600_04761cztM0_level2.evt | modeM0/AS1G05_212T01_9000000600_04761cztM0_level2_quad_clean.evt |
| Size (bytes) | 415,163,520 | 54,904,320 |
| Size | 395.9 MB | 52.4 MB |
| Events in quadrant A | 2,256,932 | 338,545 |
| Events in quadrant B | 2,860,457 | 335,899 |
| Events in quadrant C | 3,266,300 | 324,575 |
| Events in quadrant D | 3,850,742 | 313,210 |
| Mode M0 | |||
|---|---|---|---|
| Quadrant | BADHDUFLAG | Total packets | Discarded packets |
| A | 0 | 10278 | 2 |
| B | 0 | 11844 | 1 |
| C | 0 | 13165 | 1 |
| D | 0 | 14866 | 1 |
| Mode M9 | |||
|---|---|---|---|
| Quadrant | BADHDUFLAG | Total packets | Discarded packets |
| A | 0 | 13 | 0 |
| B | 0 | 13 | 0 |
| C | 0 | 13 | 0 |
| D | 0 | 13 | 0 |
| Mode SS | |||
|---|---|---|---|
| Quadrant | BADHDUFLAG | Total packets | Discarded packets |
| A | 0 | 102 | 0 |
| B | 0 | 102 | 0 |
| C | 0 | 102 | 0 |
| D | 0 | 102 | 0 |
| Quadrant | Total seconds | Saturated seconds | Saturation percentage |
|---|---|---|---|
| A | 4989 | 21 | 0.420926% |
| B | 4989 | 122 | 2.445380% |
| C | 4989 | 62 | 1.242734% |
| D | 4989 | 97 | 1.944277% |
Noise dominated data is calculated using 1-second bins in cleaned event files. If a bin has >2000 counts, and if more than 50% of those come from <1% of pixels, then it is considered to be noise-dominated and hence unusable.
| Quadrant | # 1 sec bins | Bins with >0 counts | Bins with >2000 counts | High rate bins dominated by noise | Noise dominated (total time) | Noise dominated (detector-on time) | Marked lightcurve |
|---|---|---|---|---|---|---|---|
| A | 6309 | 4990 | 1 | 1 | 0.02% | 0.02% | 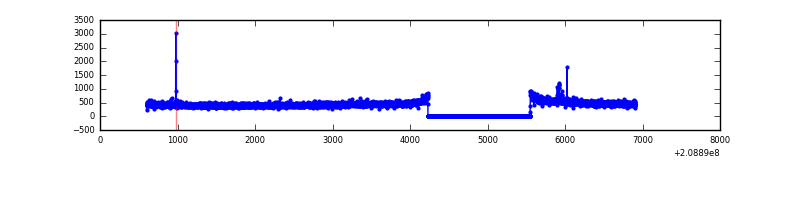 |
| B | 6309 | 4990 | 49 | 49 | 0.78% | 0.98% | 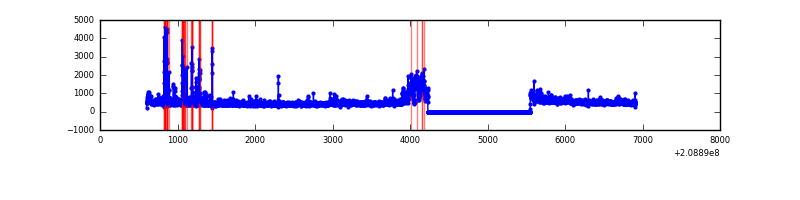 |
| C | 6309 | 4990 | 26 | 26 | 0.41% | 0.52% | 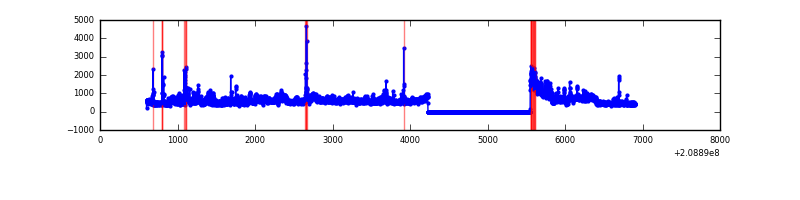 |
| D | 6309 | 4990 | 83 | 83 | 1.32% | 1.66% | 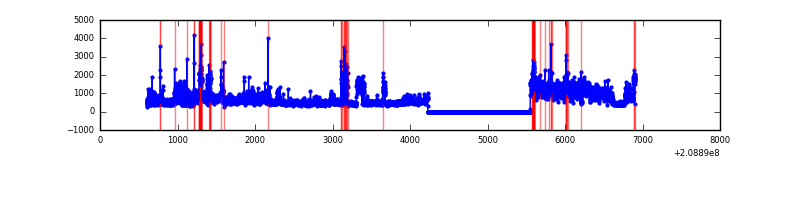 |
Top three noisy pixels from each quadrant. If the there are fewer than three noisy pixels in the level2.evt file, extra rows are filled as -1
| Pixel properties | Quadrant properties | ||||||
|---|---|---|---|---|---|---|---|
| Quadrant | DetID | PixID | Counts | Sigma | Mean | Median | Sigma |
| A | 0 | 118 | 13292 | 108.55 | 578 | 565 | 117.2 |
| A | 0 | 50 | 9487 | 76.1 | 578 | 565 | 117.2 |
| A | 0 | 226 | 6950 | 54.46 | 578 | 565 | 117.2 |
| B | 14 | 167 | 453716 | 4103.26 | 585 | 573 | 110.4 |
| B | 4 | 80 | 100035 | 900.64 | 585 | 573 | 110.4 |
| B | 15 | 204 | 45600 | 407.72 | 585 | 573 | 110.4 |
| C | 14 | 48 | 996583 | 7821.69 | 556 | 558 | 127.3 |
| C | 1 | 16 | 89197 | 696.07 | 556 | 558 | 127.3 |
| C | 12 | 4 | 9424 | 69.62 | 556 | 558 | 127.3 |
| D | 11 | 132 | 1210568 | 9041.21 | 553 | 534 | 133.8 |
| D | 13 | 235 | 344708 | 2571.62 | 553 | 534 | 133.8 |
| D | 10 | 15 | 106297 | 790.25 | 553 | 534 | 133.8 |
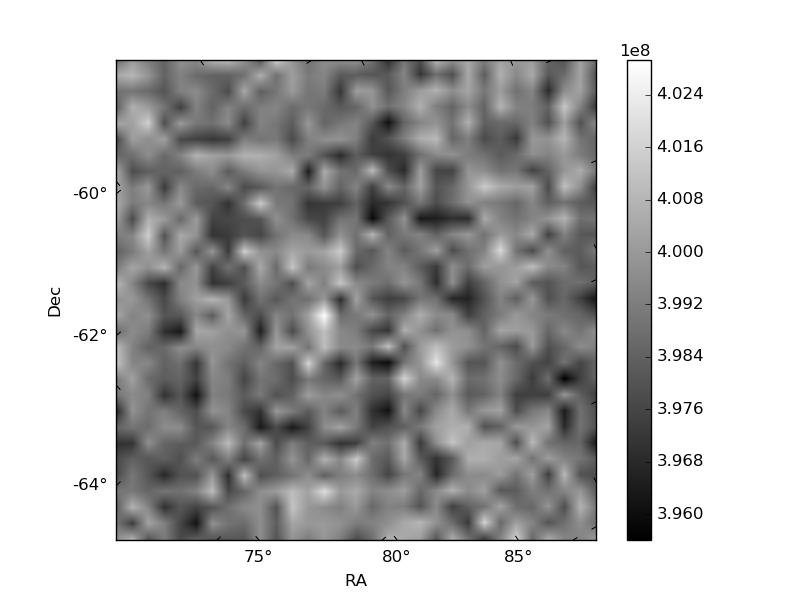
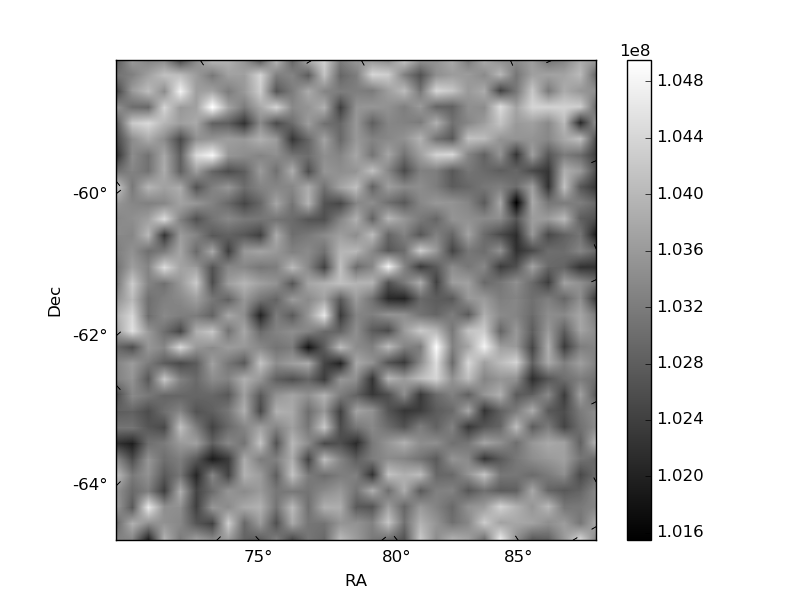
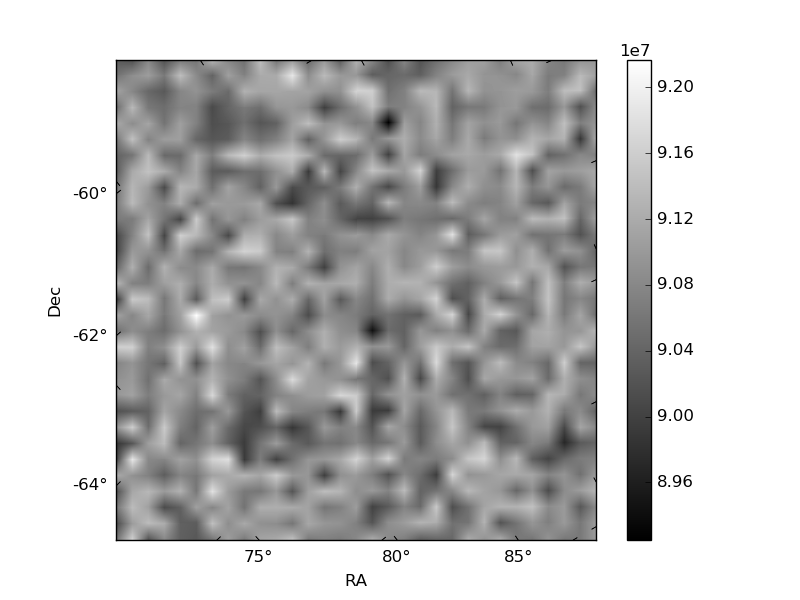
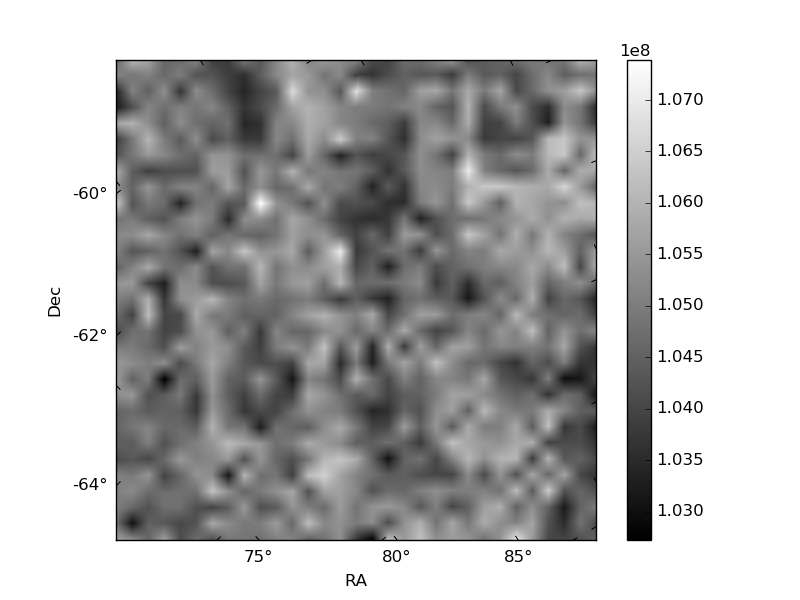
Histogram calculated using DETX and DETY for each event in the final _common_clean file
| Quadrant A | 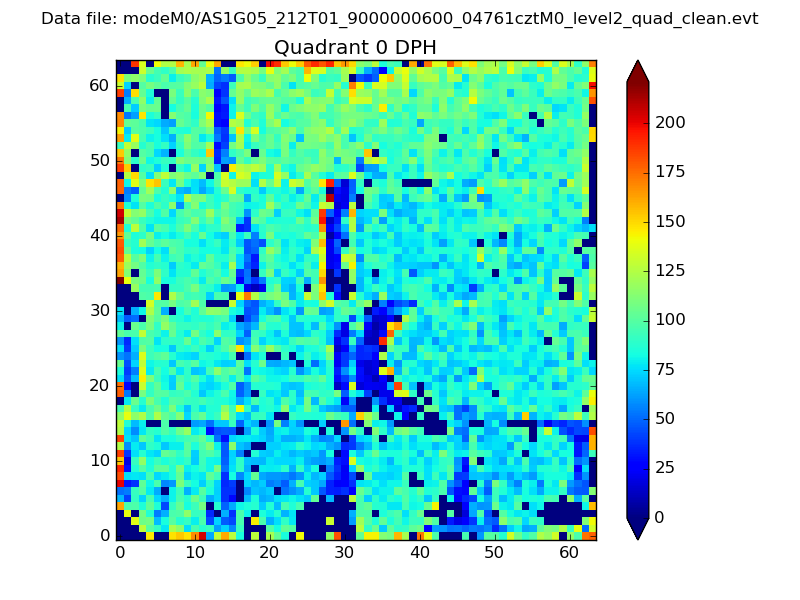 |
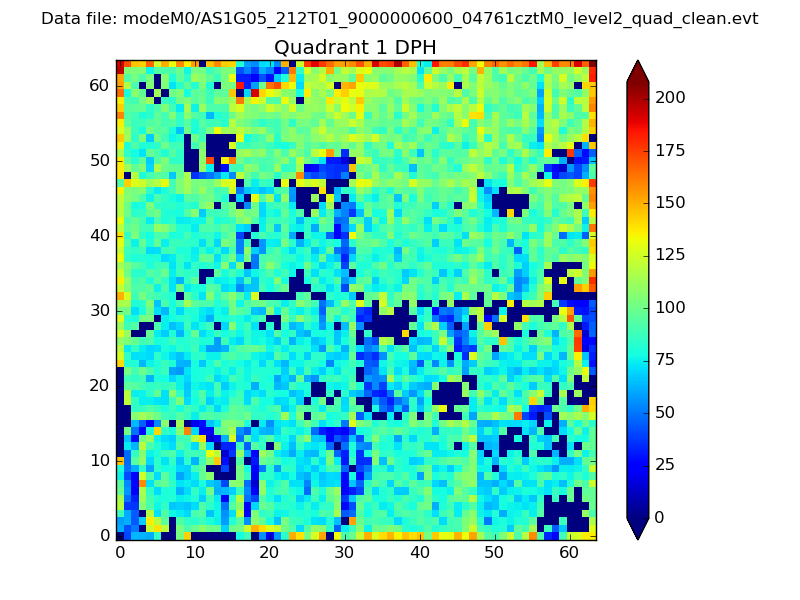 |
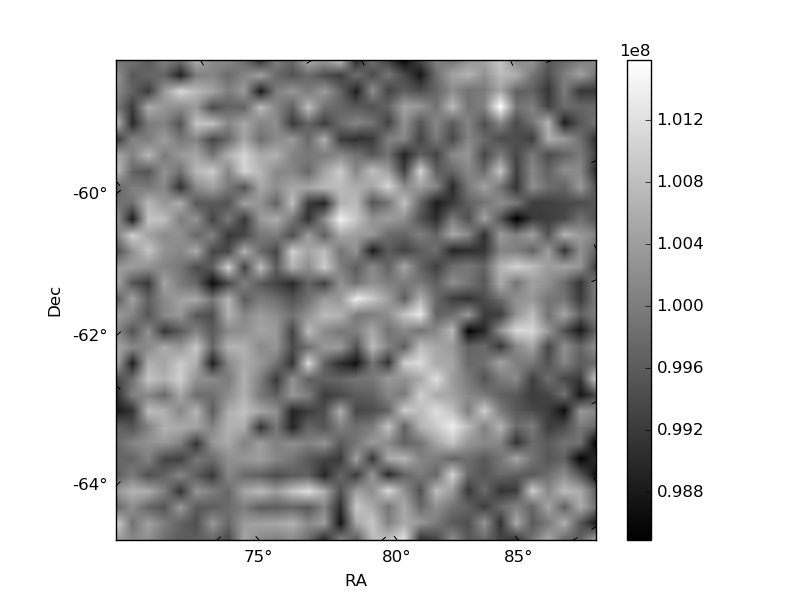
Quadrant B |
|---|---|---|---|
| Quadrant D | 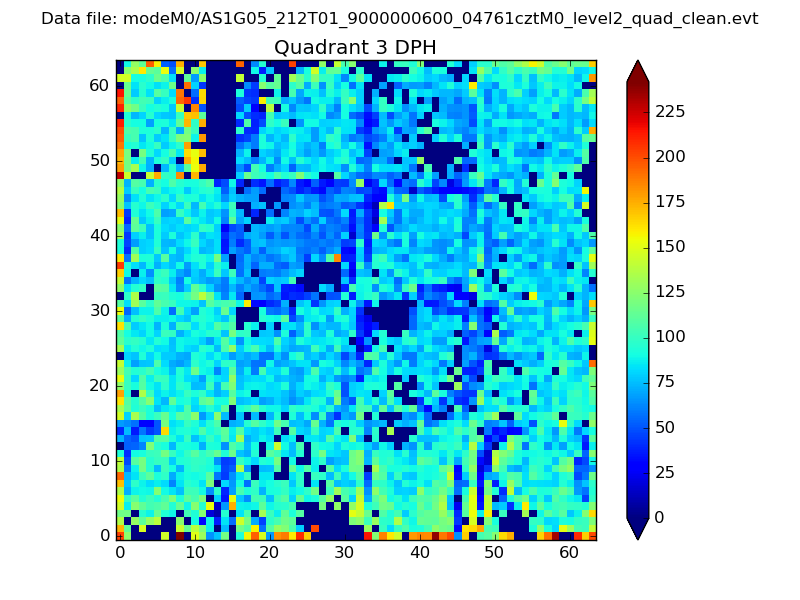 |
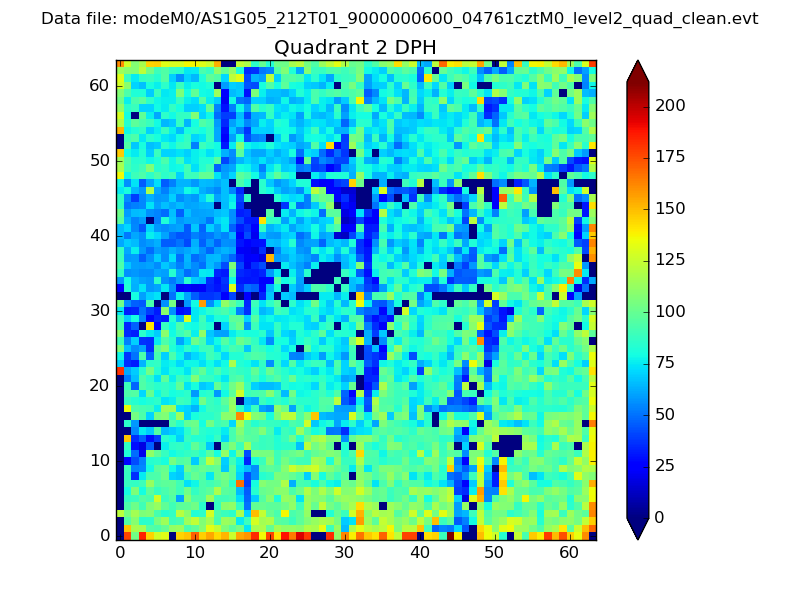 |
Quadrant C |
| Plot type | Count rate plots | Images |
|---|---|---|
| Comparison with Poisson distribution Blue bars denote a histogram of data divided into 1 sec bins. Red curve is a Poisson curve with rate = median count rate of data. |
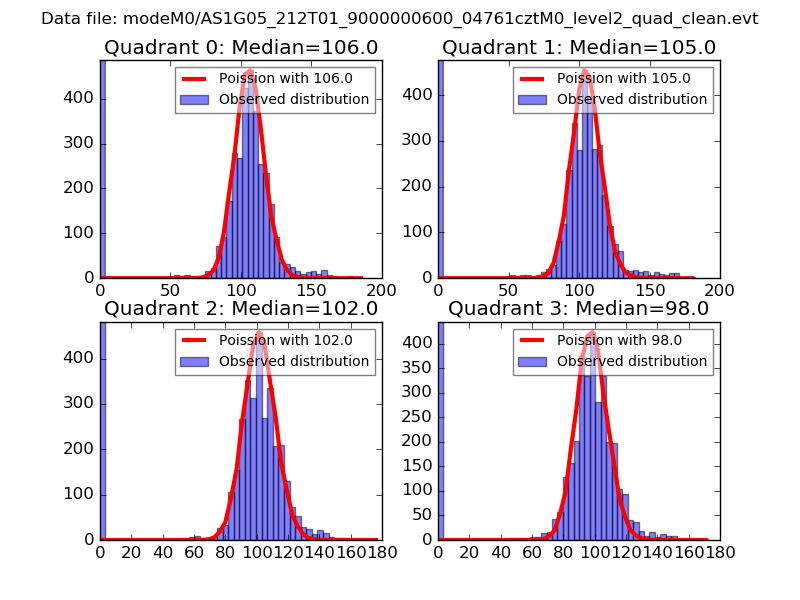 |
 |
| Quadrant-wise count rates Data is divided into 100 sec bins |
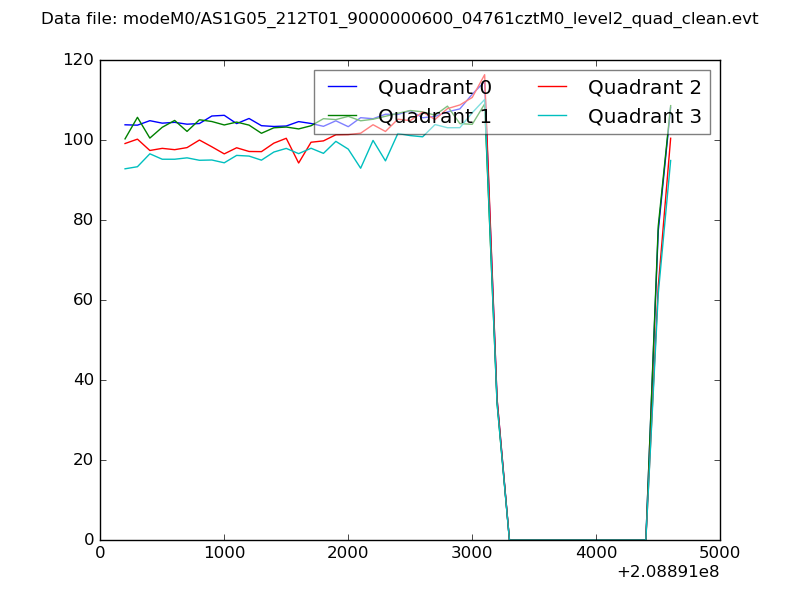 |
|
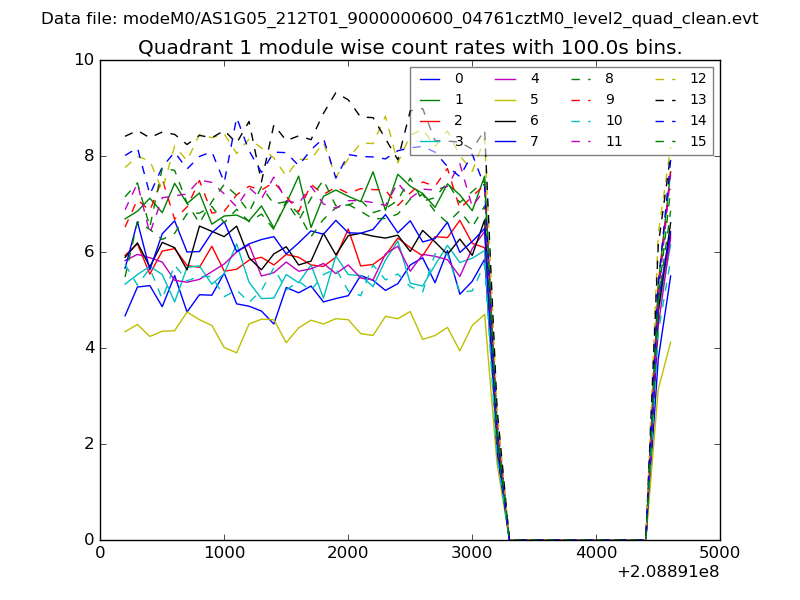
| Module-wise count rates for Quadrant A Data is divided into 100 sec bins |
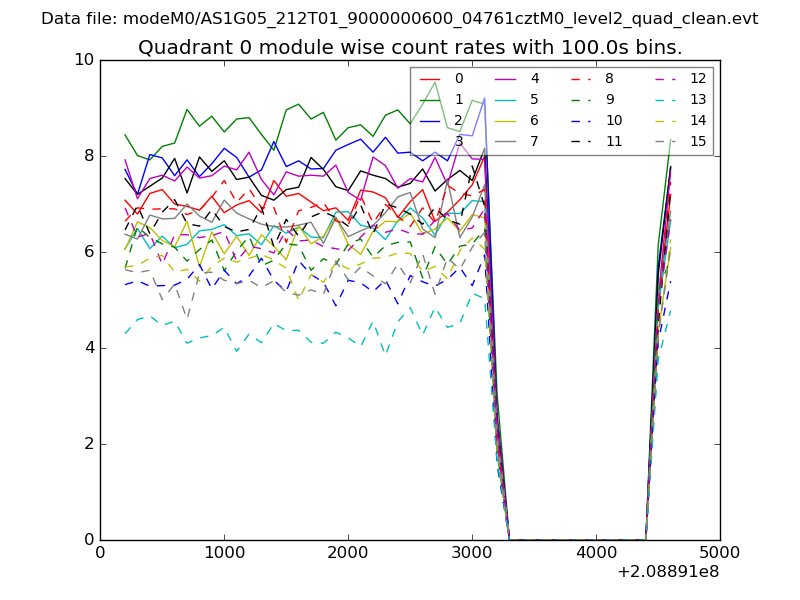 |
 |
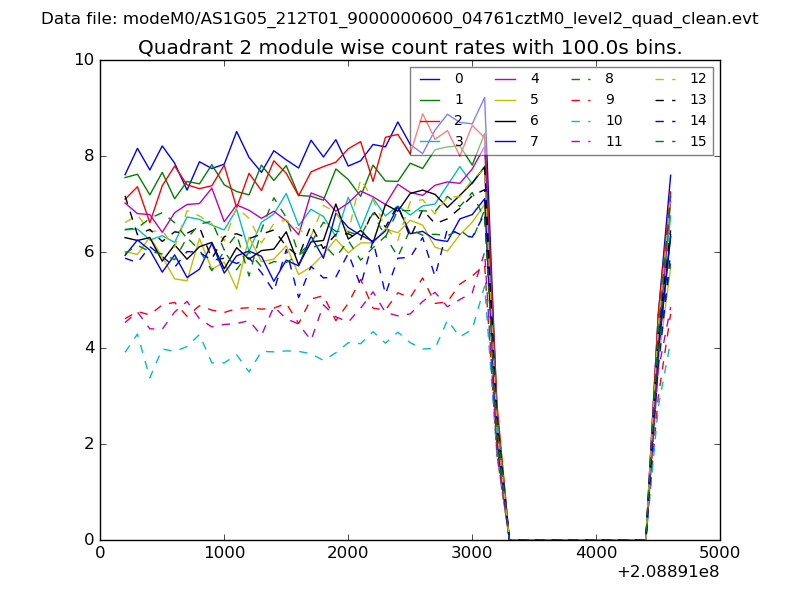
| Module-wise count rates for Quadrant B Data is divided into 100 sec bins |
 |
 |
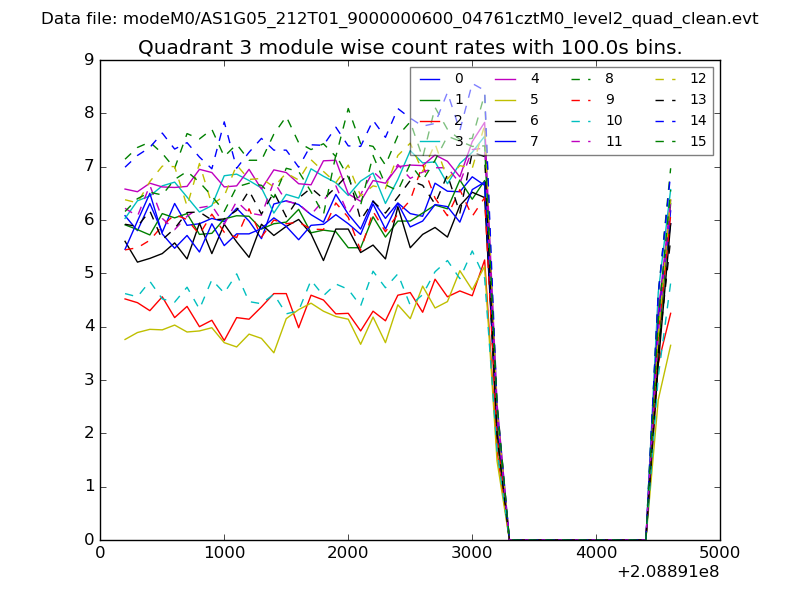
| Module-wise count rates for Quadrant C Data is divided into 100 sec bins |
 |
 |
| Module-wise count rates for Quadrant D Data is divided into 100 sec bins |
 |
 |
| Parameter | Plot |
|---|---|
| CZT HV Monitor | 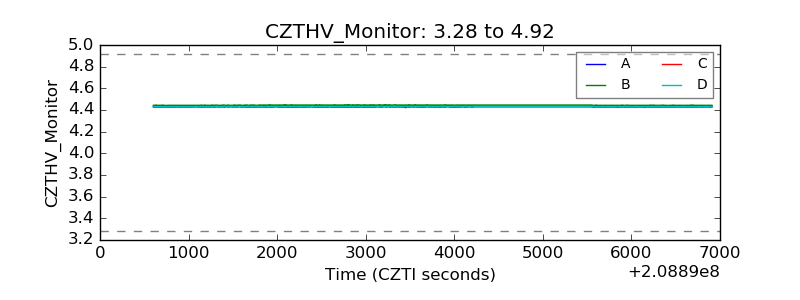 |
| D_VDD | 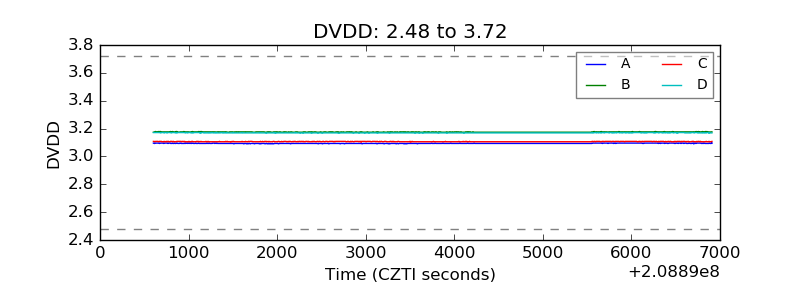 |
| Temperature 1 |  |
| Veto HV Monitor | 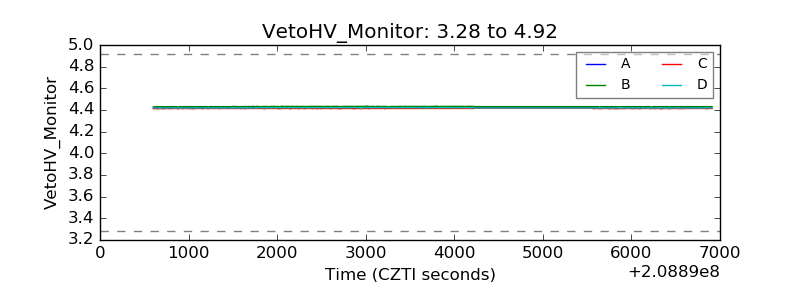 |
| Veto LLD | 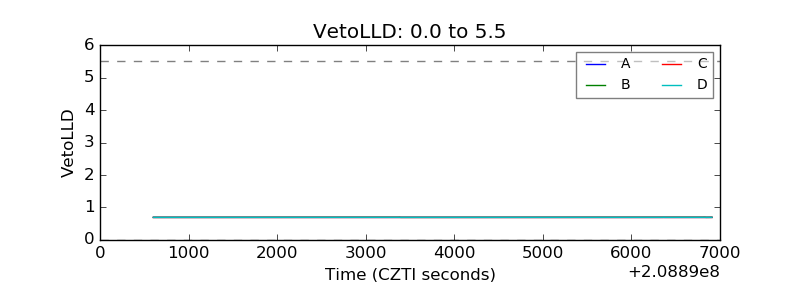 |
| Alpha Counter | 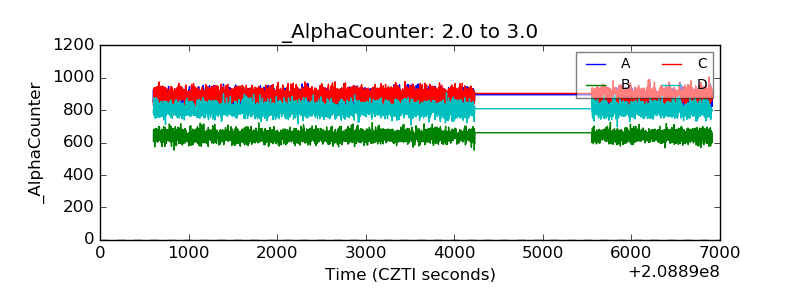 |
| _CPM_Rate |  |
| CZT Counter | 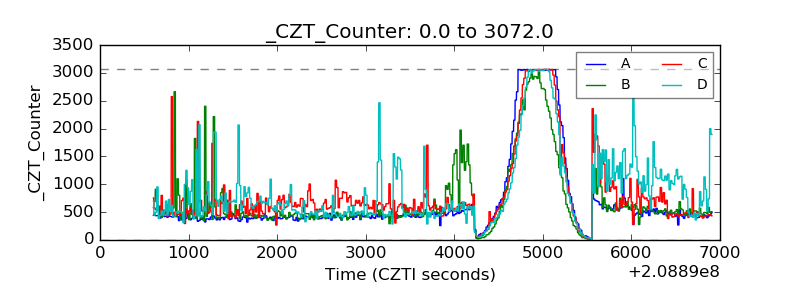 |
| +2.5 Volts monitor |  |
| +5 Volts monitor |  |
| _ROLL_ROT | 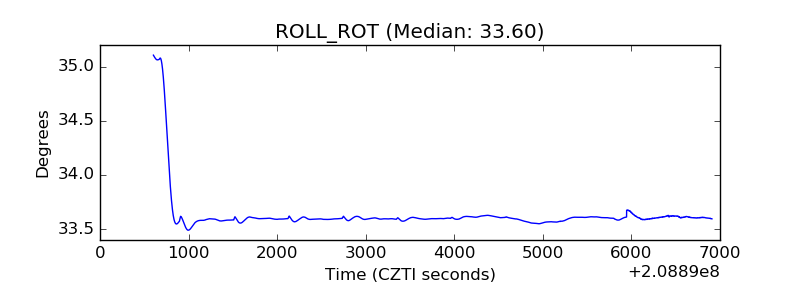 |
| _Roll_DEC | 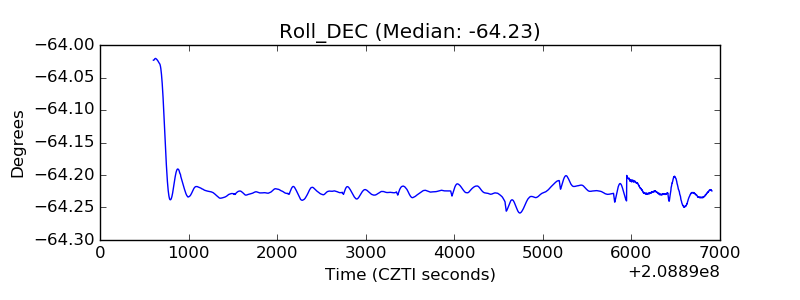 |
| _Roll_RA | 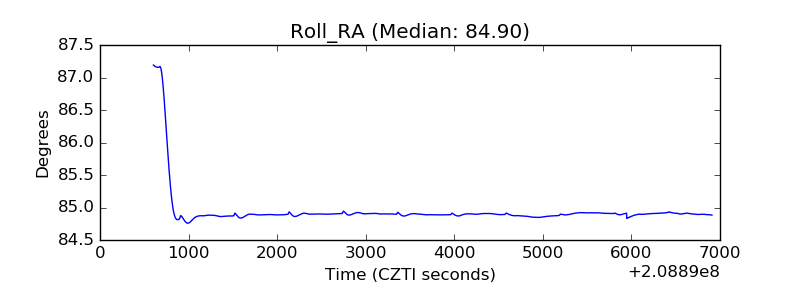 |
| Veto Counter | 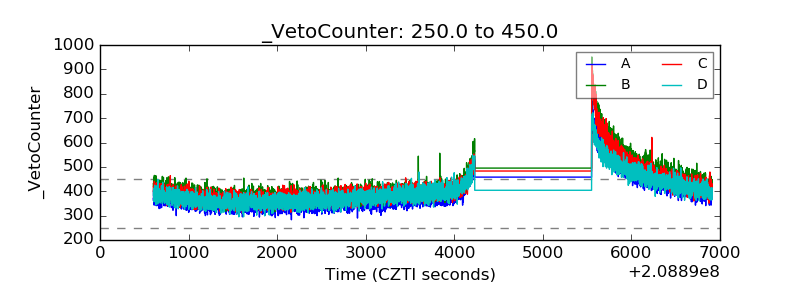 |