| Param | Original file | Final file |
|---|---|---|
| Filename | modeM0/AS1G05_212T01_9000000600_04762cztM0_level2.evt | modeM0/AS1G05_212T01_9000000600_04762cztM0_level2_quad_clean.evt |
| Size (bytes) | 542,217,600 | 64,503,360 |
| Size | 517.1 MB | 61.5 MB |
| Events in quadrant A | 2,772,784 | 394,721 |
| Events in quadrant B | 3,050,142 | 398,415 |
| Events in quadrant C | 5,139,760 | 375,203 |
| Events in quadrant D | 5,051,674 | 364,590 |
| Mode M0 | |||
|---|---|---|---|
| Quadrant | BADHDUFLAG | Total packets | Discarded packets |
| A | 0 | 12354 | 2 |
| B | 0 | 12949 | 3 |
| C | 0 | 19413 | 5 |
| D | 0 | 19147 | 5 |
| Mode M9 | |||
|---|---|---|---|
| Quadrant | BADHDUFLAG | Total packets | Discarded packets |
| A | 0 | 14 | 0 |
| B | 0 | 14 | 0 |
| C | 0 | 14 | 0 |
| D | 0 | 14 | 0 |
| Mode SS | |||
|---|---|---|---|
| Quadrant | BADHDUFLAG | Total packets | Discarded packets |
| A | 0 | 122 | 0 |
| B | 0 | 122 | 0 |
| C | 0 | 122 | 0 |
| D | 0 | 122 | 0 |
| Quadrant | Total seconds | Saturated seconds | Saturation percentage |
|---|---|---|---|
| A | 6014 | 38 | 0.631859% |
| B | 6013 | 61 | 1.014469% |
| C | 6013 | 78 | 1.297189% |
| D | 6013 | 125 | 2.078829% |
Noise dominated data is calculated using 1-second bins in cleaned event files. If a bin has >2000 counts, and if more than 50% of those come from <1% of pixels, then it is considered to be noise-dominated and hence unusable.
| Quadrant | # 1 sec bins | Bins with >0 counts | Bins with >2000 counts | High rate bins dominated by noise | Noise dominated (total time) | Noise dominated (detector-on time) | Marked lightcurve |
|---|---|---|---|---|---|---|---|
| A | 7354 | 6015 | 2 | 2 | 0.03% | 0.03% | 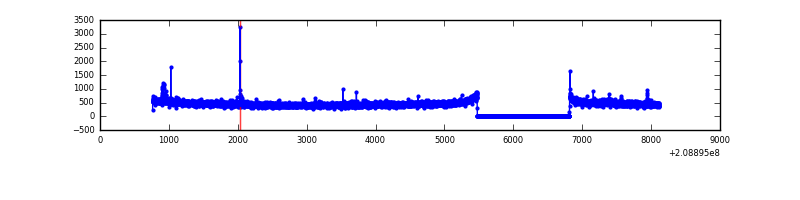 |
| B | 7354 | 6015 | 15 | 15 | 0.20% | 0.25% | 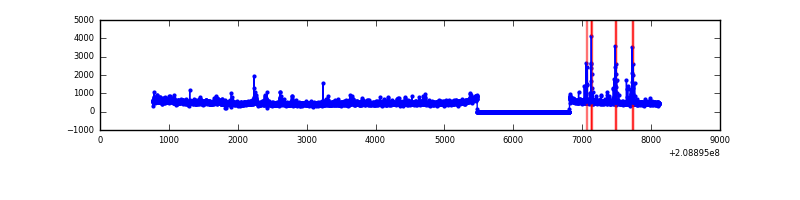 |
| C | 7354 | 6015 | 14 | 14 | 0.19% | 0.23% | 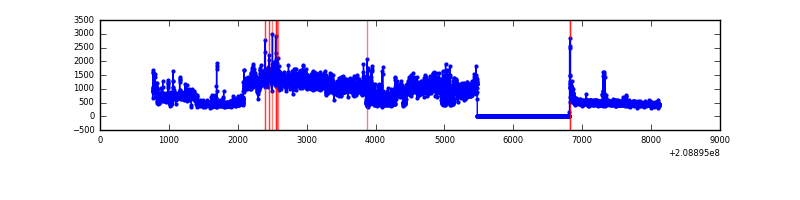 |
| D | 7354 | 6015 | 76 | 76 | 1.03% | 1.26% | 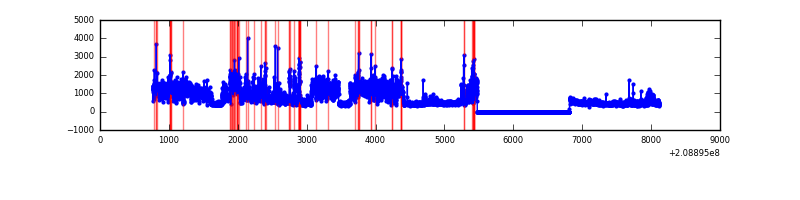 |
Top three noisy pixels from each quadrant. If the there are fewer than three noisy pixels in the level2.evt file, extra rows are filled as -1
| Pixel properties | Quadrant properties | ||||||
|---|---|---|---|---|---|---|---|
| Quadrant | DetID | PixID | Counts | Sigma | Mean | Median | Sigma |
| A | 0 | 50 | 21344 | 143.79 | 712 | 695 | 143.6 |
| A | 0 | 226 | 7628 | 48.28 | 712 | 695 | 143.6 |
| A | 12 | 194 | 7350 | 46.34 | 712 | 695 | 143.6 |
| B | 14 | 167 | 159385 | 1174.56 | 721 | 705 | 135.1 |
| B | 4 | 80 | 73770 | 540.83 | 721 | 705 | 135.1 |
| B | 15 | 204 | 25162 | 181.03 | 721 | 705 | 135.1 |
| C | 14 | 48 | 2387430 | 15345.81 | 681 | 685 | 155.5 |
| C | 1 | 16 | 77083 | 491.21 | 681 | 685 | 155.5 |
| C | 12 | 4 | 9895 | 59.22 | 681 | 685 | 155.5 |
| D | 11 | 132 | 1892552 | 11677.98 | 677 | 657 | 162.0 |
| D | 13 | 235 | 397706 | 2450.84 | 677 | 657 | 162.0 |
| D | 2 | 136 | 108887 | 668.06 | 677 | 657 | 162.0 |
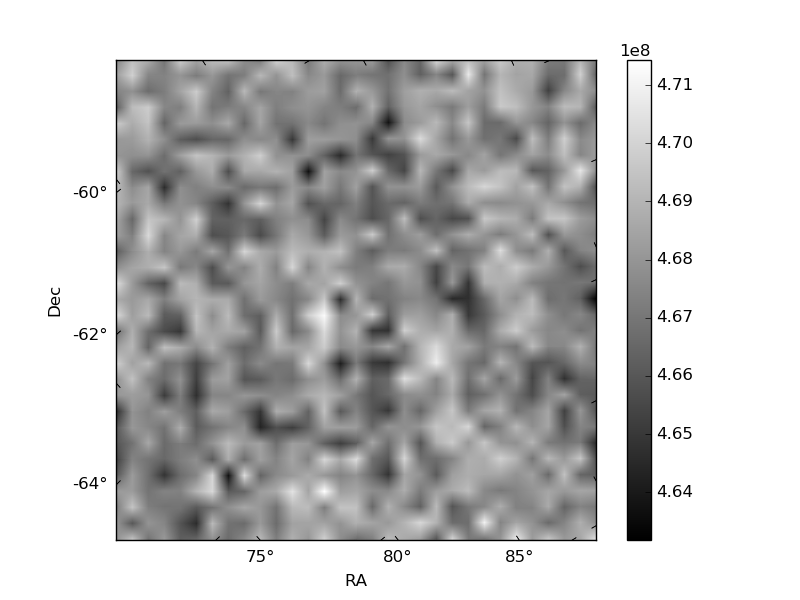
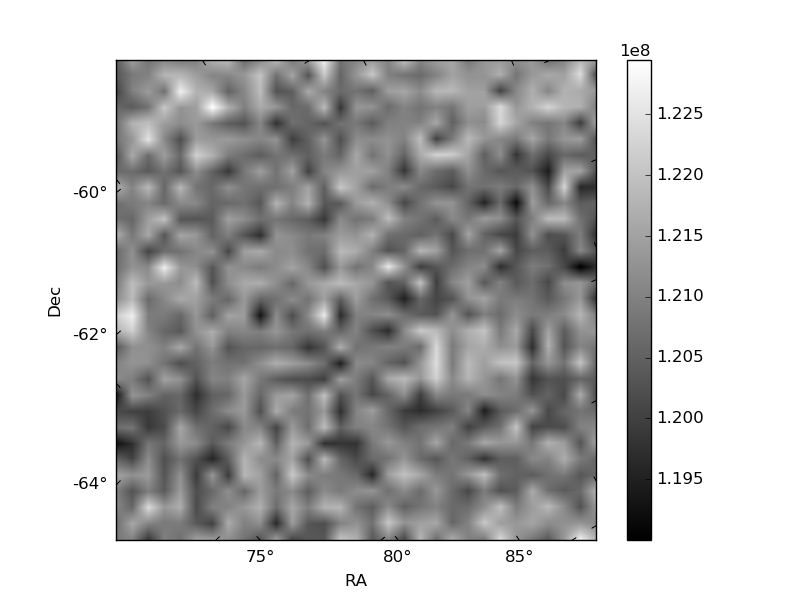
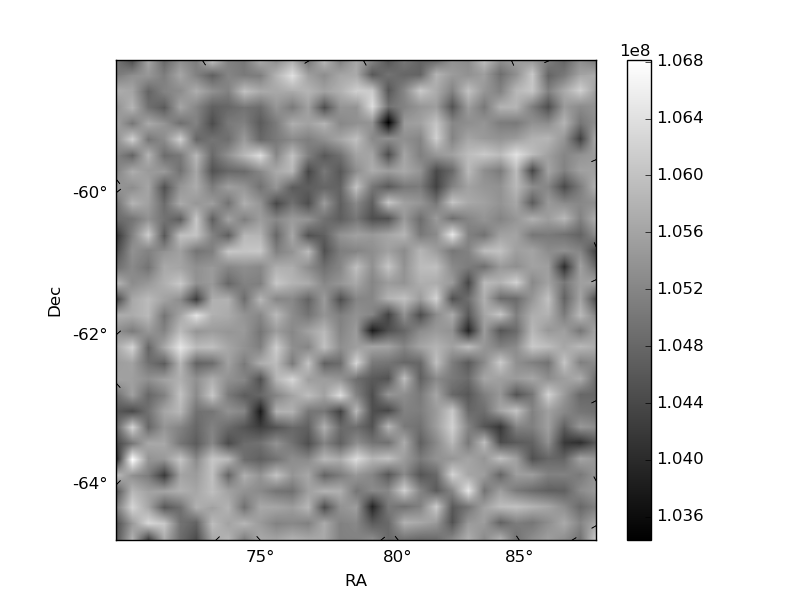
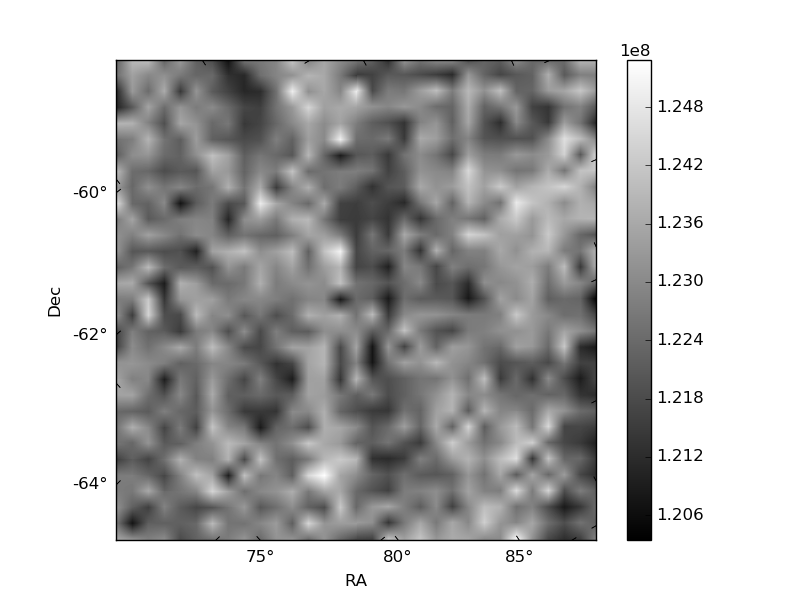
Histogram calculated using DETX and DETY for each event in the final _common_clean file
| Quadrant A | 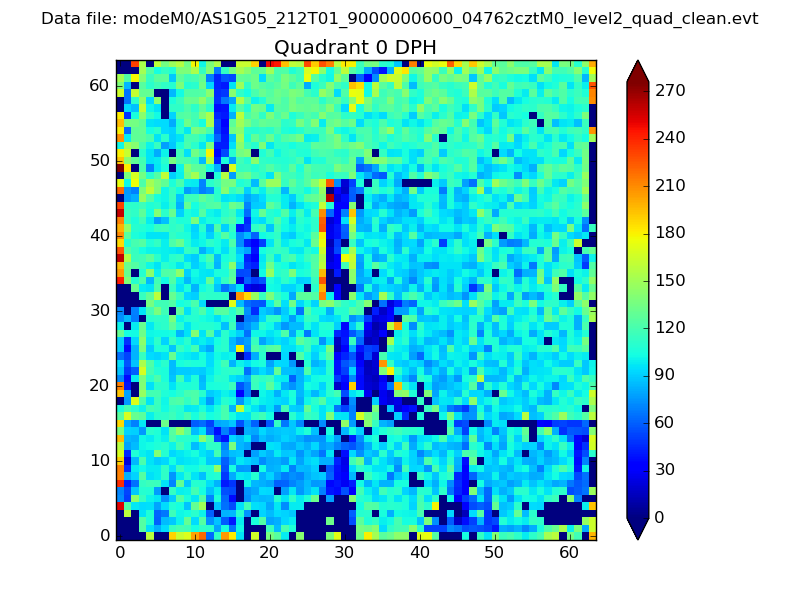 |
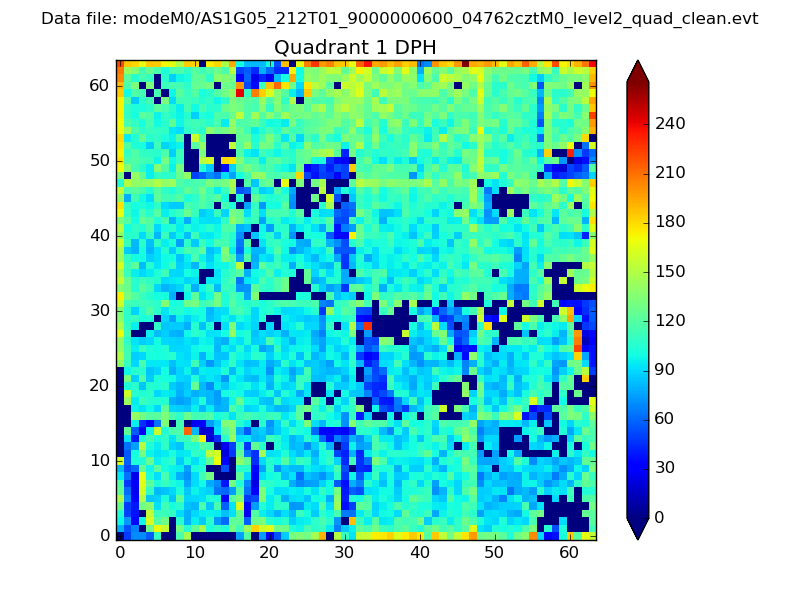 |
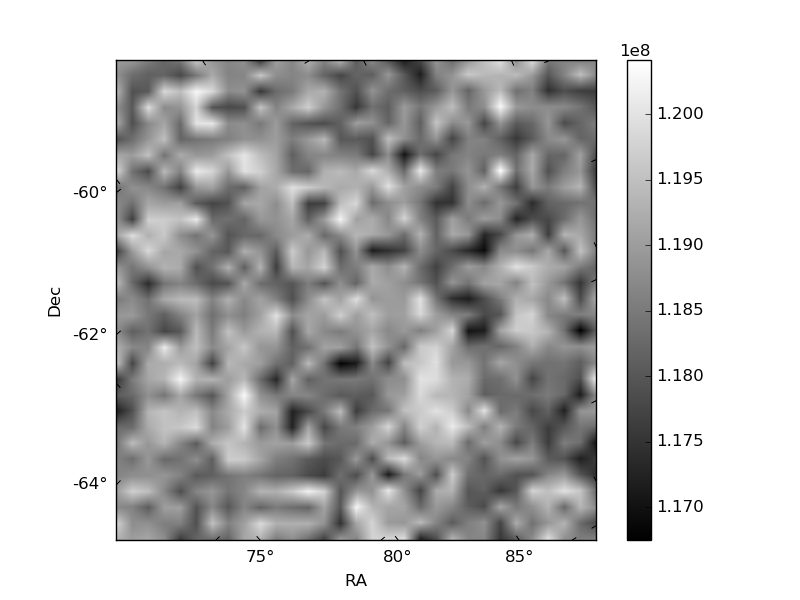
Quadrant B |
|---|---|---|---|
| Quadrant D | 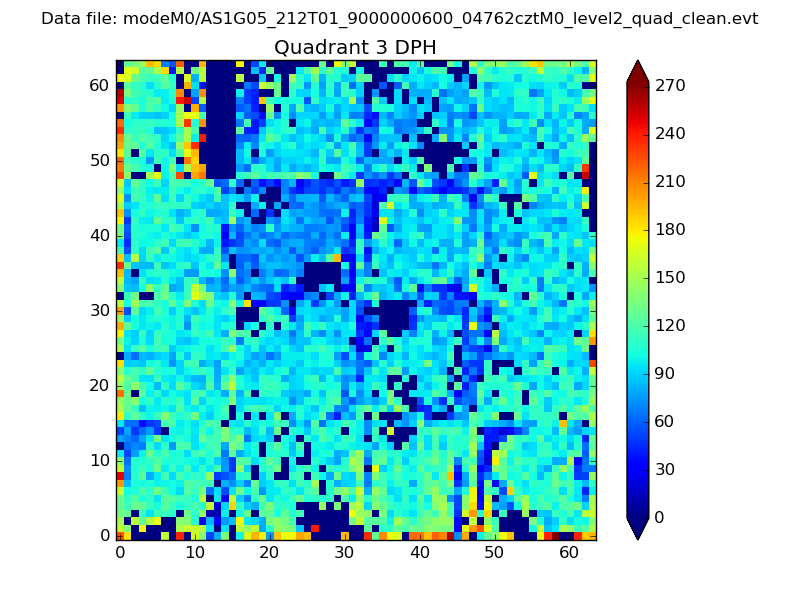 |
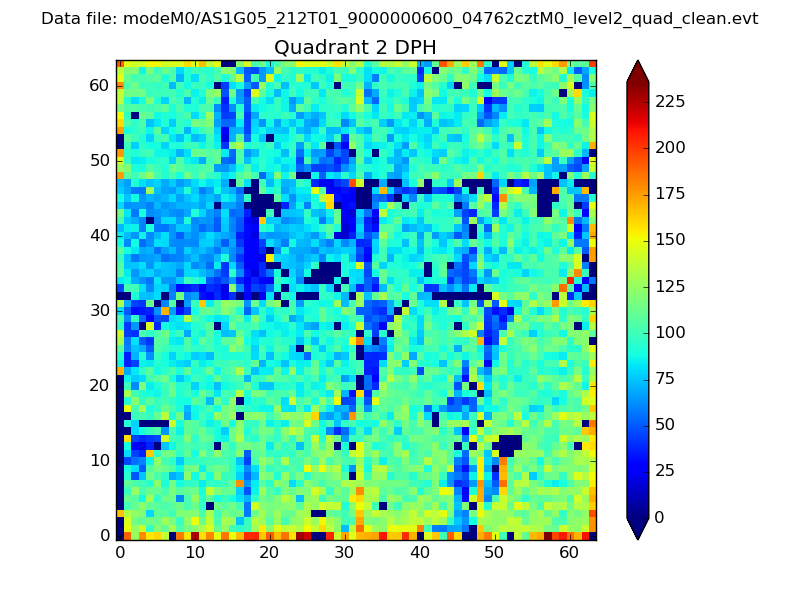 |
Quadrant C |
| Plot type | Count rate plots | Images |
|---|---|---|
| Comparison with Poisson distribution Blue bars denote a histogram of data divided into 1 sec bins. Red curve is a Poisson curve with rate = median count rate of data. |
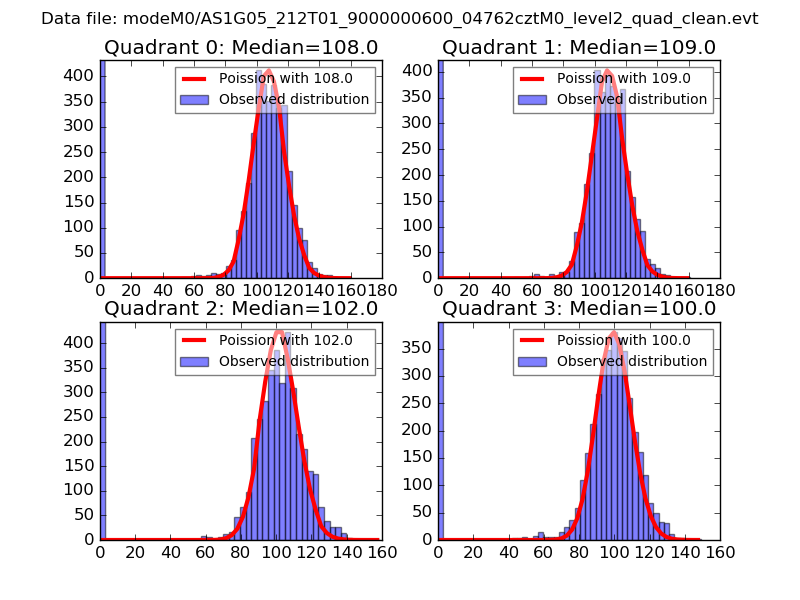 |
 |
| Quadrant-wise count rates Data is divided into 100 sec bins |
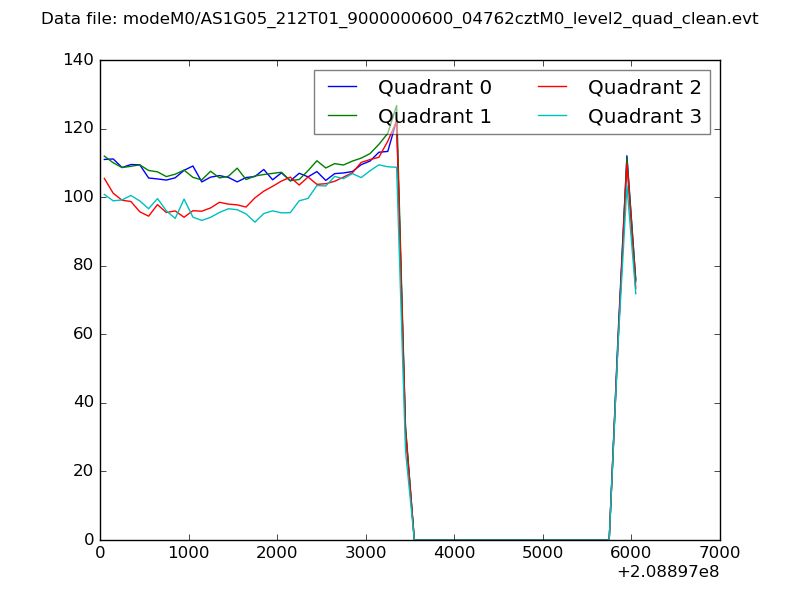 |
|
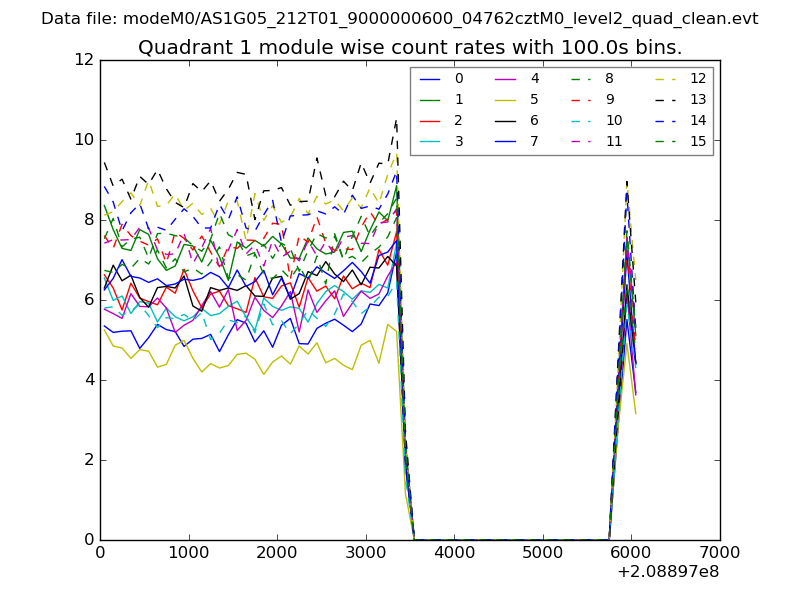
| Module-wise count rates for Quadrant A Data is divided into 100 sec bins |
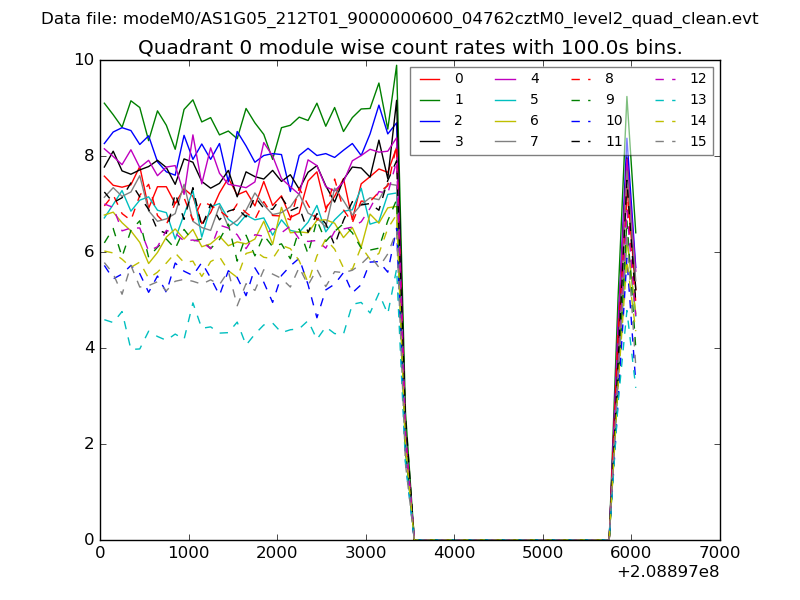 |
 |
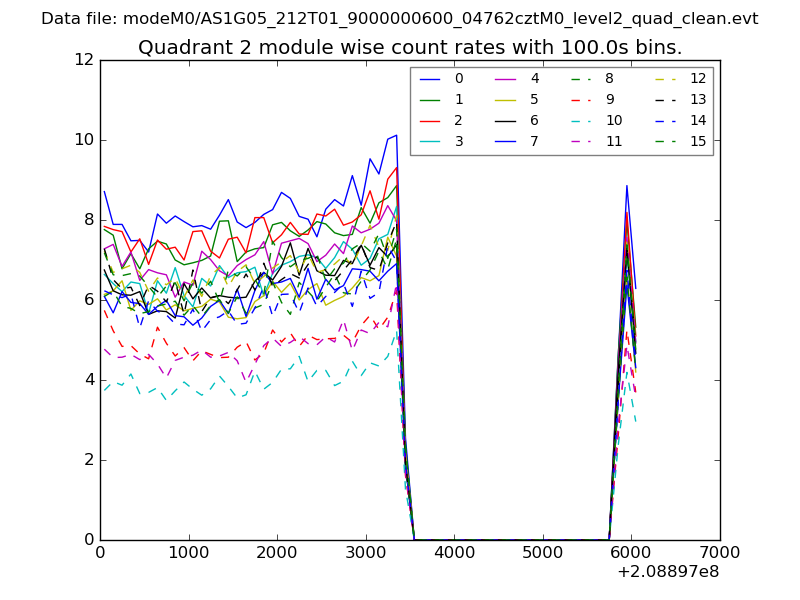
| Module-wise count rates for Quadrant B Data is divided into 100 sec bins |
 |
 |
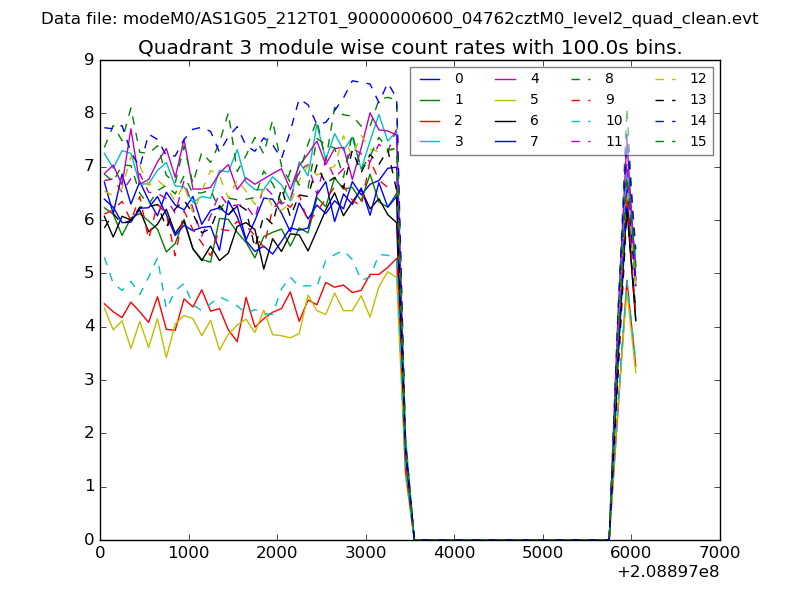
| Module-wise count rates for Quadrant C Data is divided into 100 sec bins |
 |
 |
| Module-wise count rates for Quadrant D Data is divided into 100 sec bins |
 |
 |
| Parameter | Plot |
|---|---|
| CZT HV Monitor | 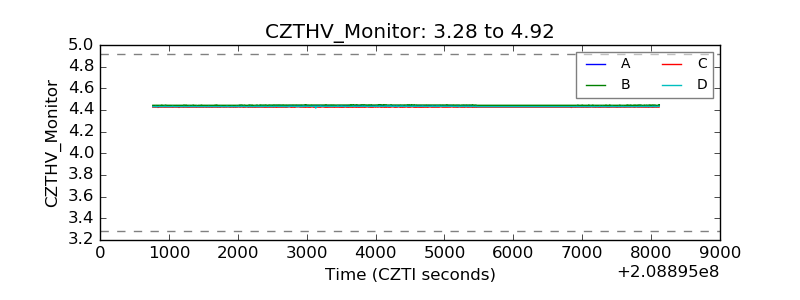 |
| D_VDD | 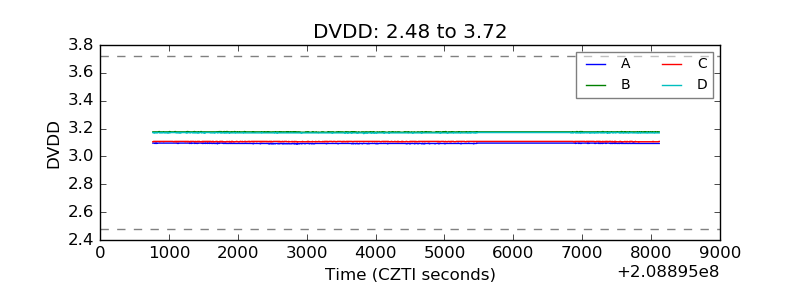 |
| Temperature 1 | 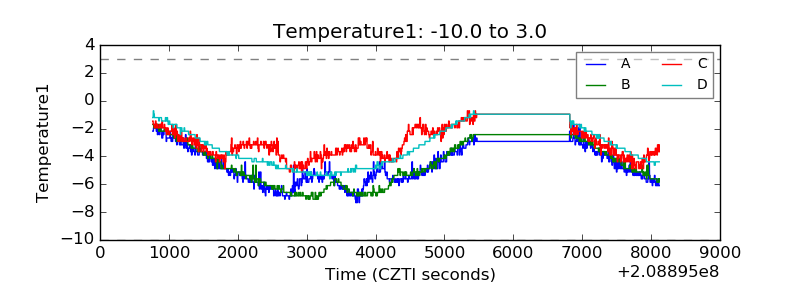 |
| Veto HV Monitor | 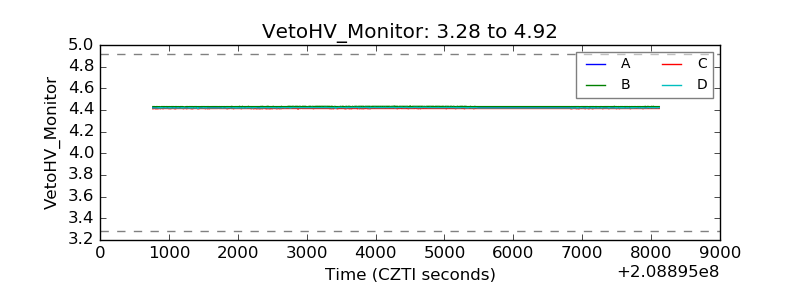 |
| Veto LLD | 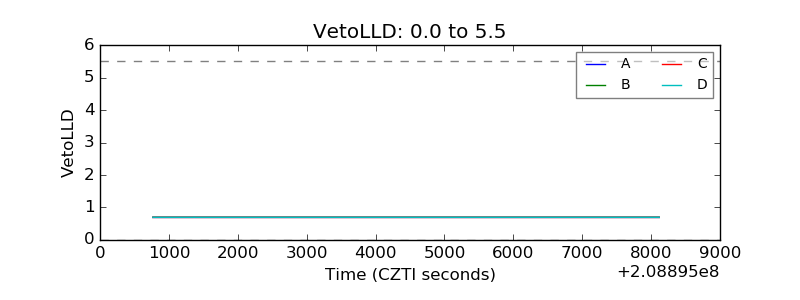 |
| Alpha Counter | 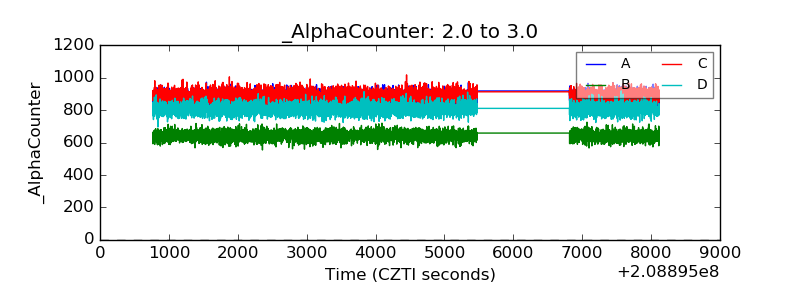 |
| _CPM_Rate |  |
| CZT Counter | 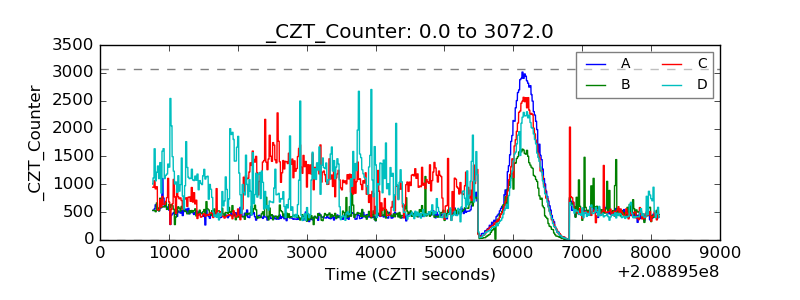 |
| +2.5 Volts monitor |  |
| +5 Volts monitor |  |
| _ROLL_ROT | 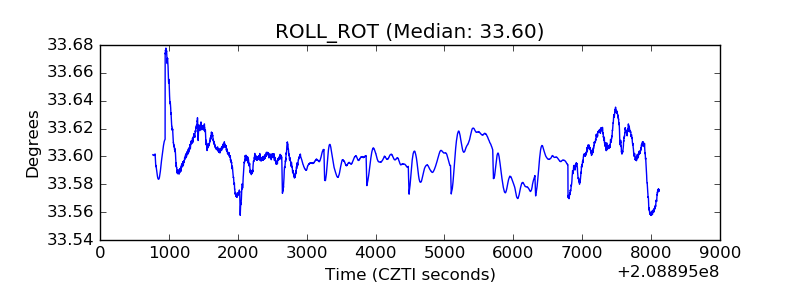 |
| _Roll_DEC |  |
| _Roll_RA | 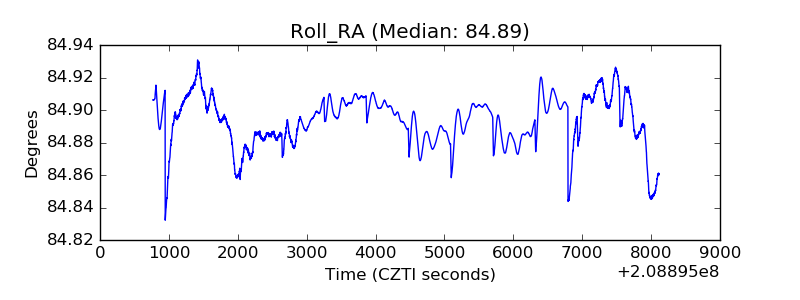 |
| Veto Counter | 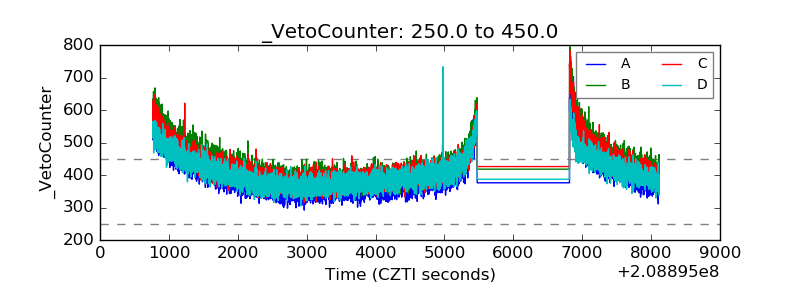 |