| Param | Original file | Final file |
|---|---|---|
| Filename | modeM0/AS1G05_212T01_9000000600_04763cztM0_level2.evt | modeM0/AS1G05_212T01_9000000600_04763cztM0_level2_quad_clean.evt |
| Size (bytes) | 476,930,880 | 77,224,320 |
| Size | 454.8 MB | 73.6 MB |
| Events in quadrant A | 2,848,753 | 485,670 |
| Events in quadrant B | 3,300,861 | 487,319 |
| Events in quadrant C | 4,588,744 | 464,634 |
| Events in quadrant D | 3,276,735 | 459,956 |
| Mode M0 | |||
|---|---|---|---|
| Quadrant | BADHDUFLAG | Total packets | Discarded packets |
| A | 0 | 12938 | 3 |
| B | 0 | 13967 | 2 |
| C | 0 | 17799 | 2 |
| D | 0 | 14207 | 2 |
| Mode M9 | |||
|---|---|---|---|
| Quadrant | BADHDUFLAG | Total packets | Discarded packets |
| A | 0 | 17 | 0 |
| B | 0 | 17 | 0 |
| C | 0 | 17 | 0 |
| D | 0 | 18 | 0 |
| Mode SS | |||
|---|---|---|---|
| Quadrant | BADHDUFLAG | Total packets | Discarded packets |
| A | 0 | 128 | 0 |
| B | 0 | 128 | 0 |
| C | 0 | 128 | 0 |
| D | 0 | 128 | 0 |
| Quadrant | Total seconds | Saturated seconds | Saturation percentage |
|---|---|---|---|
| A | 6316 | 26 | 0.411653% |
| B | 6316 | 89 | 1.409120% |
| C | 6316 | 358 | 5.668144% |
| D | 6316 | 38 | 0.601647% |
Noise dominated data is calculated using 1-second bins in cleaned event files. If a bin has >2000 counts, and if more than 50% of those come from <1% of pixels, then it is considered to be noise-dominated and hence unusable.
| Quadrant | # 1 sec bins | Bins with >0 counts | Bins with >2000 counts | High rate bins dominated by noise | Noise dominated (total time) | Noise dominated (detector-on time) | Marked lightcurve |
|---|---|---|---|---|---|---|---|
| A | 7571 | 6317 | 0 | 0 | 0.00% | 0.00% | 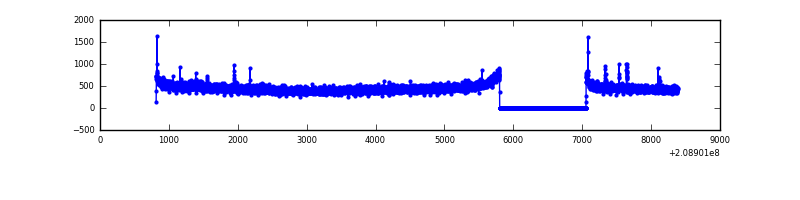 |
| B | 7571 | 6317 | 35 | 35 | 0.46% | 0.55% | 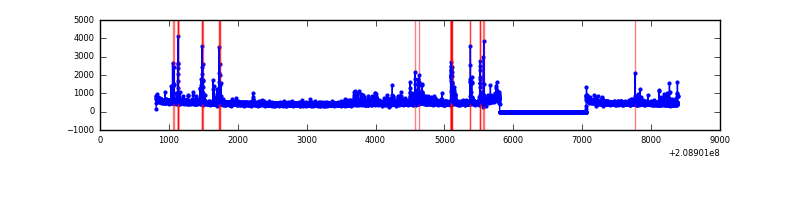 |
| C | 7571 | 6317 | 304 | 304 | 4.02% | 4.81% | 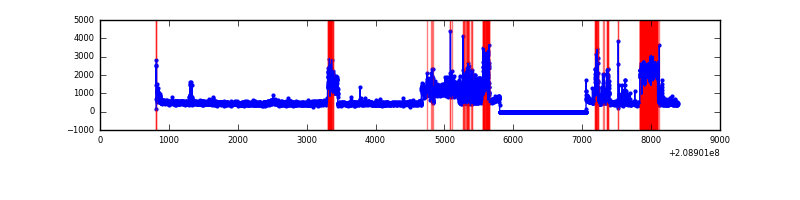 |
| D | 7571 | 6317 | 21 | 21 | 0.28% | 0.33% | 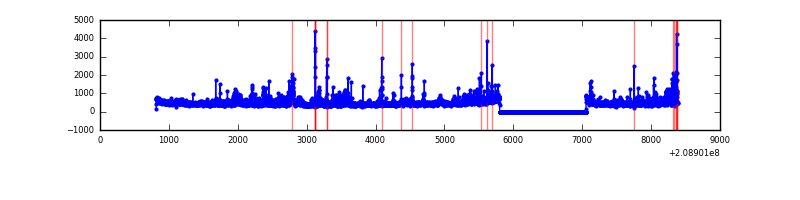 |
Top three noisy pixels from each quadrant. If the there are fewer than three noisy pixels in the level2.evt file, extra rows are filled as -1
| Pixel properties | Quadrant properties | ||||||
|---|---|---|---|---|---|---|---|
| Quadrant | DetID | PixID | Counts | Sigma | Mean | Median | Sigma |
| A | 0 | 50 | 11784 | 74.47 | 733 | 716 | 148.6 |
| A | 15 | 174 | 9392 | 58.38 | 733 | 716 | 148.6 |
| A | 0 | 226 | 7595 | 46.29 | 733 | 716 | 148.6 |
| B | 10 | 16 | 205532 | 1448.49 | 742 | 724 | 141.4 |
| B | 14 | 167 | 176751 | 1244.94 | 742 | 724 | 141.4 |
| B | 4 | 80 | 22749 | 155.77 | 742 | 724 | 141.4 |
| C | 14 | 48 | 1788381 | 11051.19 | 703 | 707 | 161.8 |
| C | 1 | 16 | 29446 | 177.66 | 703 | 707 | 161.8 |
| C | 12 | 4 | 13094 | 76.57 | 703 | 707 | 161.8 |
| D | 13 | 235 | 319751 | 1880.45 | 707 | 685 | 169.7 |
| D | 2 | 136 | 167846 | 985.18 | 707 | 685 | 169.7 |
| D | 2 | 234 | 42696 | 247.6 | 707 | 685 | 169.7 |
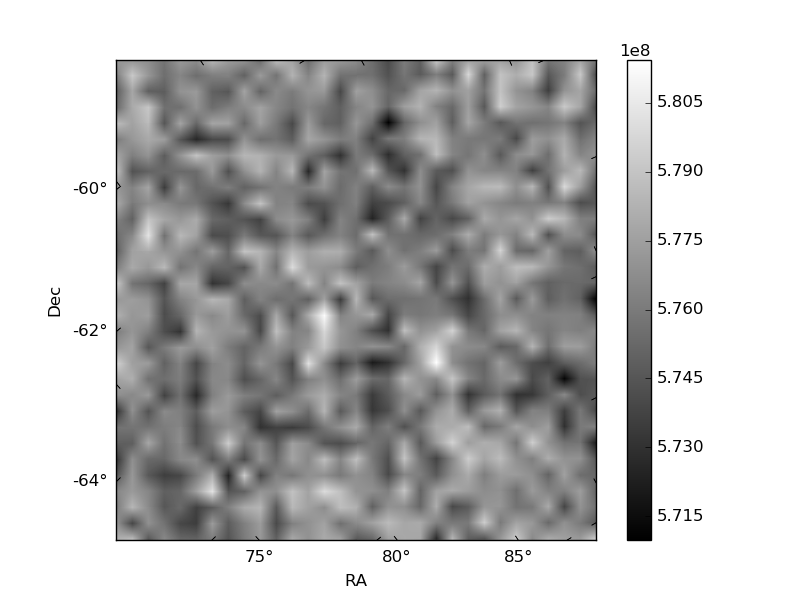
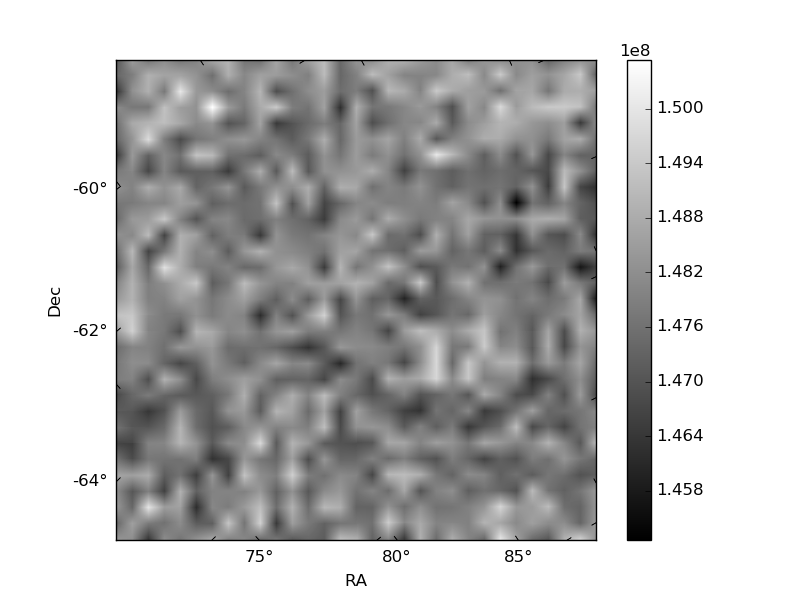
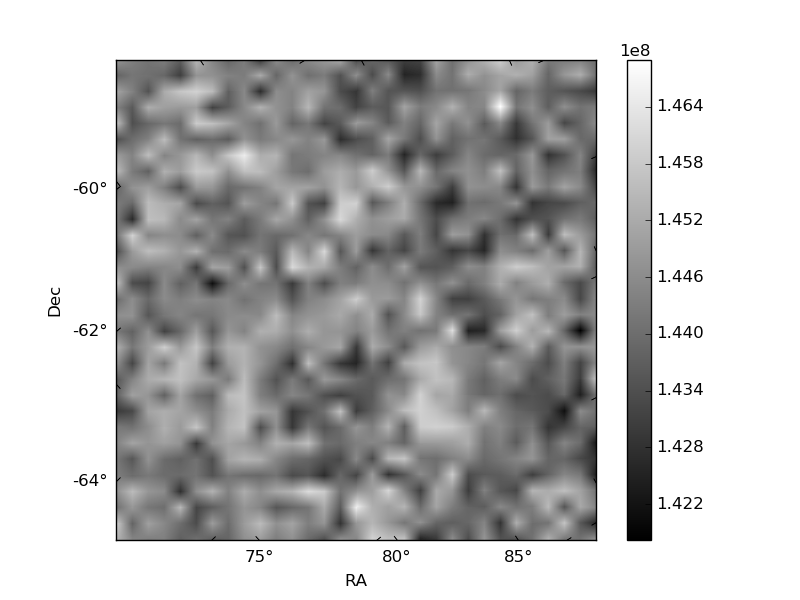
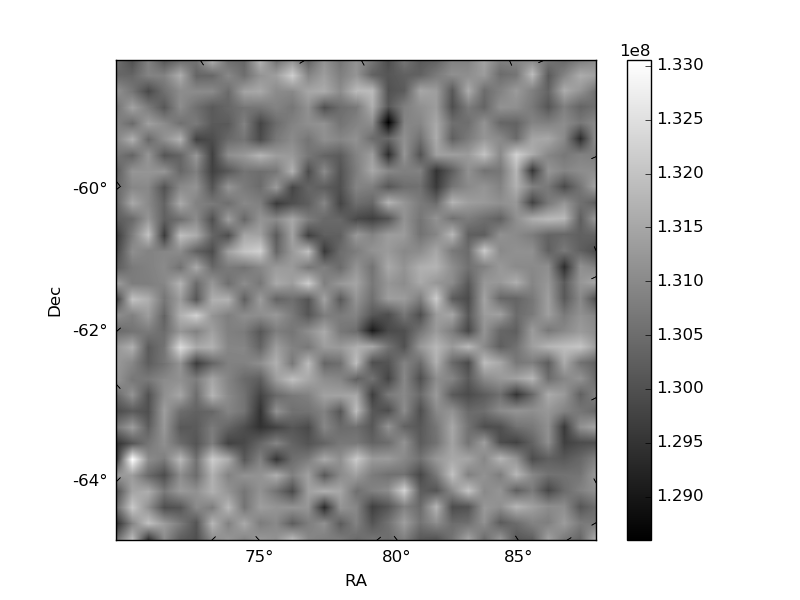
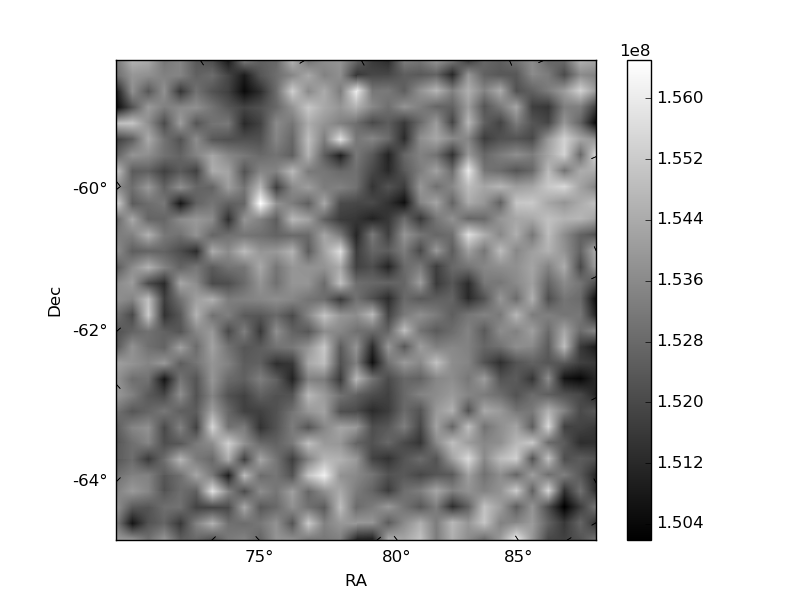
Histogram calculated using DETX and DETY for each event in the final _common_clean file
| Quadrant A | 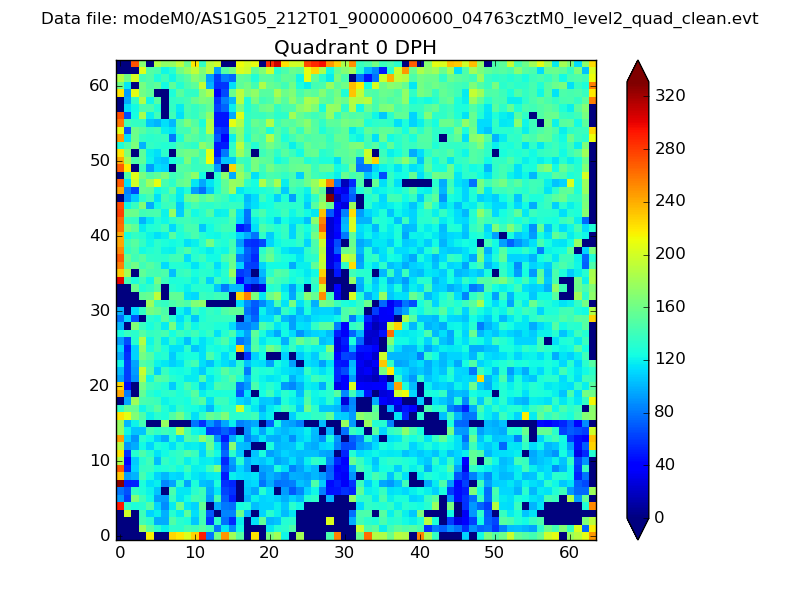 |
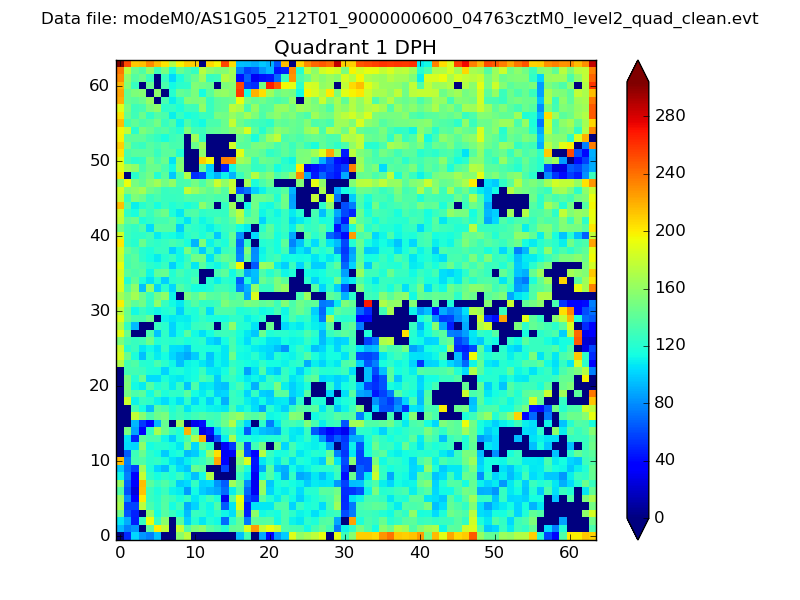 |
Quadrant B |
|---|---|---|---|
| Quadrant D | 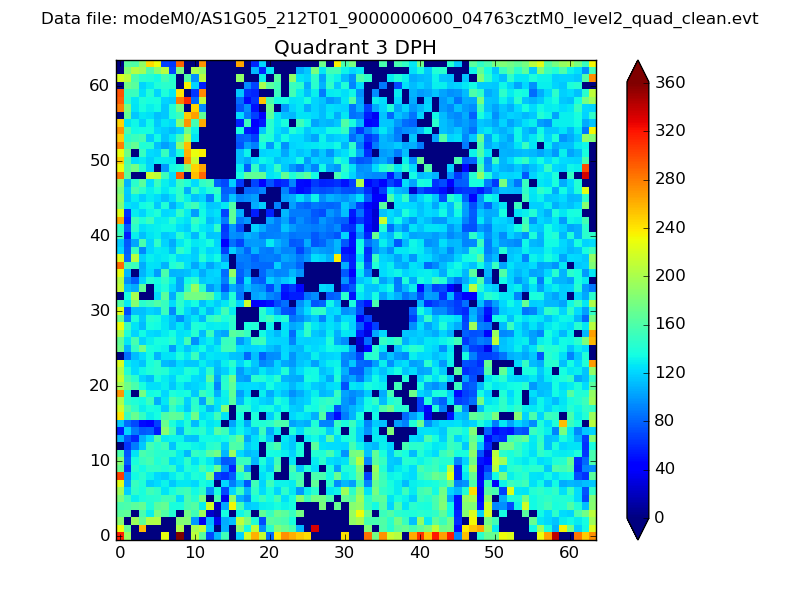 |
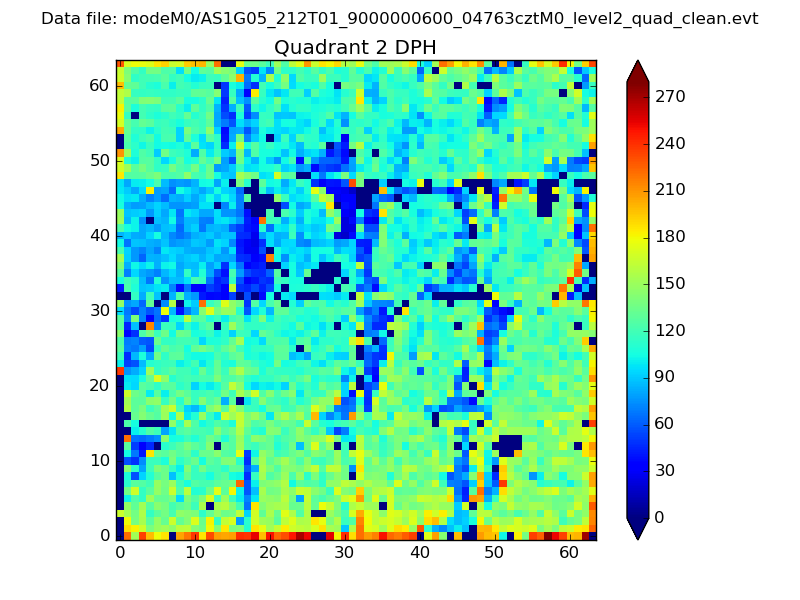 |
Quadrant C |
| Plot type | Count rate plots | Images |
|---|---|---|
| Comparison with Poisson distribution Blue bars denote a histogram of data divided into 1 sec bins. Red curve is a Poisson curve with rate = median count rate of data. |
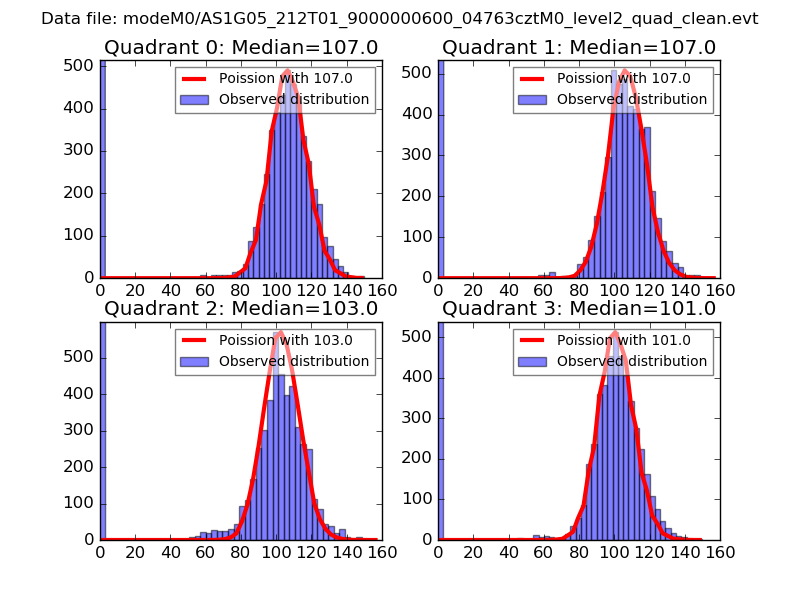 |
 |
| Quadrant-wise count rates Data is divided into 100 sec bins |
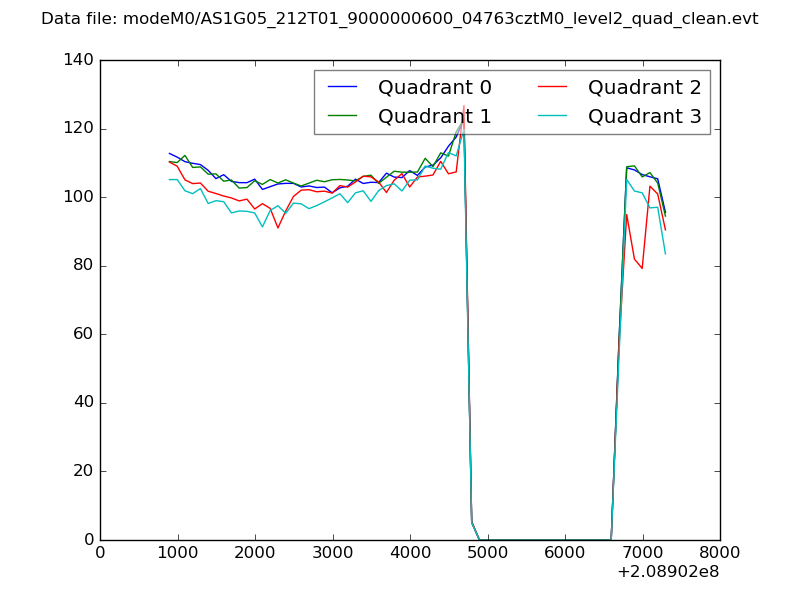 |
|
| Module-wise count rates for Quadrant A Data is divided into 100 sec bins |
 |
 |
| Module-wise count rates for Quadrant B Data is divided into 100 sec bins |
 |
 |
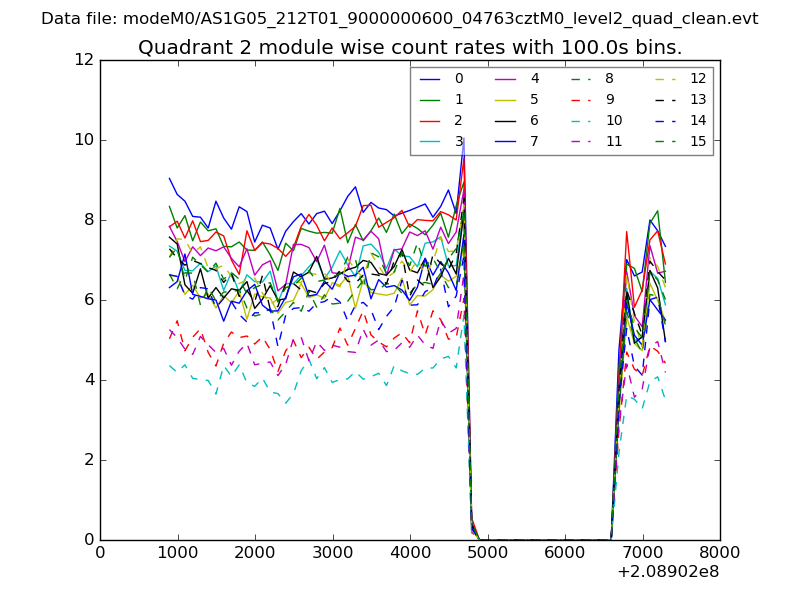
| Module-wise count rates for Quadrant C Data is divided into 100 sec bins |
 |
 |
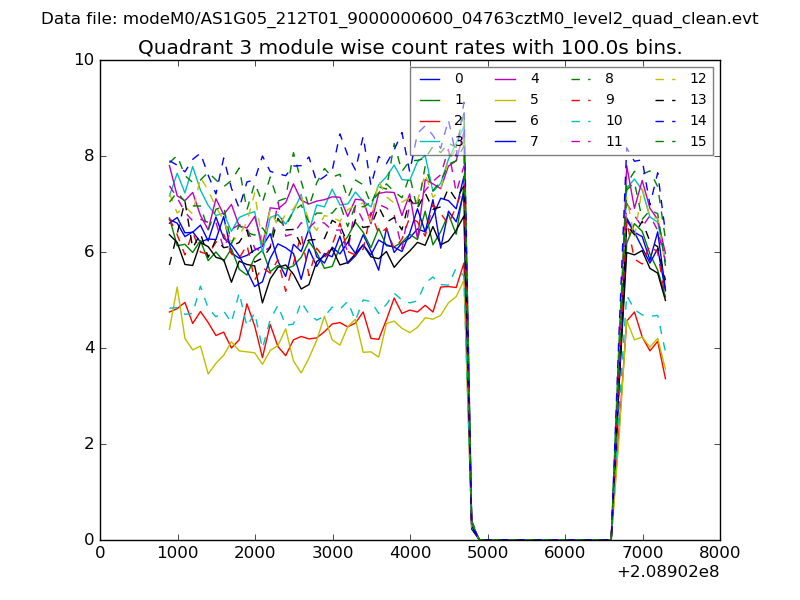
| Module-wise count rates for Quadrant D Data is divided into 100 sec bins |
 |
 |
| Parameter | Plot |
|---|---|
| CZT HV Monitor | 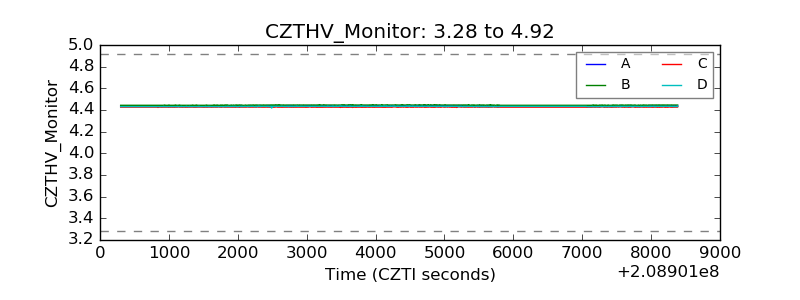 |
| D_VDD | 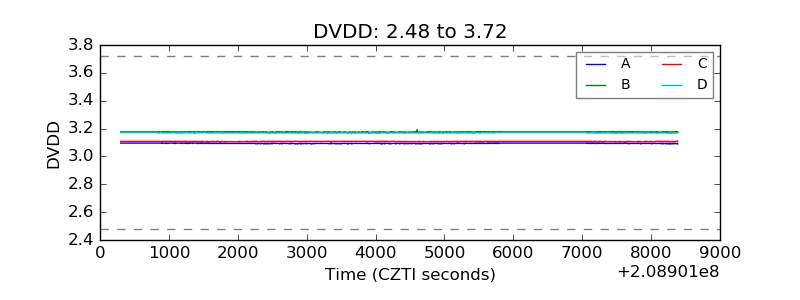 |
| Temperature 1 | 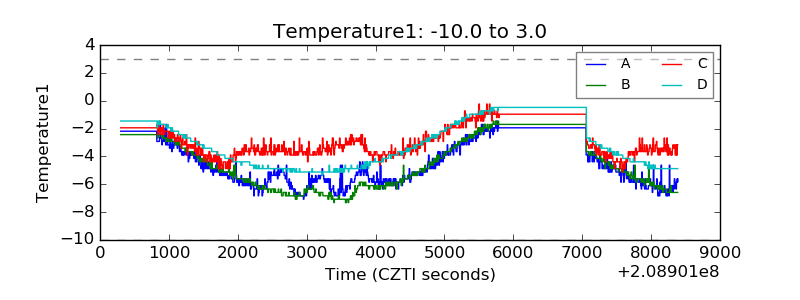 |
| Veto HV Monitor | 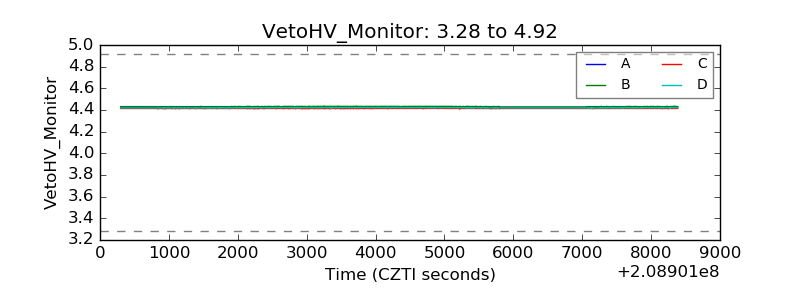 |
| Veto LLD | 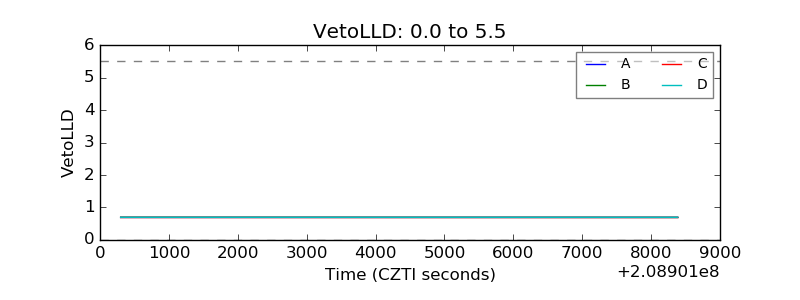 |
| Alpha Counter | 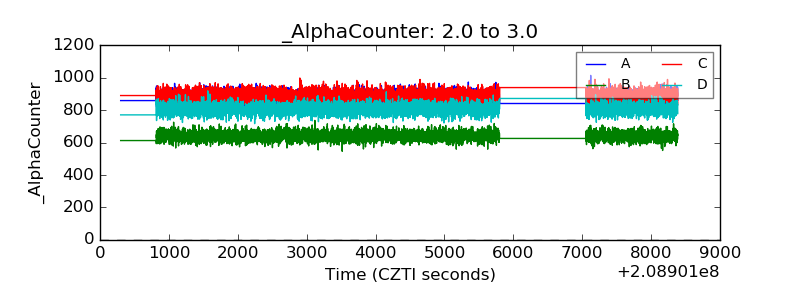 |
| _CPM_Rate | 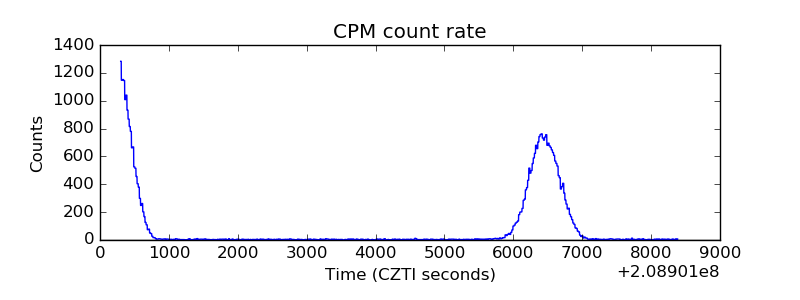 |
| CZT Counter | 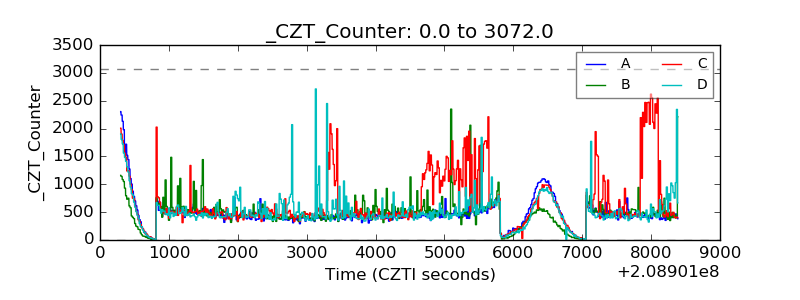 |
| +2.5 Volts monitor |  |
| +5 Volts monitor |  |
| _ROLL_ROT | 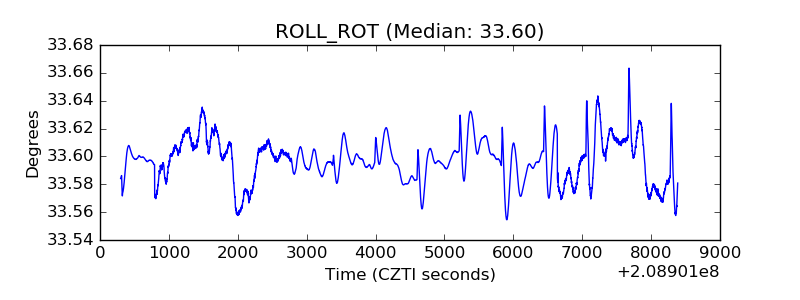 |
| _Roll_DEC | 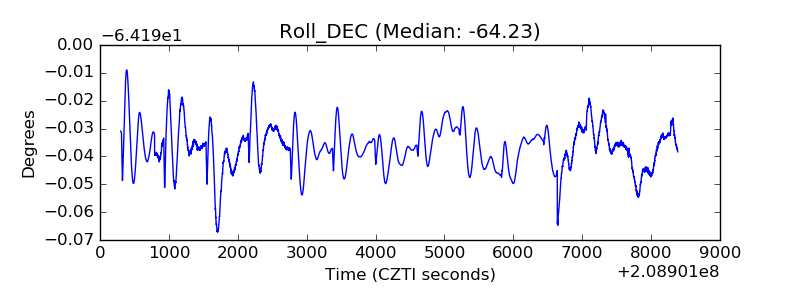 |
| _Roll_RA | 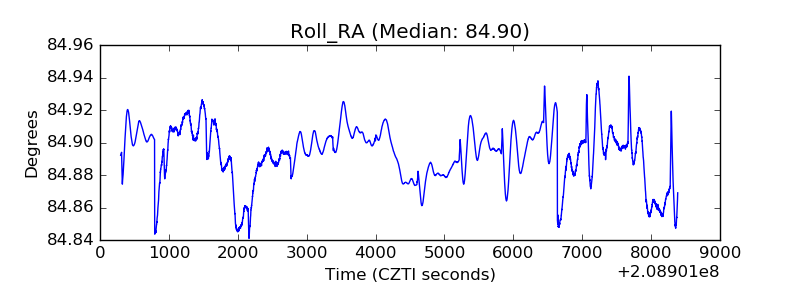 |
| Veto Counter | 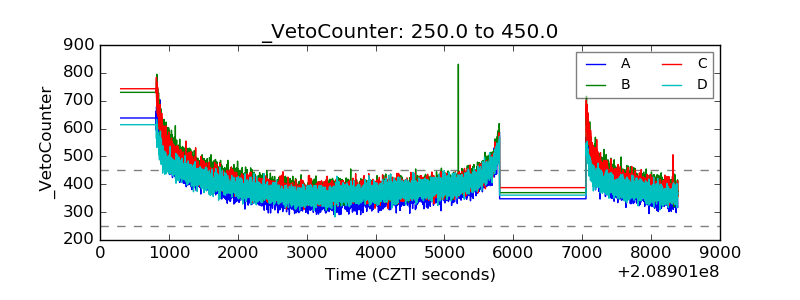 |