| Param | Original file | Final file |
|---|---|---|
| Filename | modeM0/AS1G05_212T01_9000000600_04766cztM0_level2.evt | modeM0/AS1G05_212T01_9000000600_04766cztM0_level2_quad_clean.evt |
| Size (bytes) | 569,672,640 | 97,384,320 |
| Size | 543.3 MB | 92.9 MB |
| Events in quadrant A | 3,422,689 | 613,895 |
| Events in quadrant B | 3,970,253 | 616,607 |
| Events in quadrant C | 4,756,336 | 602,402 |
| Events in quadrant D | 4,587,384 | 587,008 |
| Mode M0 | |||
|---|---|---|---|
| Quadrant | BADHDUFLAG | Total packets | Discarded packets |
| A | 0 | 15656 | 8 |
| B | 0 | 16952 | 6 |
| C | 0 | 19362 | 5 |
| D | 0 | 19218 | 16 |
| Mode M9 | |||
|---|---|---|---|
| Quadrant | BADHDUFLAG | Total packets | Discarded packets |
| A | 0 | 6 | 0 |
| B | 0 | 6 | 0 |
| C | 0 | 6 | 0 |
| D | 0 | 7 | 0 |
| Mode SS | |||
|---|---|---|---|
| Quadrant | BADHDUFLAG | Total packets | Discarded packets |
| A | 0 | 154 | 0 |
| B | 0 | 154 | 0 |
| C | 0 | 154 | 0 |
| D | 0 | 154 | 0 |
| Quadrant | Total seconds | Saturated seconds | Saturation percentage |
|---|---|---|---|
| A | 7606 | 69 | 0.907179% |
| B | 7607 | 117 | 1.538057% |
| C | 7607 | 351 | 4.614171% |
| D | 7603 | 127 | 1.670393% |
Noise dominated data is calculated using 1-second bins in cleaned event files. If a bin has >2000 counts, and if more than 50% of those come from <1% of pixels, then it is considered to be noise-dominated and hence unusable.
| Quadrant | # 1 sec bins | Bins with >0 counts | Bins with >2000 counts | High rate bins dominated by noise | Noise dominated (total time) | Noise dominated (detector-on time) | Marked lightcurve |
|---|---|---|---|---|---|---|---|
| A | 7888 | 7610 | 2 | 2 | 0.03% | 0.03% | 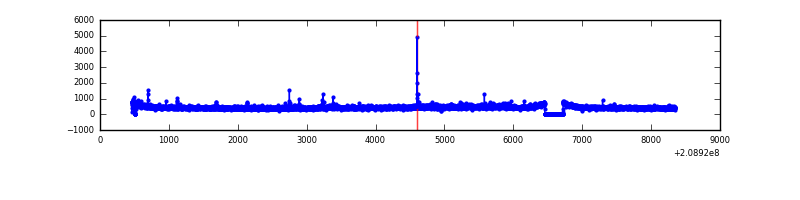 |
| B | 7888 | 7610 | 31 | 31 | 0.39% | 0.41% | 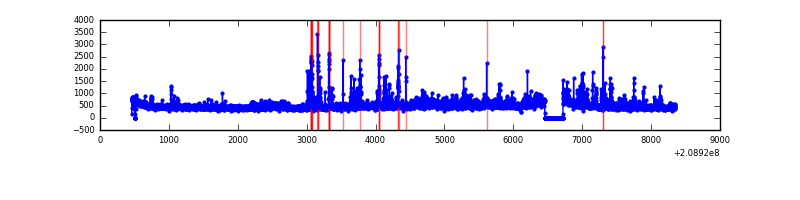 |
| C | 7888 | 7610 | 253 | 253 | 3.21% | 3.32% | 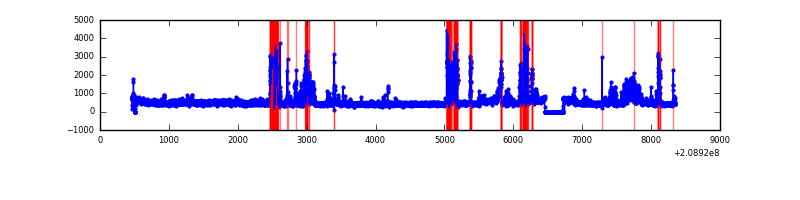 |
| D | 7888 | 7610 | 61 | 61 | 0.77% | 0.80% | 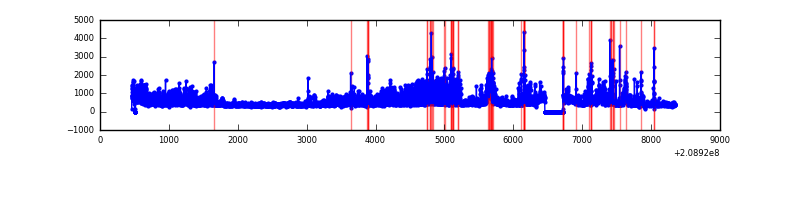 |
Top three noisy pixels from each quadrant. If the there are fewer than three noisy pixels in the level2.evt file, extra rows are filled as -1
| Pixel properties | Quadrant properties | ||||||
|---|---|---|---|---|---|---|---|
| Quadrant | DetID | PixID | Counts | Sigma | Mean | Median | Sigma |
| A | 8 | 15 | 84642 | 481.45 | 851 | 830 | 174.1 |
| A | 15 | 174 | 17449 | 95.47 | 851 | 830 | 174.1 |
| A | 3 | 1 | 17338 | 94.83 | 851 | 830 | 174.1 |
| B | 14 | 167 | 306161 | 1849.61 | 864 | 839 | 165.1 |
| B | 15 | 204 | 186922 | 1127.27 | 864 | 839 | 165.1 |
| B | 4 | 80 | 118608 | 713.43 | 864 | 839 | 165.1 |
| C | 14 | 48 | 1527971 | 7980.81 | 823 | 824 | 191.4 |
| C | 1 | 16 | 12180 | 59.35 | 823 | 824 | 191.4 |
| C | 13 | 61 | 6634 | 30.36 | 823 | 824 | 191.4 |
| D | 11 | 132 | 735672 | 3720.8 | 825 | 799 | 197.5 |
| D | 13 | 235 | 263590 | 1330.56 | 825 | 799 | 197.5 |
| D | 2 | 136 | 196309 | 989.91 | 825 | 799 | 197.5 |
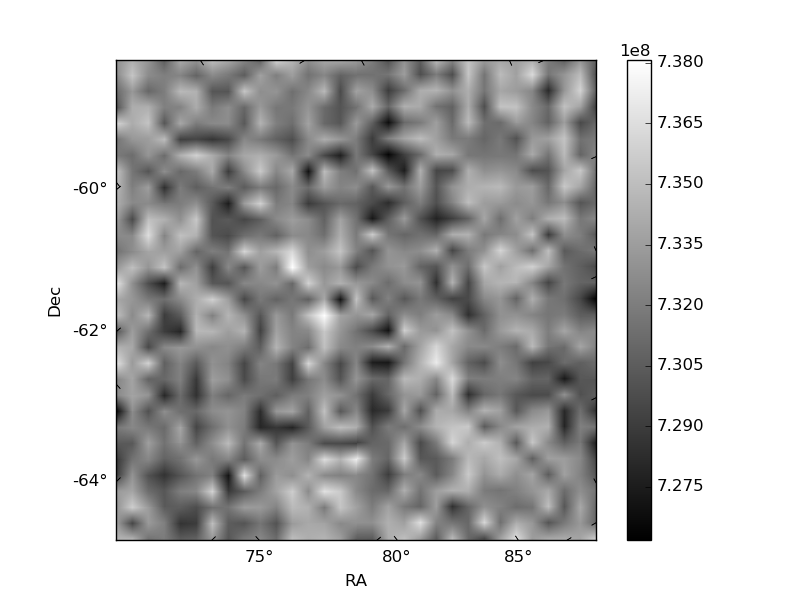
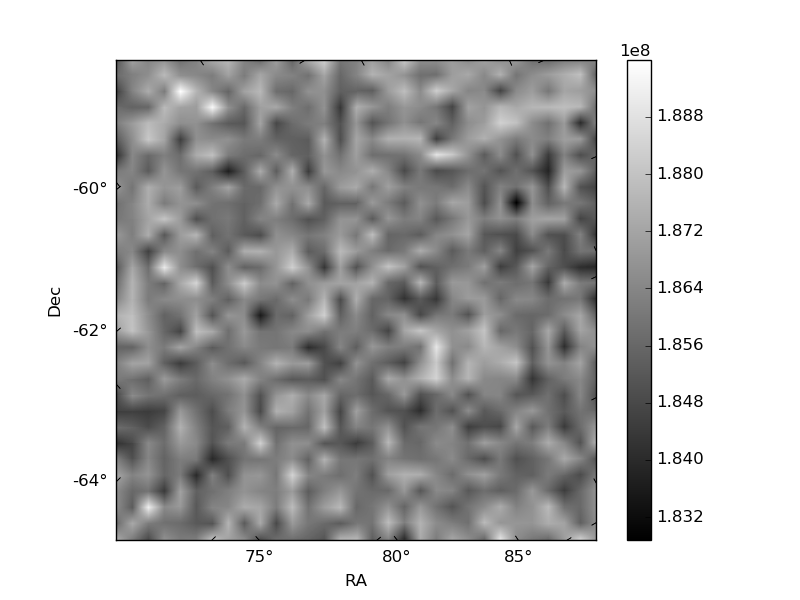
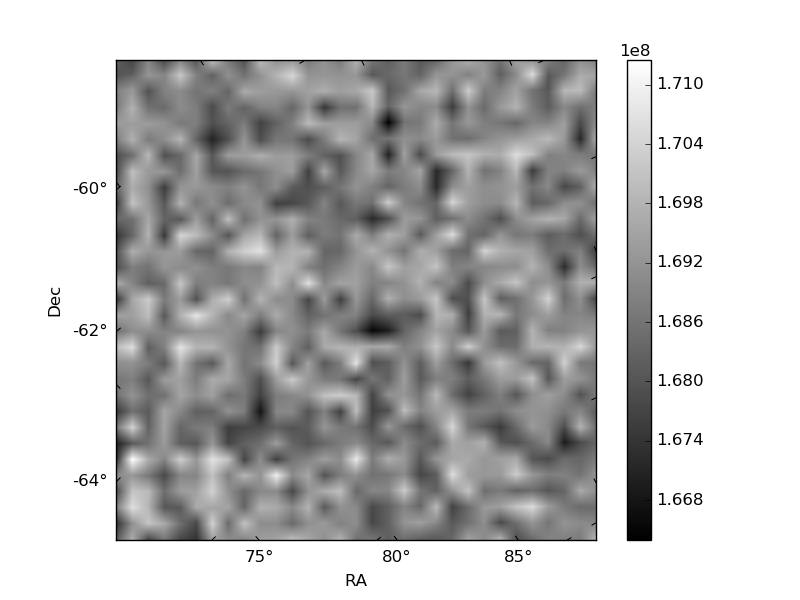
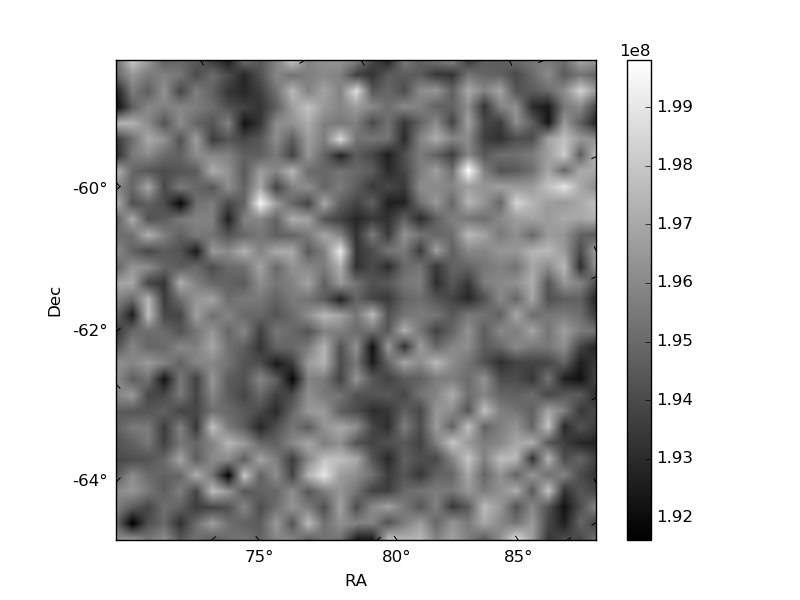
Histogram calculated using DETX and DETY for each event in the final _common_clean file
| Quadrant A | 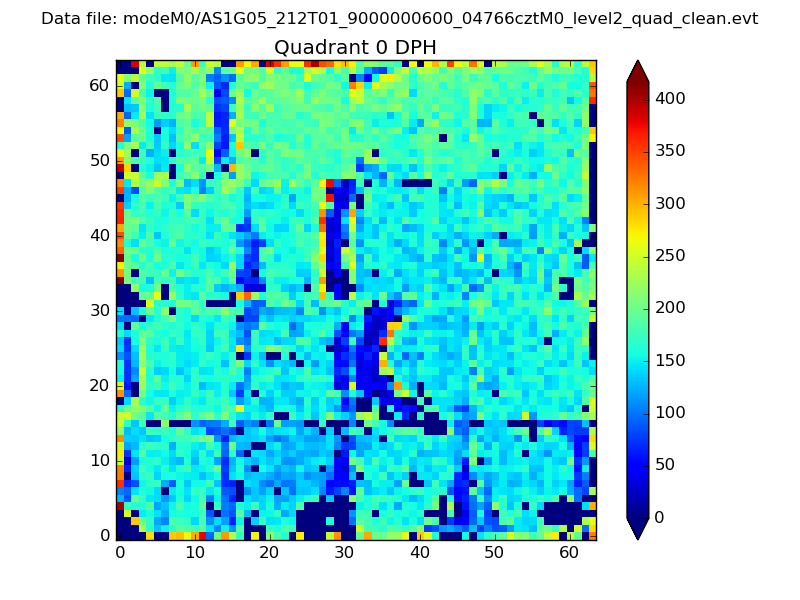 |
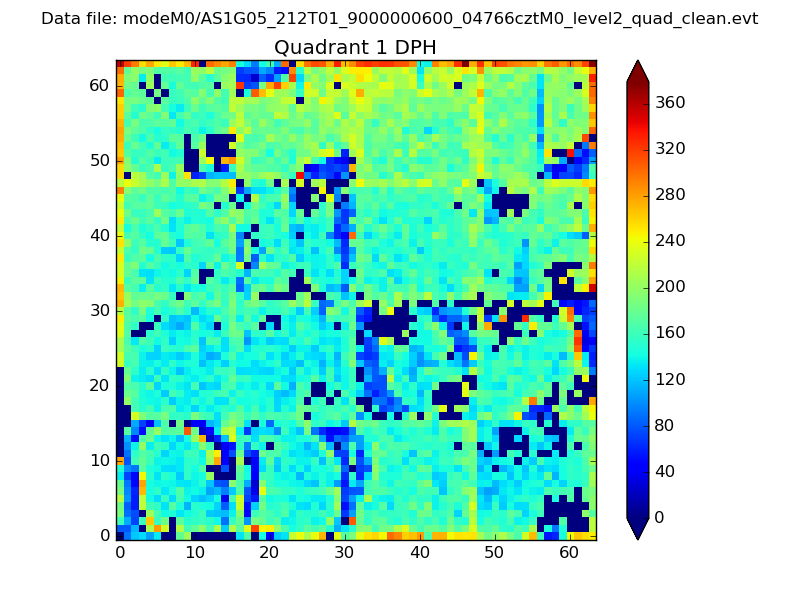 |
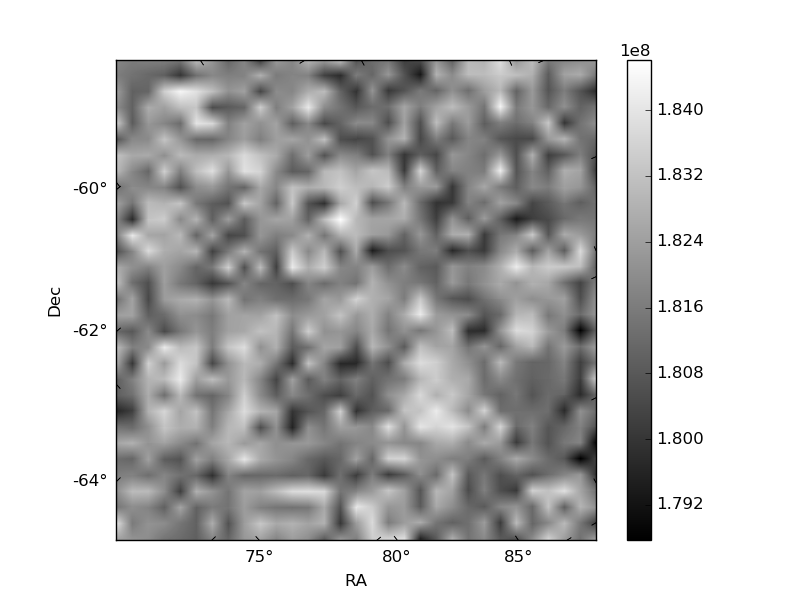
Quadrant B |
|---|---|---|---|
| Quadrant D | 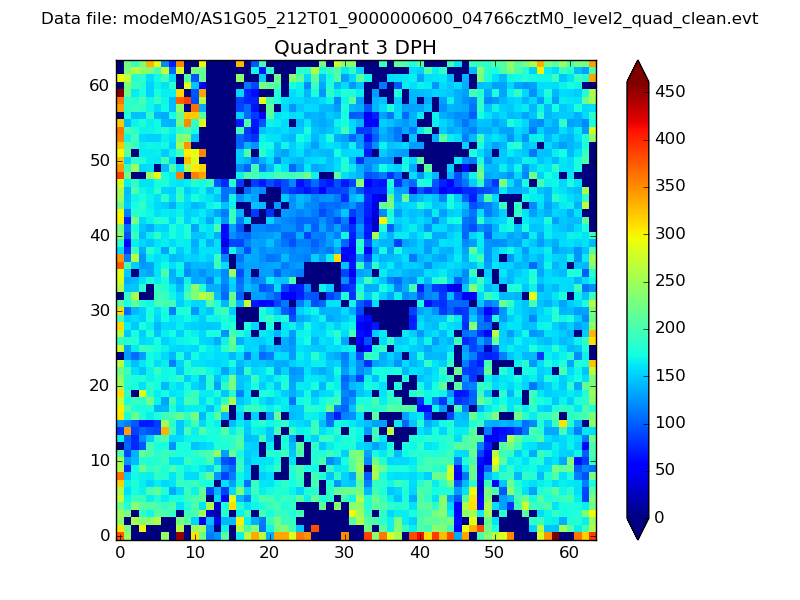 |
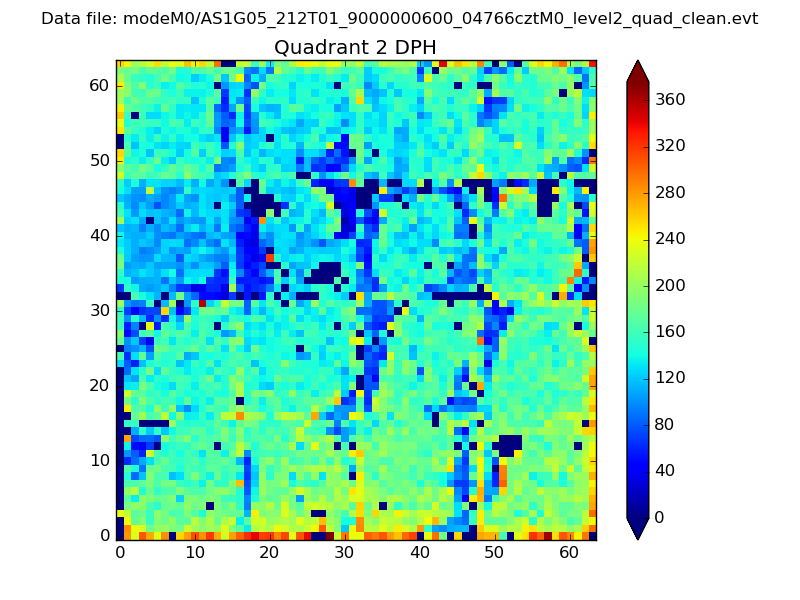 |
Quadrant C |
| Plot type | Count rate plots | Images |
|---|---|---|
| Comparison with Poisson distribution Blue bars denote a histogram of data divided into 1 sec bins. Red curve is a Poisson curve with rate = median count rate of data. |
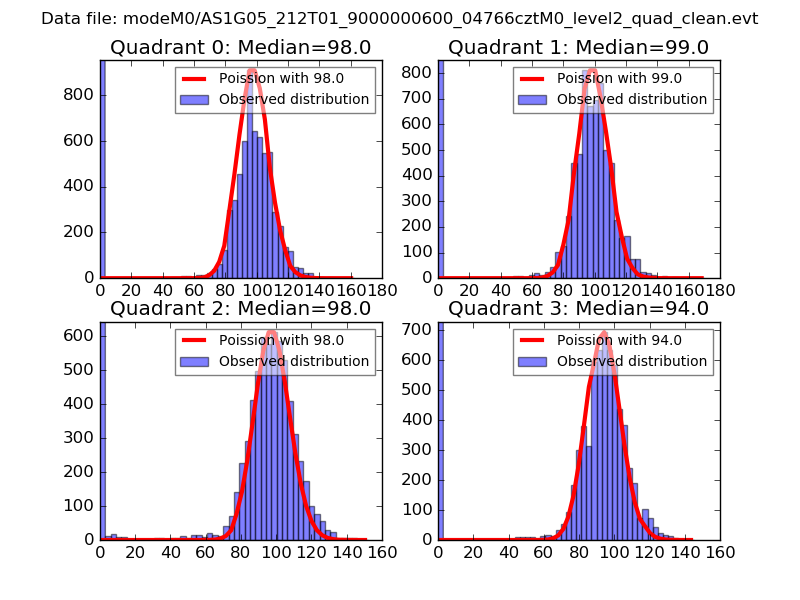 |
 |
| Quadrant-wise count rates Data is divided into 100 sec bins |
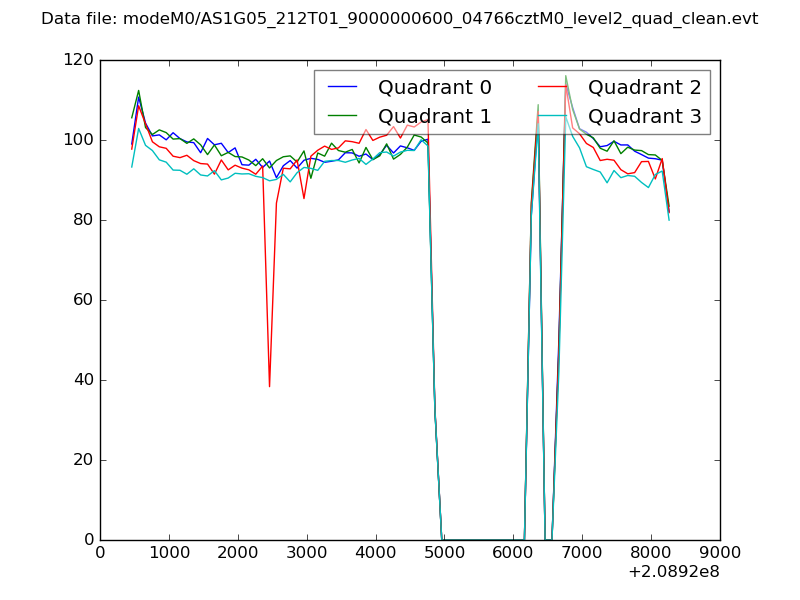 |
|
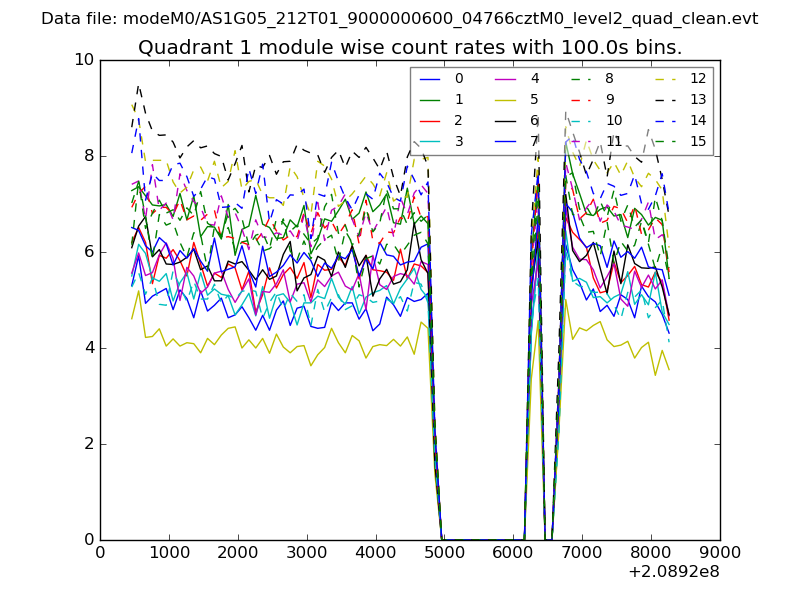
| Module-wise count rates for Quadrant A Data is divided into 100 sec bins |
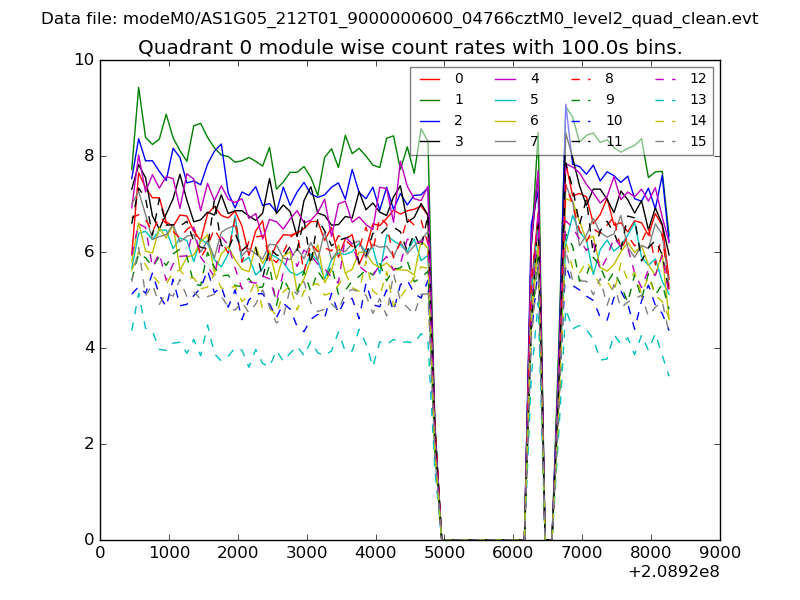 |
 |
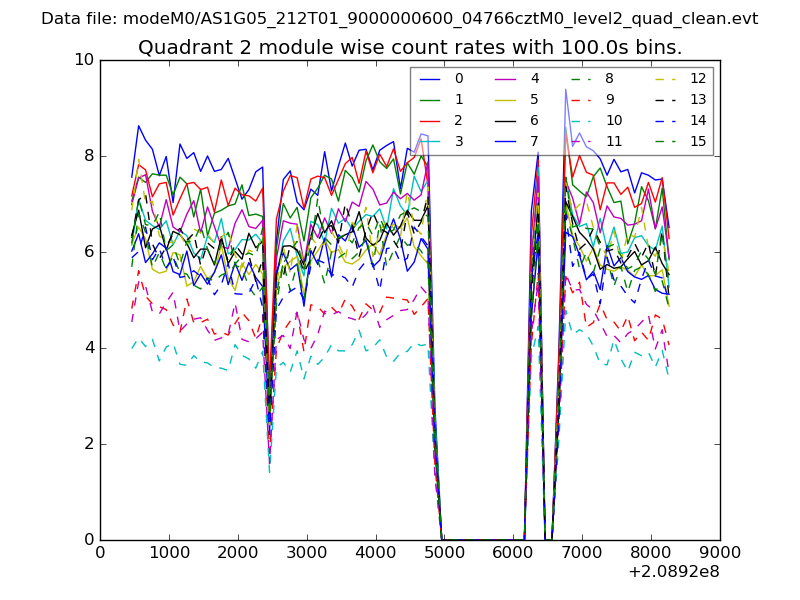
| Module-wise count rates for Quadrant B Data is divided into 100 sec bins |
 |
 |
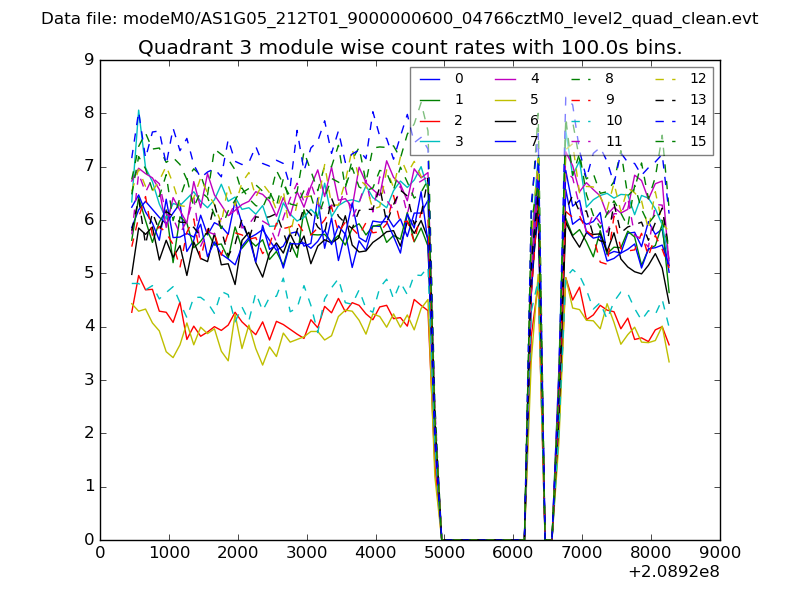
| Module-wise count rates for Quadrant C Data is divided into 100 sec bins |
 |
 |
| Module-wise count rates for Quadrant D Data is divided into 100 sec bins |
 |
 |
| Parameter | Plot |
|---|---|
| CZT HV Monitor | 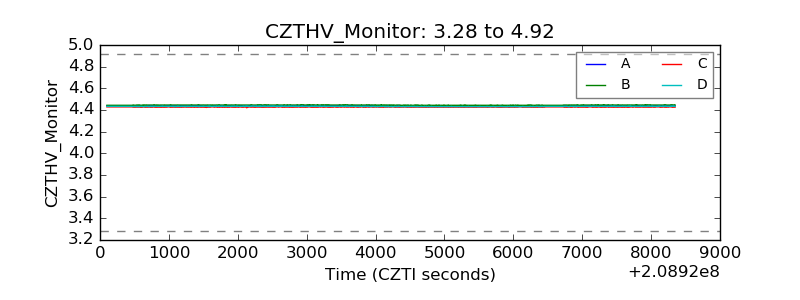 |
| D_VDD | 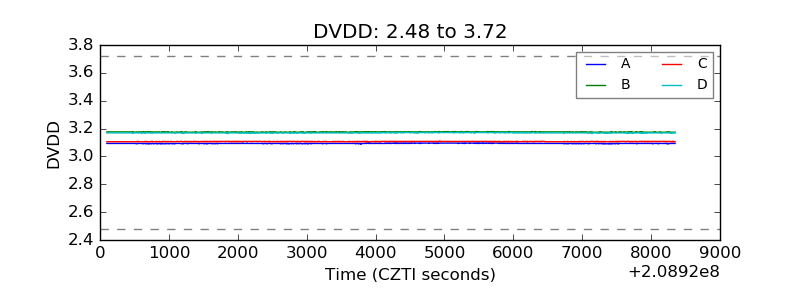 |
| Temperature 1 | 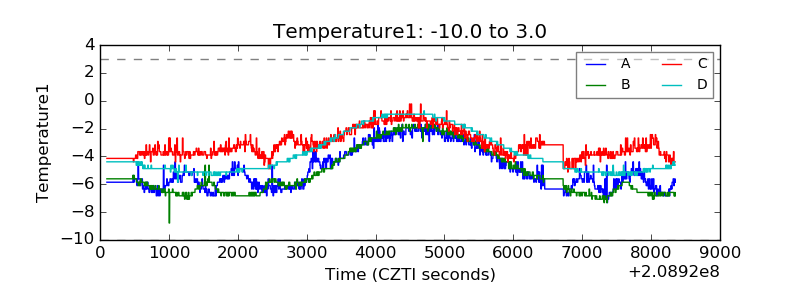 |
| Veto HV Monitor | 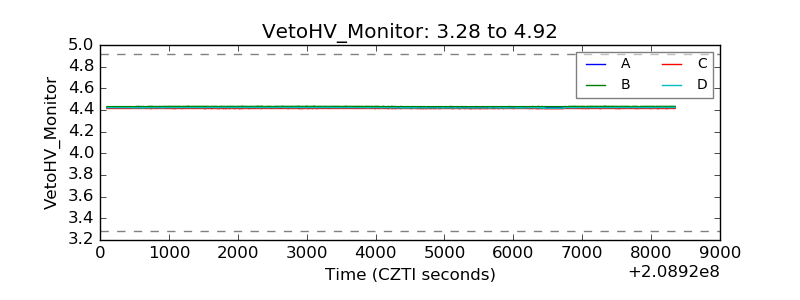 |
| Veto LLD | 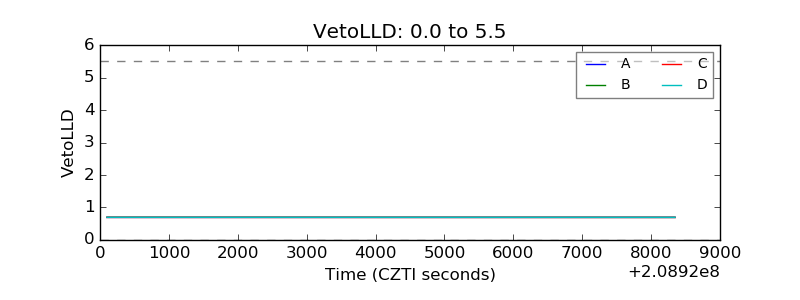 |
| Alpha Counter | 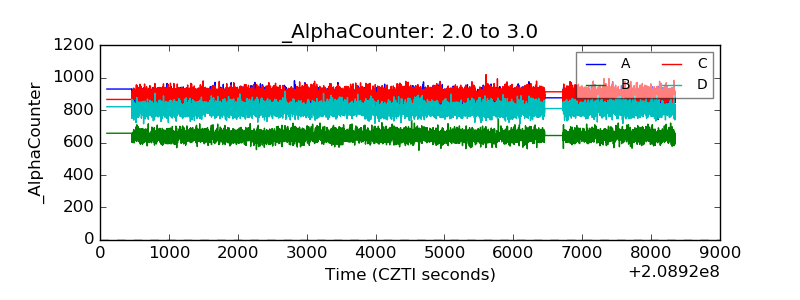 |
| _CPM_Rate | 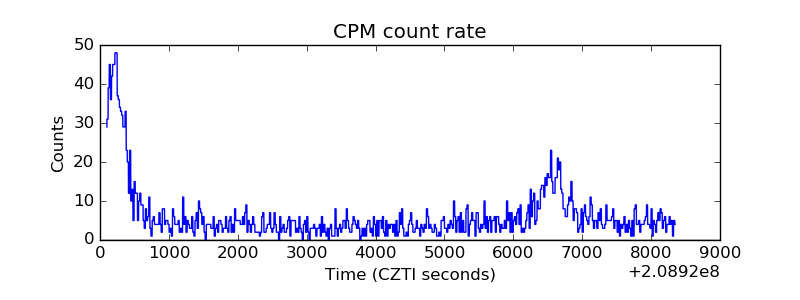 |
| CZT Counter | 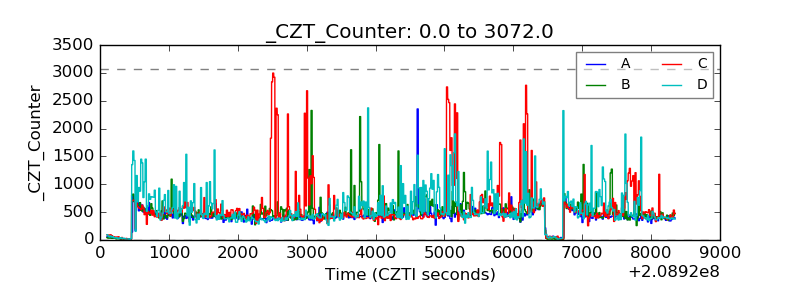 |
| +2.5 Volts monitor |  |
| +5 Volts monitor |  |
| _ROLL_ROT | 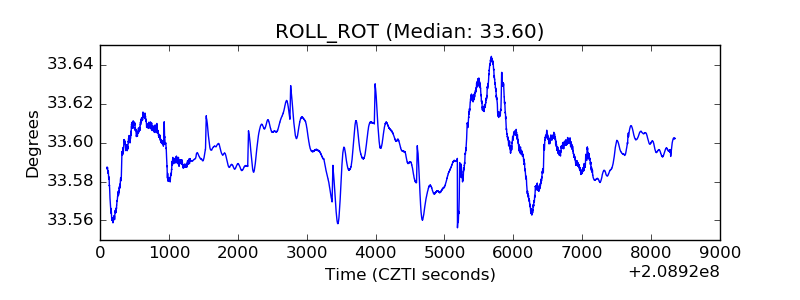 |
| _Roll_DEC | 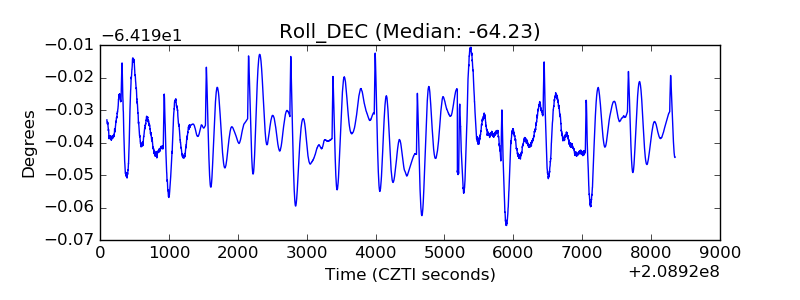 |
| _Roll_RA | 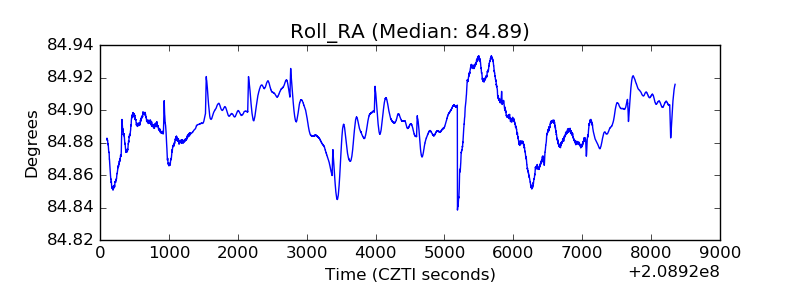 |
| Veto Counter | 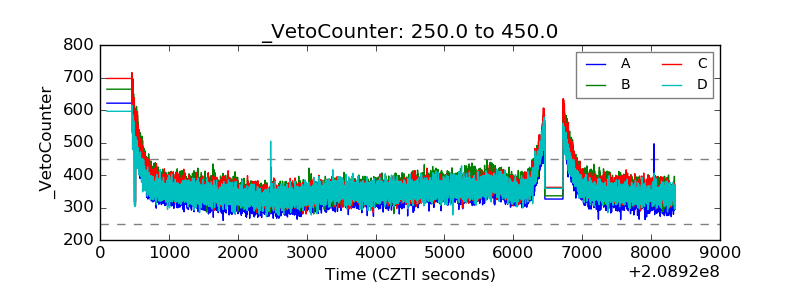 |