| Param | Original file | Final file |
|---|---|---|
| Filename | modeM0/AS1G05_218T05_9000000602cztM0_level2.fits | modeM0/AS1G05_218T05_9000000602cztM0_level2_quad_clean.evt |
| Size (bytes) | 488,485,440 | 443,335,680 |
| Size | 465.9 MB | 422.8 MB |
| Events in quadrant A | 2,960,196 | 2,565,928 |
| Events in quadrant B | 2,886,374 | 2,640,604 |
| Events in quadrant C | 2,708,784 | 2,193,306 |
| Events in quadrant D | 2,460,612 | 2,252,663 |
| Mode M9 | |||
|---|---|---|---|
| Quadrant | BADHDUFLAG | Total packets | Discarded packets |
| A | 0 | 88 | 0 |
| B | 0 | 88 | 0 |
| C | 0 | 88 | 0 |
| D | 0 | 88 | 0 |
| Mode SS | |||
|---|---|---|---|
| Quadrant | BADHDUFLAG | Total packets | Discarded packets |
| A | 0 | 1120 | 0 |
| B | 0 | 1120 | 0 |
| C | 0 | 1120 | 0 |
| D | 0 | 1120 | 0 |
| Mode M0 | |||
|---|---|---|---|
| Quadrant | BADHDUFLAG | Total packets | Discarded packets |
| A | 0 | 116979 | 0 |
| B | 0 | 117755 | 0 |
| C | 0 | 187735 | 0 |
| D | 0 | 171833 | 0 |
| Quadrant | Total seconds | Saturated seconds | Saturation percentage |
|---|---|---|---|
| A | 54975 | 1738 | 3.161437% |
| B | 54975 | 500 | 0.909504% |
| C | 54974 | 8702 | 15.829301% |
| D | 54973 | 2848 | 5.180725% |
Noise dominated data is calculated using 1-second bins in cleaned event files. If a bin has >2000 counts, and if more than 50% of those come from <1% of pixels, then it is considered to be noise-dominated and hence unusable.
| Quadrant | # 1 sec bins | Bins with >0 counts | Bins with >2000 counts | High rate bins dominated by noise | Noise dominated (total time) | Noise dominated (detector-on time) | Marked lightcurve |
|---|---|---|---|---|---|---|---|
| A | 78490 | 54974 | 0 | 0 | 0.00% | 0.00% |  |
| B | 78490 | 54976 | 0 | 0 | 0.00% | 0.00% | 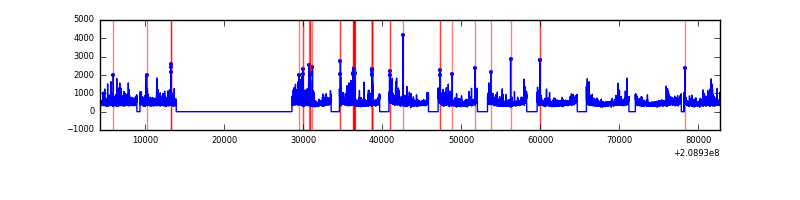 |
| C | 78490 | 54715 | 0 | 0 | 0.00% | 0.00% | 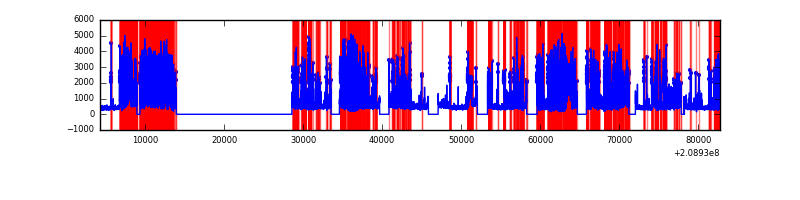 |
| D | 78490 | 54922 | 0 | 0 | 0.00% | 0.00% |  |
Top three noisy pixels from each quadrant. If the there are fewer than three noisy pixels in the level2.evt file, extra rows are filled as -1
| Pixel properties | Quadrant properties | ||||||
|---|---|---|---|---|---|---|---|
| Quadrant | DetID | PixID | Counts | Sigma | Mean | Median | Sigma |
| A | 0 | 29 | 2970 | 11.27 | 770 | 718 | 199.8 |
| A | 7 | 110 | 2576 | 9.3 | 770 | 718 | 199.8 |
| A | 9 | 19 | 2331 | 8.07 | 770 | 718 | 199.8 |
| B | 2 | 9 | 2511 | 11.76 | 760 | 723 | 152.1 |
| B | 12 | 226 | 2109 | 9.11 | 760 | 723 | 152.1 |
| B | 5 | 128 | 2050 | 8.73 | 760 | 723 | 152.1 |
| C | 1 | 81 | 2080 | 7.35 | 714 | 661 | 193.0 |
| C | 1 | 80 | 2057 | 7.23 | 714 | 661 | 193.0 |
| C | 2 | 191 | 1877 | 6.3 | 714 | 661 | 193.0 |
| D | 11 | 82 | 1984 | 7.14 | 702 | 637 | 188.7 |
| D | 4 | 160 | 1851 | 6.43 | 702 | 637 | 188.7 |
| D | 3 | 14 | 1844 | 6.4 | 702 | 637 | 188.7 |
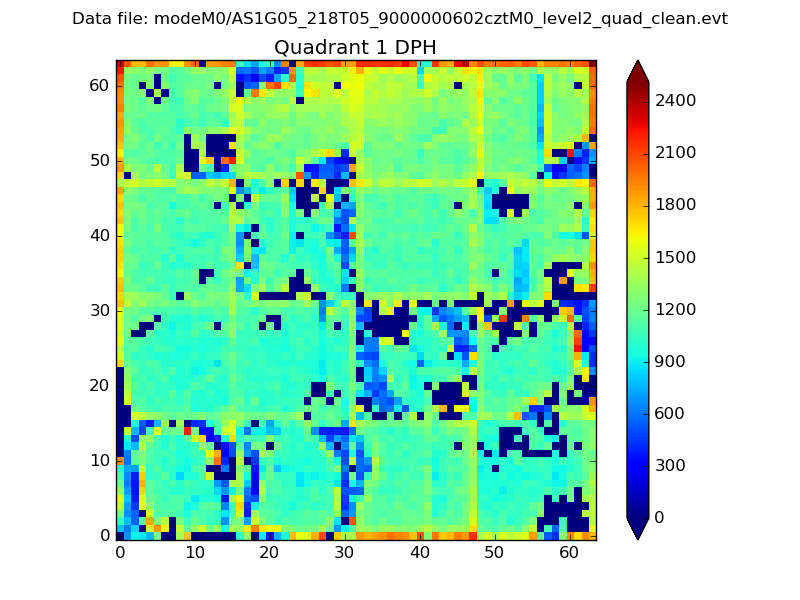
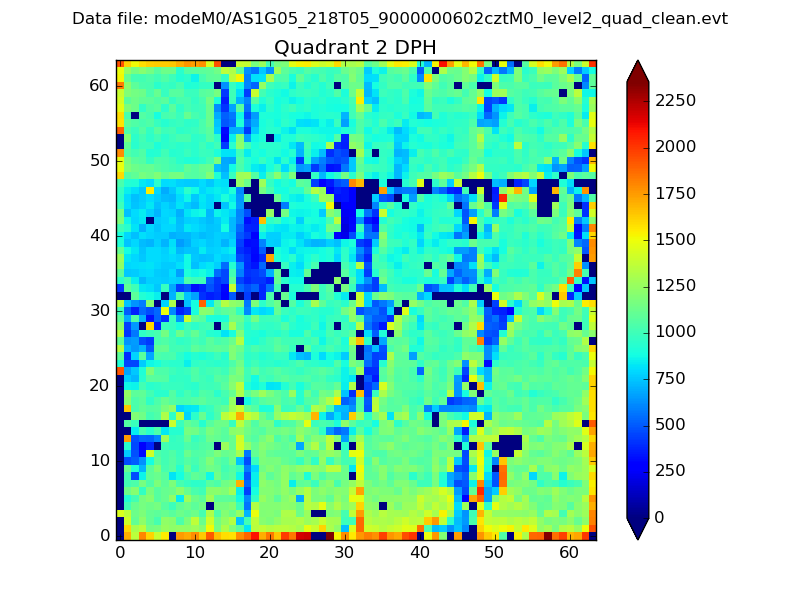
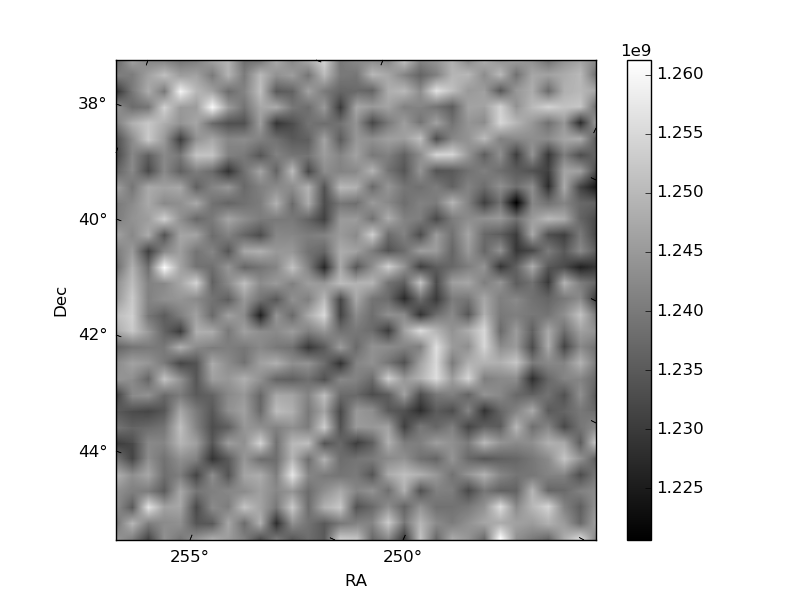
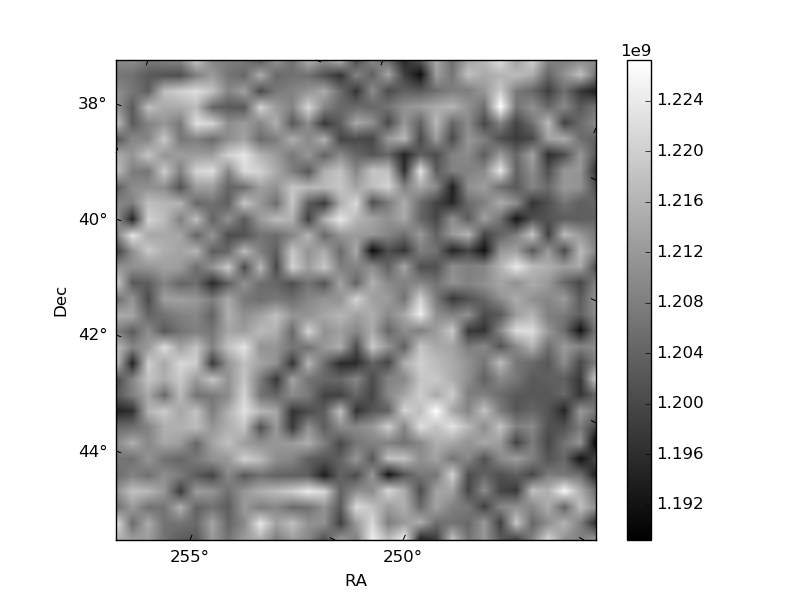
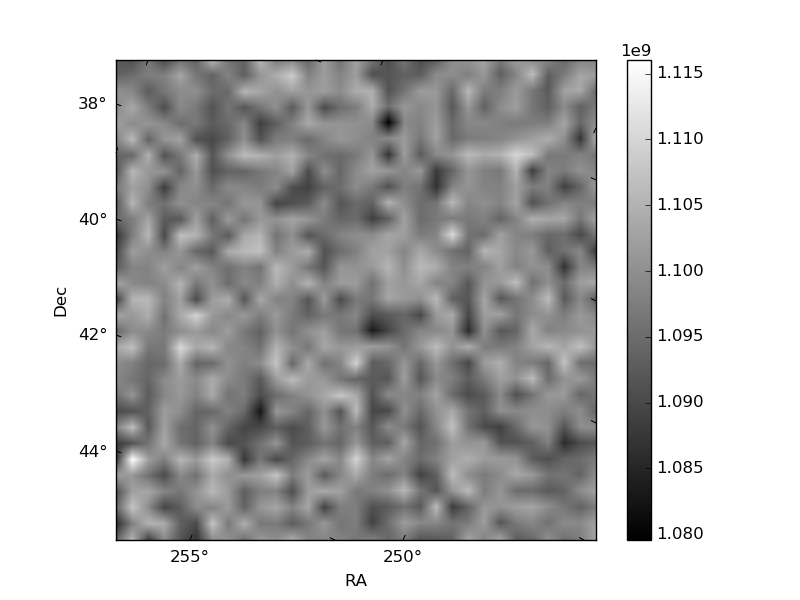
Histogram calculated using DETX and DETY for each event in the final _common_clean file
| Quadrant A |  |
 |
Quadrant B |
|---|---|---|---|
| Quadrant D |  |
 |
Quadrant C |
| Plot type | Count rate plots | Images |
|---|---|---|
| Comparison with Poisson distribution Blue bars denote a histogram of data divided into 1 sec bins. Red curve is a Poisson curve with rate = median count rate of data. |
 |
 |
| Quadrant-wise count rates Data is divided into 100 sec bins |
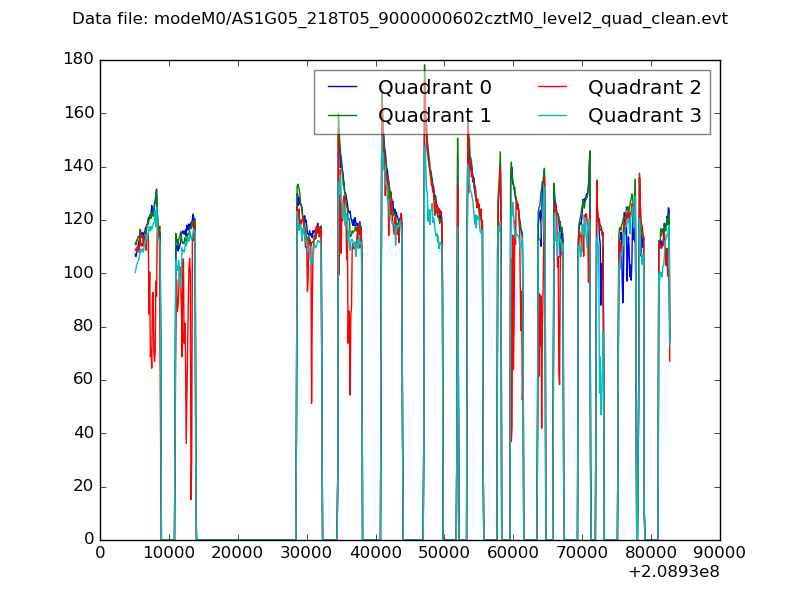 |
|
| Module-wise count rates for Quadrant A Data is divided into 100 sec bins |
 |
 |
| Module-wise count rates for Quadrant B Data is divided into 100 sec bins |
 |
 |
| Module-wise count rates for Quadrant C Data is divided into 100 sec bins |
 |
 |
| Module-wise count rates for Quadrant D Data is divided into 100 sec bins |
 |
 |
| Parameter | Plot |
|---|---|
| CZT HV Monitor |  |
| D_VDD | 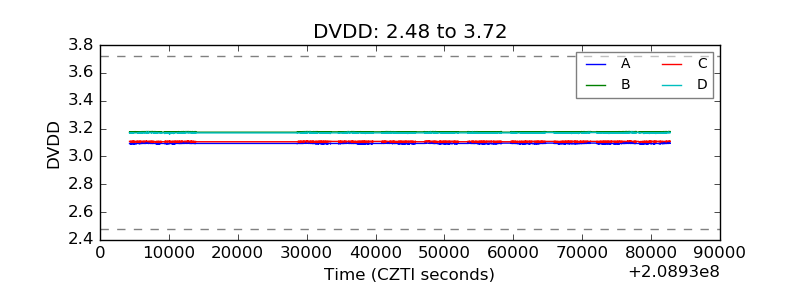 |
| Temperature 1 |  |
| Veto HV Monitor |  |
| Veto LLD | 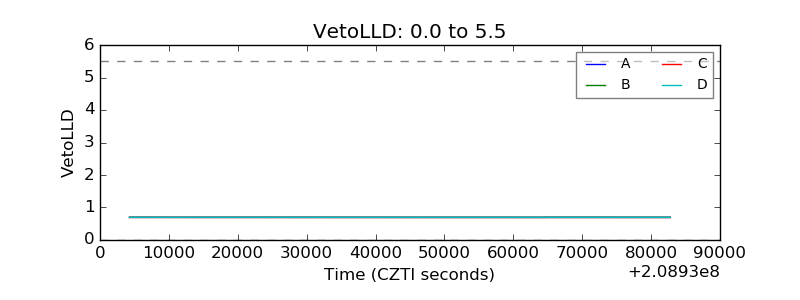 |
| Alpha Counter |  |
| _CPM_Rate |  |
| CZT Counter |  |
| +2.5 Volts monitor | 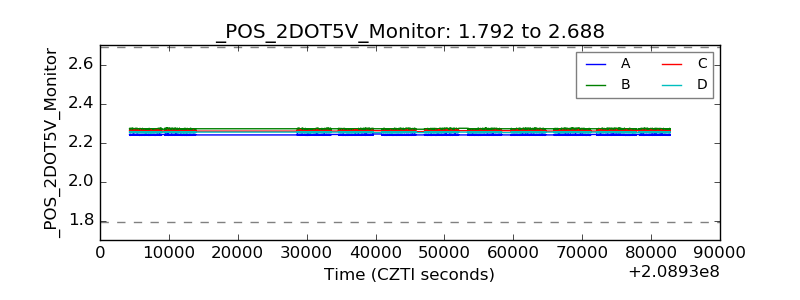 |
| +5 Volts monitor |  |
| _ROLL_ROT |  |
| _Roll_DEC |  |
| _Roll_RA | 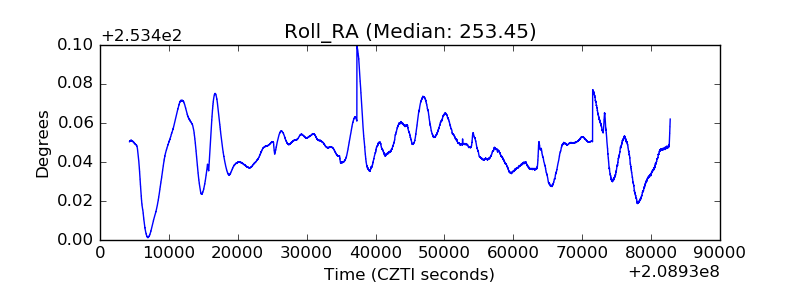 |
| Veto Counter | 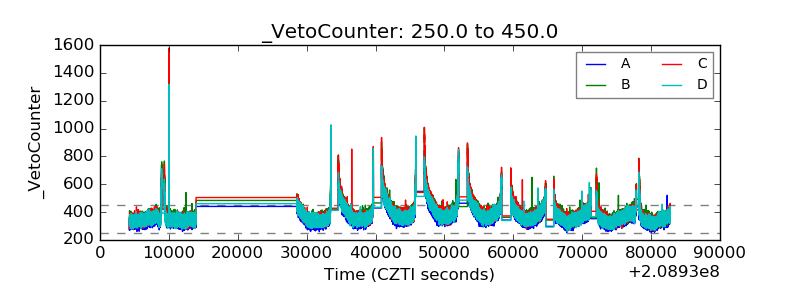 |