| Param | Original file | Final file |
|---|---|---|
| Filename | modeM0/AS1G05_218T05_9000000602_04770cztM0_level2.evt | modeM0/AS1G05_218T05_9000000602_04770cztM0_level2_quad_clean.evt |
| Size (bytes) | 440,040,960 | 59,806,080 |
| Size | 419.7 MB | 57.0 MB |
| Events in quadrant A | 2,319,133 | 384,781 |
| Events in quadrant B | 2,500,417 | 379,211 |
| Events in quadrant C | 5,281,210 | 322,622 |
| Events in quadrant D | 2,879,021 | 366,473 |
| Mode M9 | |||
|---|---|---|---|
| Quadrant | BADHDUFLAG | Total packets | Discarded packets |
| A | 0 | 4 | 0 |
| B | 0 | 4 | 0 |
| C | 0 | 4 | 0 |
| D | 0 | 4 | 0 |
| Mode SS | |||
|---|---|---|---|
| Quadrant | BADHDUFLAG | Total packets | Discarded packets |
| A | 0 | 106 | 2 |
| B | 0 | 106 | 6 |
| C | 0 | 106 | 0 |
| D | 0 | 106 | 0 |
| Mode M0 | |||
|---|---|---|---|
| Quadrant | BADHDUFLAG | Total packets | Discarded packets |
| A | 0 | 10606 | 126 |
| B | 0 | 10997 | 165 |
| C | 0 | 19790 | 355 |
| D | 0 | 12424 | 201 |
| Quadrant | Total seconds | Saturated seconds | Saturation percentage |
|---|---|---|---|
| A | 5109 | 112 | 2.192210% |
| B | 5091 | 121 | 2.376743% |
| C | 5088 | 1180 | 23.191824% |
| D | 5090 | 160 | 3.143418% |
Noise dominated data is calculated using 1-second bins in cleaned event files. If a bin has >2000 counts, and if more than 50% of those come from <1% of pixels, then it is considered to be noise-dominated and hence unusable.
| Quadrant | # 1 sec bins | Bins with >0 counts | Bins with >2000 counts | High rate bins dominated by noise | Noise dominated (total time) | Noise dominated (detector-on time) | Marked lightcurve |
|---|---|---|---|---|---|---|---|
| A | 5556 | 5159 | 0 | 0 | 0.00% | 0.00% | 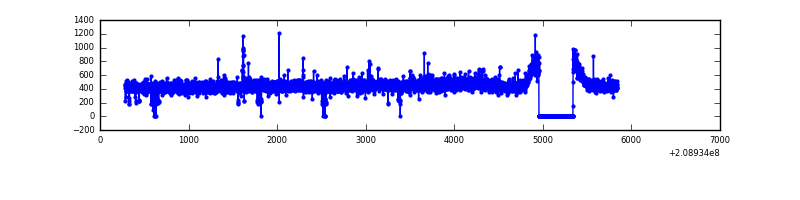 |
| B | 5556 | 5156 | 1 | 1 | 0.02% | 0.02% | 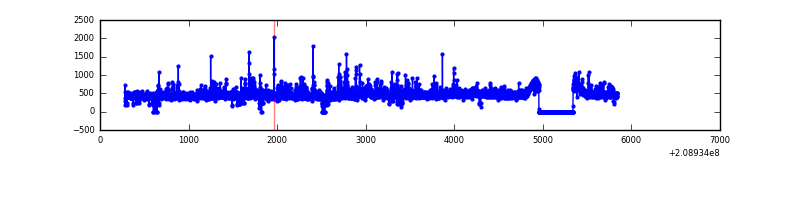 |
| C | 5556 | 5153 | 864 | 864 | 15.55% | 16.77% | 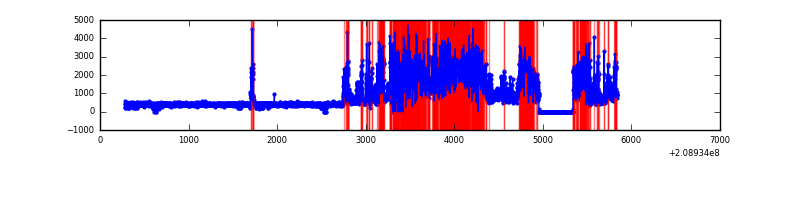 |
| D | 5556 | 5148 | 38 | 38 | 0.68% | 0.74% | 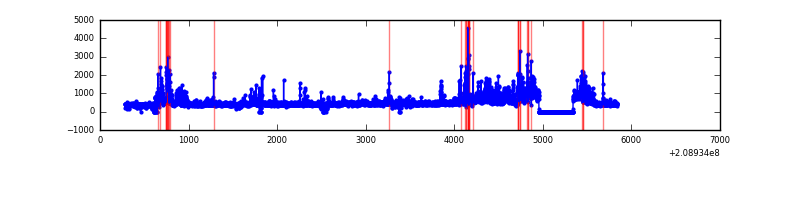 |
Top three noisy pixels from each quadrant. If the there are fewer than three noisy pixels in the level2.evt file, extra rows are filled as -1
| Pixel properties | Quadrant properties | ||||||
|---|---|---|---|---|---|---|---|
| Quadrant | DetID | PixID | Counts | Sigma | Mean | Median | Sigma |
| A | 8 | 15 | 24051 | 192.5 | 589 | 574 | 122.0 |
| A | 7 | 16 | 13173 | 103.3 | 589 | 574 | 122.0 |
| A | 3 | 1 | 6857 | 51.52 | 589 | 574 | 122.0 |
| B | 4 | 80 | 139771 | 1199.46 | 591 | 574 | 116.0 |
| B | 14 | 167 | 30989 | 262.09 | 591 | 574 | 116.0 |
| B | 15 | 54 | 20650 | 173.0 | 591 | 574 | 116.0 |
| C | 14 | 48 | 3273601 | 27085.21 | 512 | 514 | 120.8 |
| C | 12 | 4 | 5754 | 43.36 | 512 | 514 | 120.8 |
| C | 13 | 61 | 4128 | 29.91 | 512 | 514 | 120.8 |
| D | 13 | 235 | 433152 | 3110.74 | 567 | 549 | 139.1 |
| D | 2 | 136 | 118988 | 851.66 | 567 | 549 | 139.1 |
| D | 13 | 239 | 42954 | 304.92 | 567 | 549 | 139.1 |
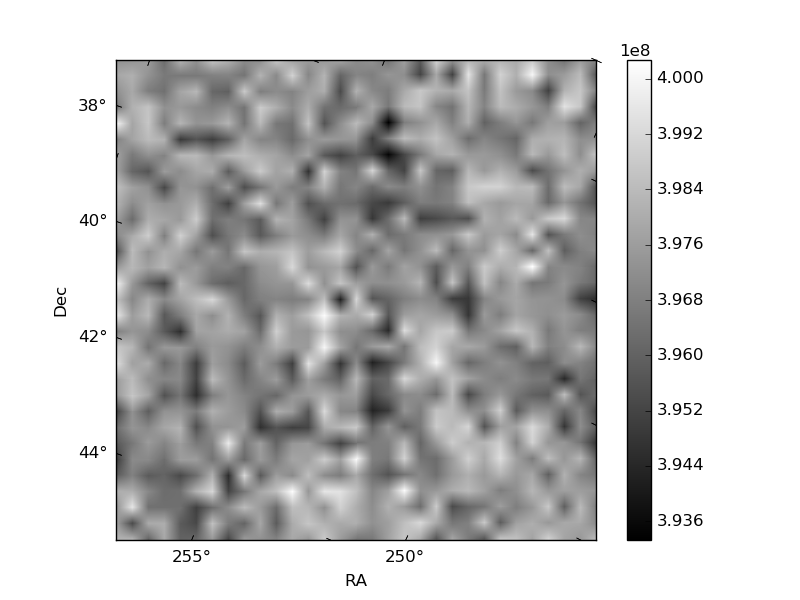
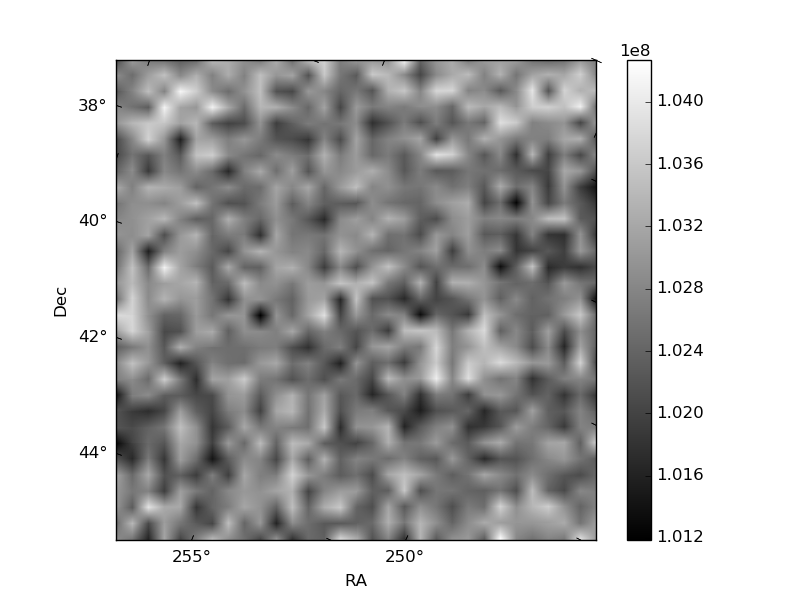
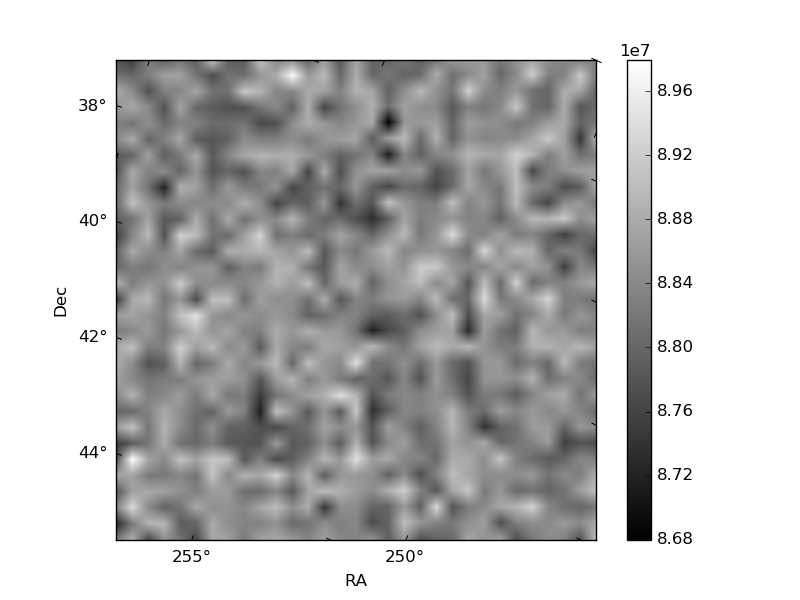
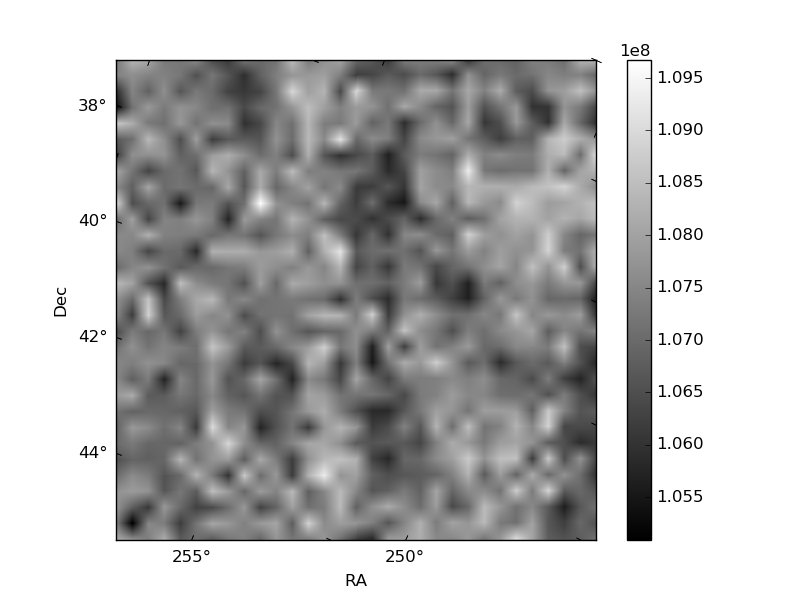
Histogram calculated using DETX and DETY for each event in the final _common_clean file
| Quadrant A | 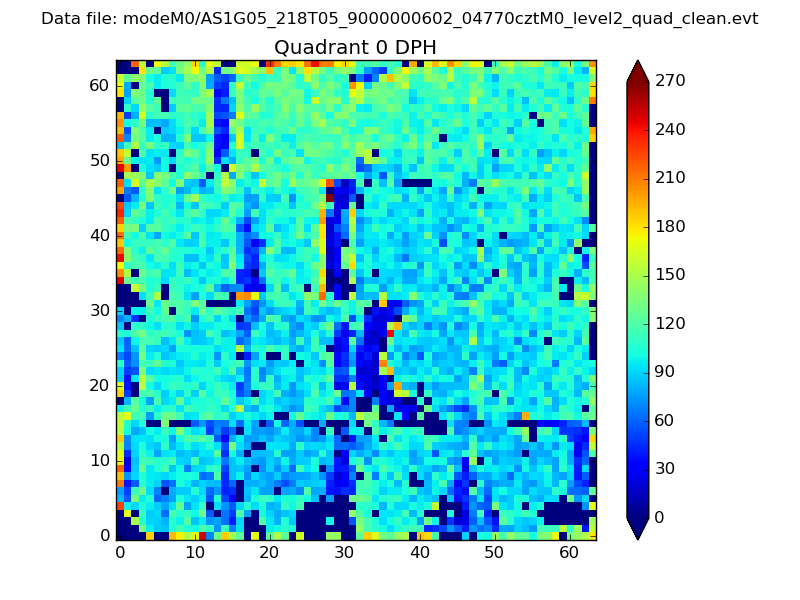 |
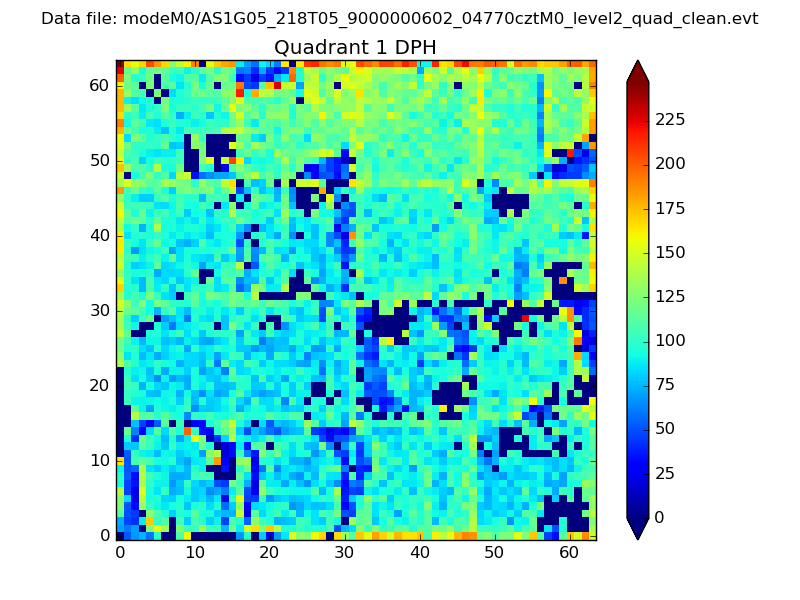 |
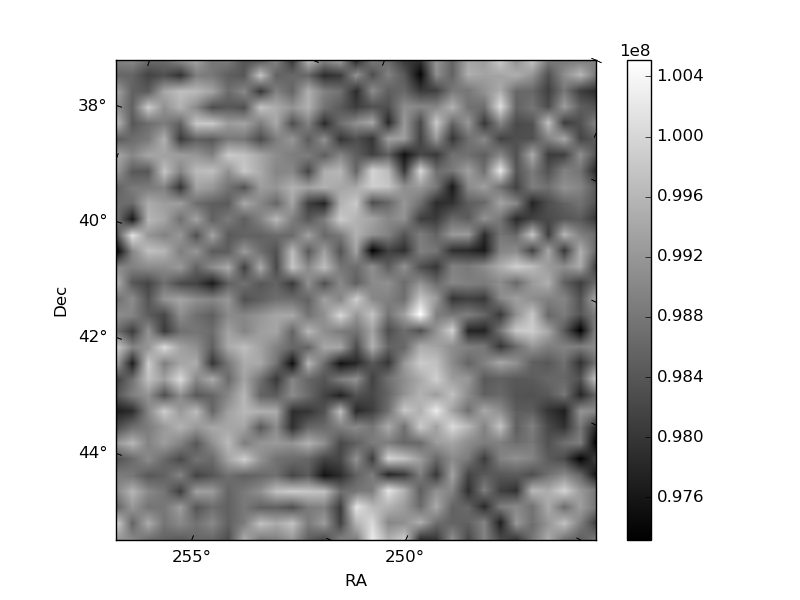
Quadrant B |
|---|---|---|---|
| Quadrant D | 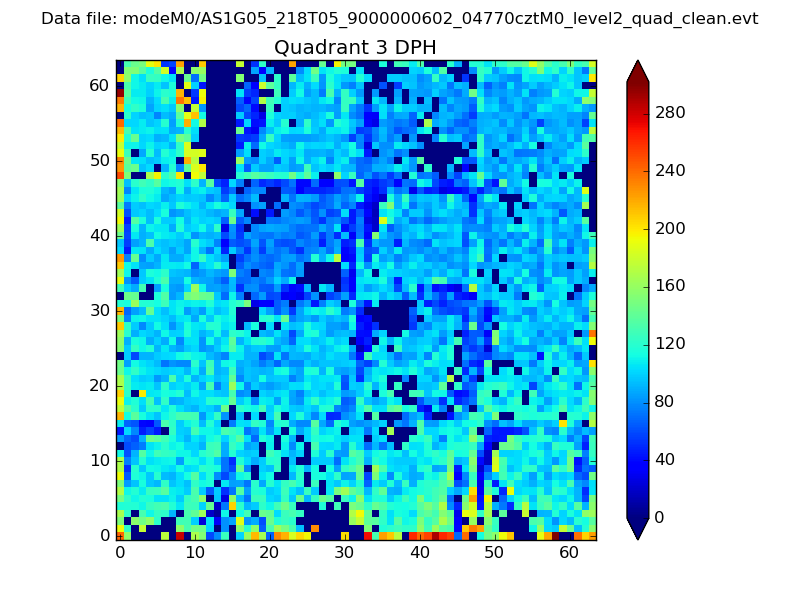 |
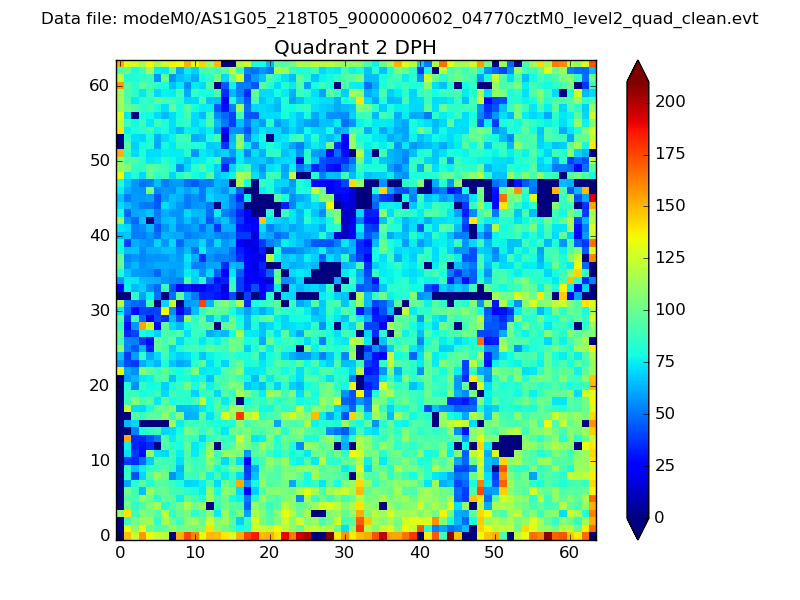 |
Quadrant C |
| Plot type | Count rate plots | Images |
|---|---|---|
| Comparison with Poisson distribution Blue bars denote a histogram of data divided into 1 sec bins. Red curve is a Poisson curve with rate = median count rate of data. |
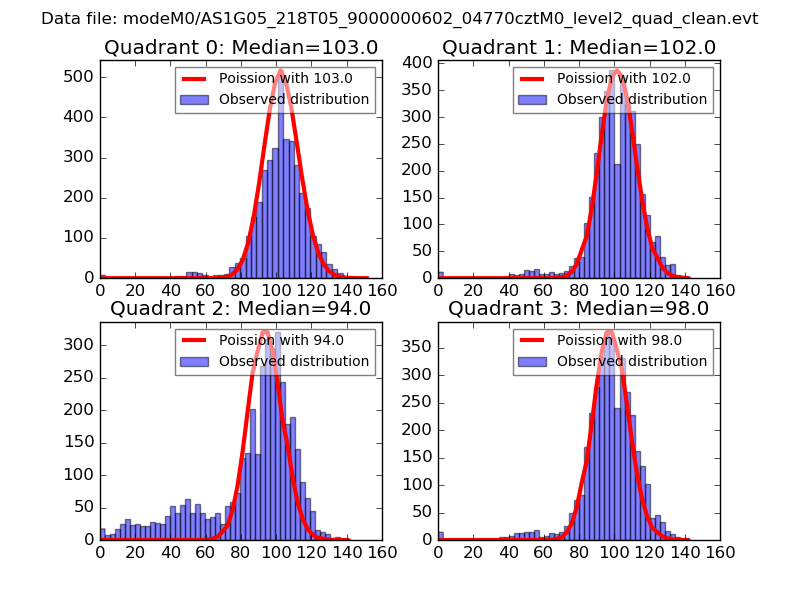 |
 |
| Quadrant-wise count rates Data is divided into 100 sec bins |
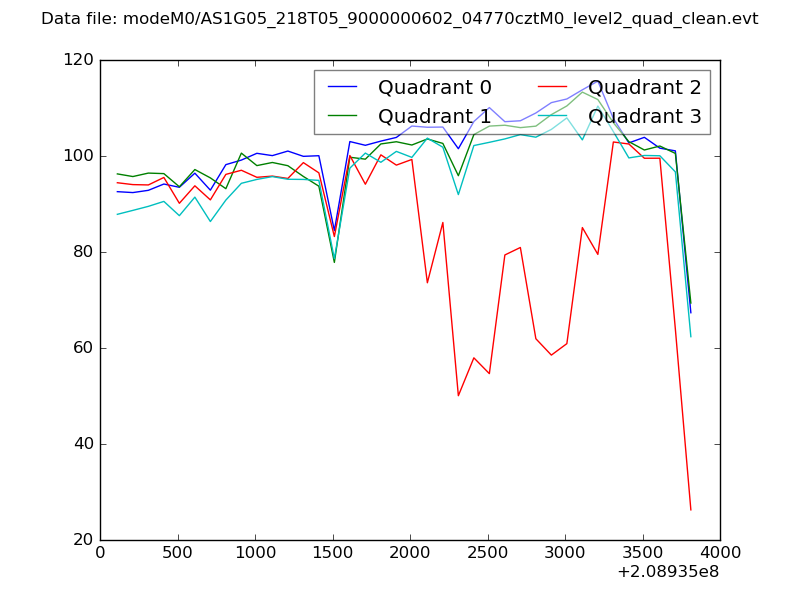 |
|
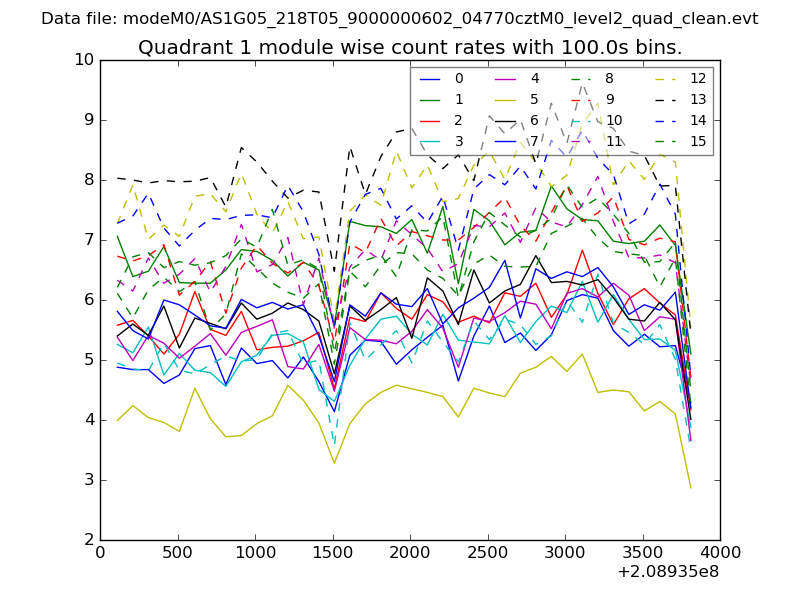
| Module-wise count rates for Quadrant A Data is divided into 100 sec bins |
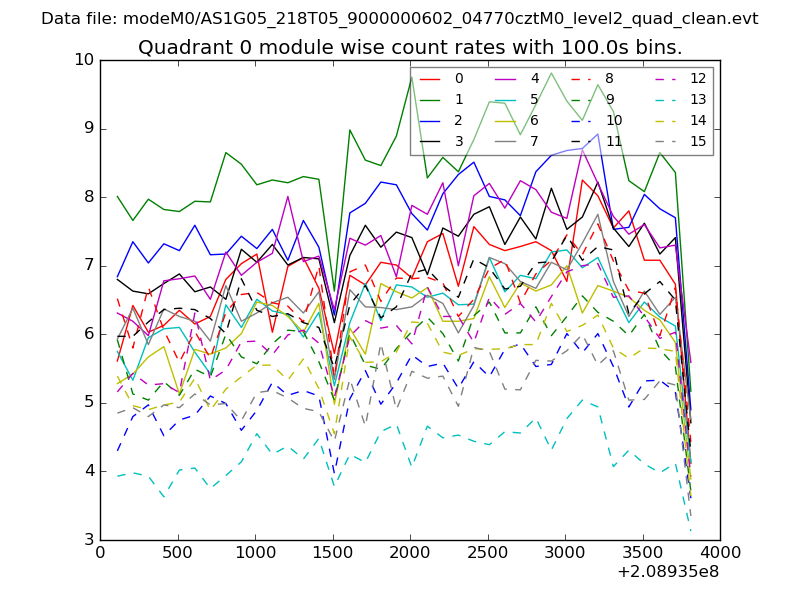 |
 |
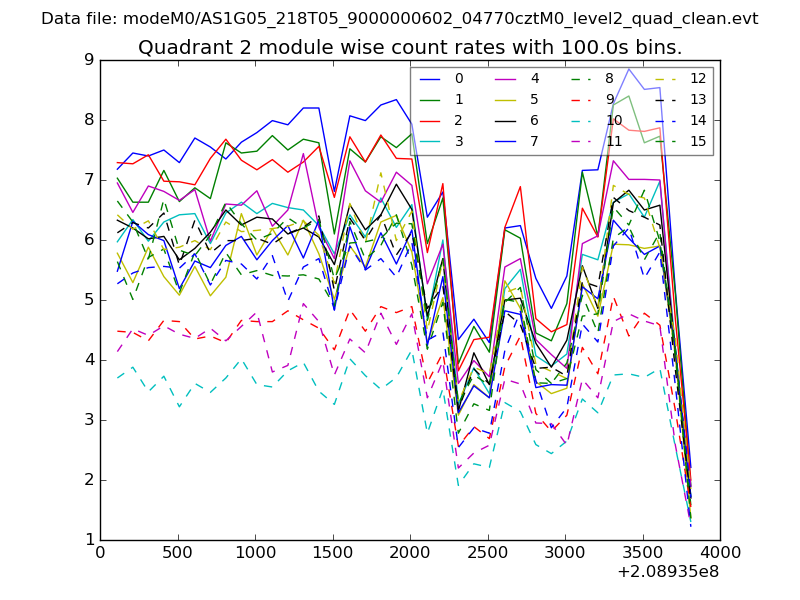
| Module-wise count rates for Quadrant B Data is divided into 100 sec bins |
 |
 |
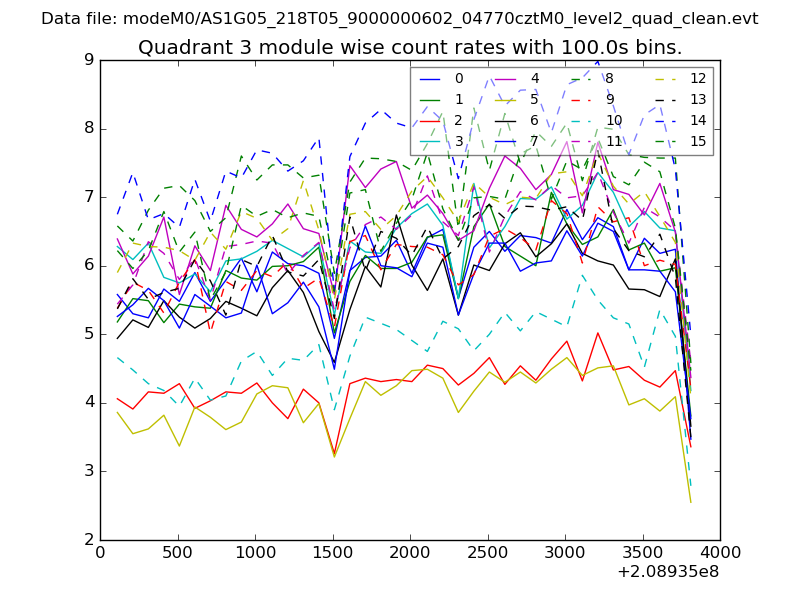
| Module-wise count rates for Quadrant C Data is divided into 100 sec bins |
 |
 |
| Module-wise count rates for Quadrant D Data is divided into 100 sec bins |
 |
 |
| Parameter | Plot |
|---|---|
| CZT HV Monitor | 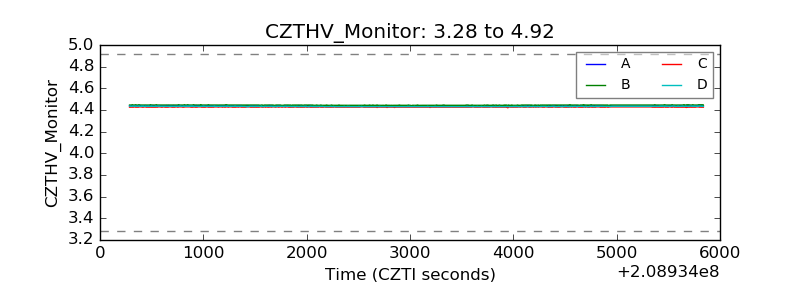 |
| D_VDD | 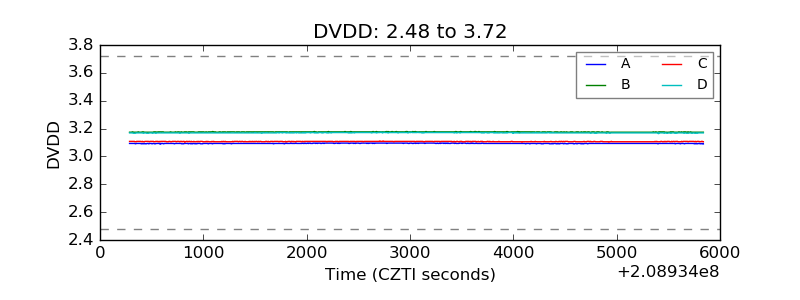 |
| Temperature 1 | 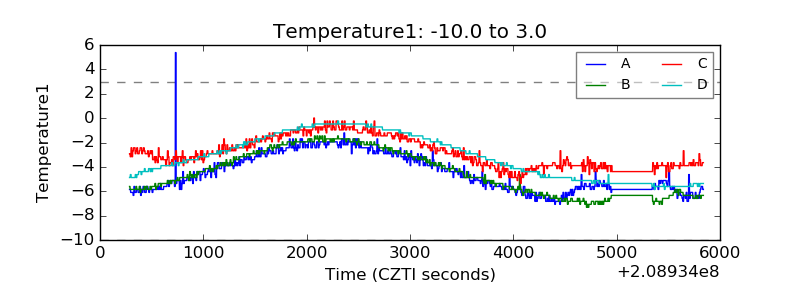 |
| Veto HV Monitor | 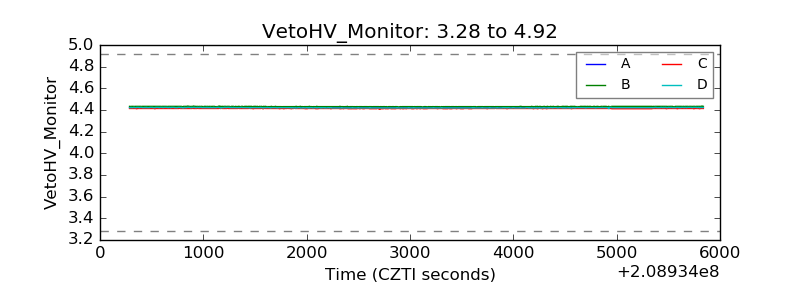 |
| Veto LLD | 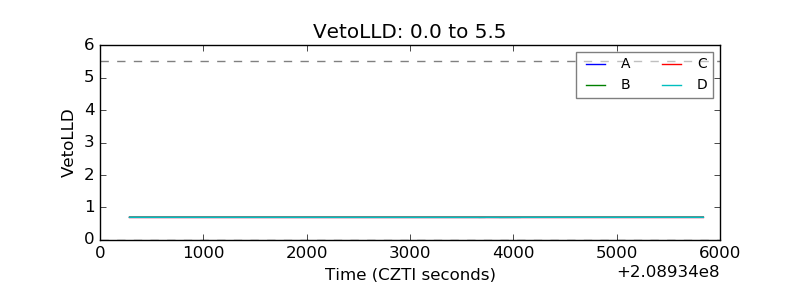 |
| Alpha Counter | 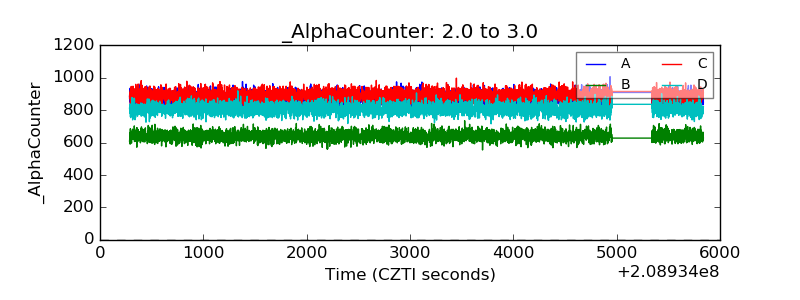 |
| _CPM_Rate | 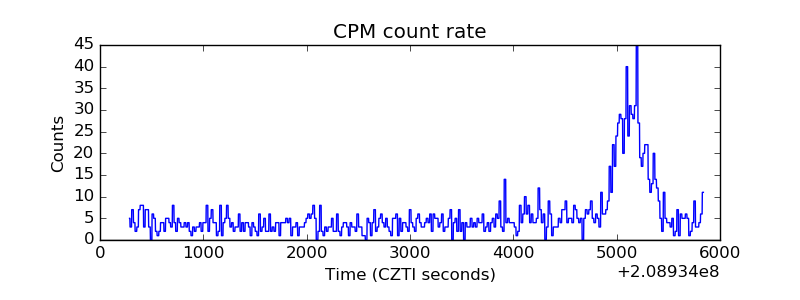 |
| CZT Counter | 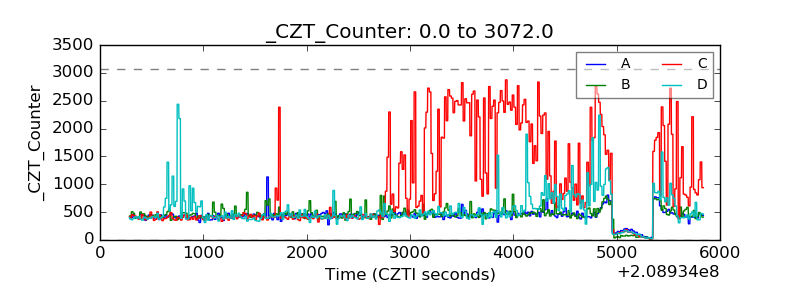 |
| +2.5 Volts monitor |  |
| +5 Volts monitor |  |
| _ROLL_ROT | 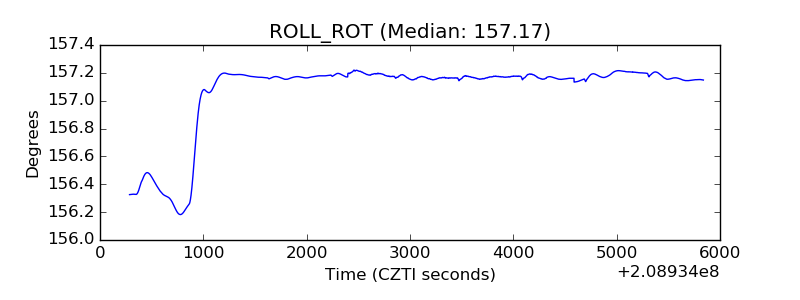 |
| _Roll_DEC | 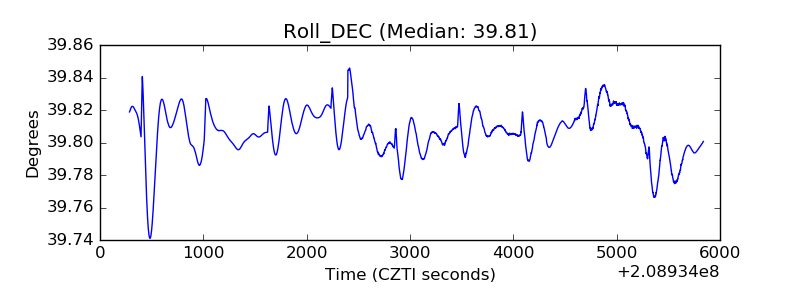 |
| _Roll_RA | 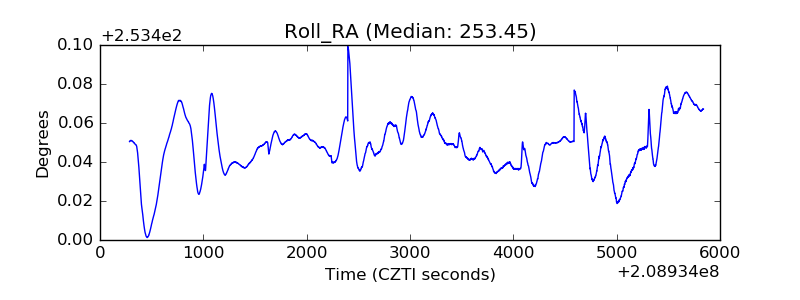 |
| Veto Counter | 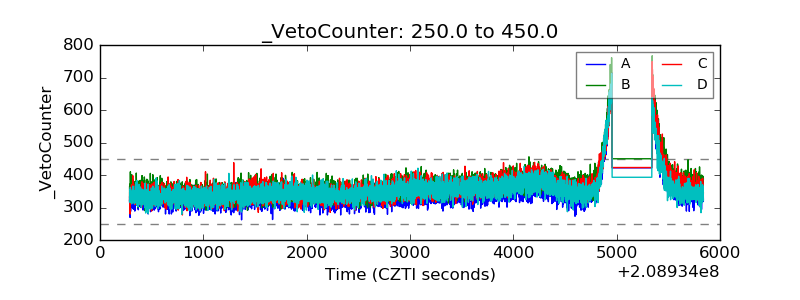 |