| Param | Original file | Final file |
|---|---|---|
| Filename | modeM0/AS1G05_218T05_9000000602_04771cztM0_level2.evt | modeM0/AS1G05_218T05_9000000602_04771cztM0_level2_quad_clean.evt |
| Size (bytes) | 1,657,529,280 | 204,114,240 |
| Size | 1.5 GB | 194.7 MB |
| Events in quadrant A | 8,444,357 | 1,286,780 |
| Events in quadrant B | 9,407,714 | 1,270,849 |
| Events in quadrant C | 19,489,611 | 1,151,312 |
| Events in quadrant D | 11,626,430 | 1,214,251 |
| Mode M9 | |||
|---|---|---|---|
| Quadrant | BADHDUFLAG | Total packets | Discarded packets |
| A | 0 | 25 | 0 |
| B | 0 | 25 | 0 |
| C | 0 | 25 | 0 |
| D | 0 | 25 | 0 |
| Mode SS | |||
|---|---|---|---|
| Quadrant | BADHDUFLAG | Total packets | Discarded packets |
| A | 0 | 372 | 0 |
| B | 0 | 372 | 0 |
| C | 0 | 372 | 0 |
| D | 0 | 372 | 0 |
| Mode M0 | |||
|---|---|---|---|
| Quadrant | BADHDUFLAG | Total packets | Discarded packets |
| A | 0 | 37464 | 5 |
| B | 0 | 39856 | 4 |
| C | 0 | 70227 | 4 |
| D | 0 | 47155 | 4 |
| Quadrant | Total seconds | Saturated seconds | Saturation percentage |
|---|---|---|---|
| A | 18247 | 267 | 1.463254% |
| B | 18247 | 283 | 1.550940% |
| C | 18247 | 3775 | 20.688332% |
| D | 18247 | 467 | 2.559325% |
Noise dominated data is calculated using 1-second bins in cleaned event files. If a bin has >2000 counts, and if more than 50% of those come from <1% of pixels, then it is considered to be noise-dominated and hence unusable.
| Quadrant | # 1 sec bins | Bins with >0 counts | Bins with >2000 counts | High rate bins dominated by noise | Noise dominated (total time) | Noise dominated (detector-on time) | Marked lightcurve |
|---|---|---|---|---|---|---|---|
| A | 20462 | 18247 | 11 | 11 | 0.05% | 0.06% | 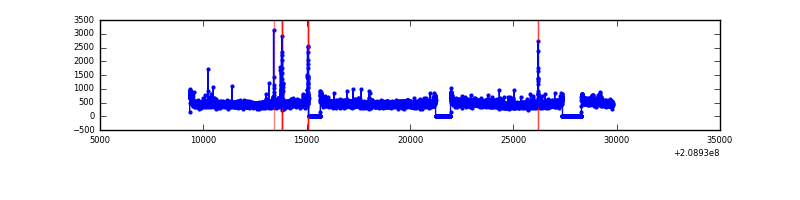 |
| B | 20462 | 18249 | 11 | 11 | 0.05% | 0.06% | 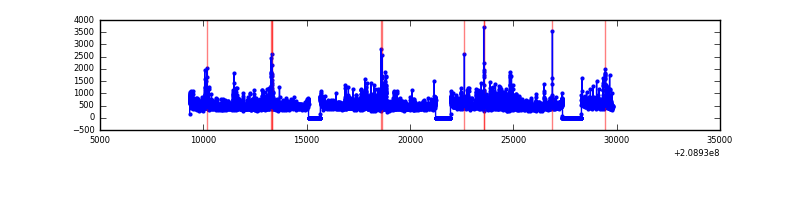 |
| C | 20462 | 18247 | 2763 | 2763 | 13.50% | 15.14% | 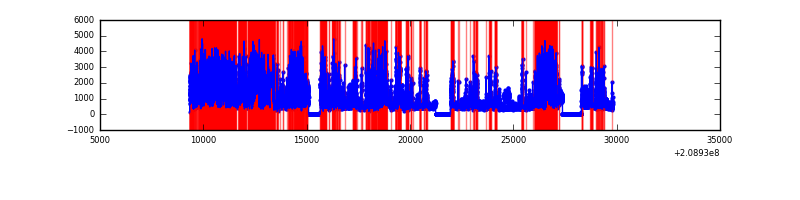 |
| D | 20462 | 18249 | 266 | 266 | 1.30% | 1.46% | 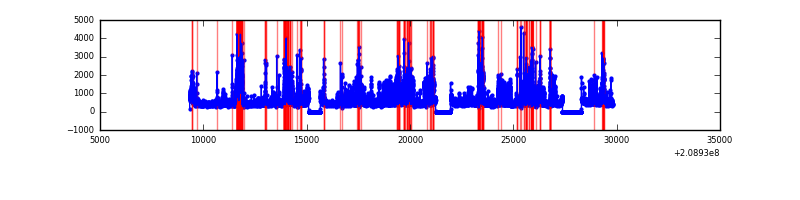 |
Top three noisy pixels from each quadrant. If the there are fewer than three noisy pixels in the level2.evt file, extra rows are filled as -1
| Pixel properties | Quadrant properties | ||||||
|---|---|---|---|---|---|---|---|
| Quadrant | DetID | PixID | Counts | Sigma | Mean | Median | Sigma |
| A | 8 | 15 | 148160 | 343.5 | 2099 | 2047 | 425.4 |
| A | 0 | 149 | 51311 | 115.82 | 2099 | 2047 | 425.4 |
| A | 13 | 14 | 38212 | 85.02 | 2099 | 2047 | 425.4 |
| B | 4 | 80 | 486380 | 1192.59 | 2115 | 2064 | 406.1 |
| B | 15 | 204 | 361833 | 885.9 | 2115 | 2064 | 406.1 |
| B | 14 | 167 | 221683 | 540.79 | 2115 | 2064 | 406.1 |
| C | 14 | 48 | 12130764 | 27949.56 | 1869 | 1878 | 434.0 |
| C | 1 | 16 | 39989 | 87.82 | 1869 | 1878 | 434.0 |
| C | 12 | 4 | 16586 | 33.89 | 1869 | 1878 | 434.0 |
| D | 11 | 132 | 1577957 | 3236.33 | 2025 | 1966 | 487.0 |
| D | 13 | 235 | 1399346 | 2869.55 | 2025 | 1966 | 487.0 |
| D | 2 | 136 | 413778 | 845.66 | 2025 | 1966 | 487.0 |
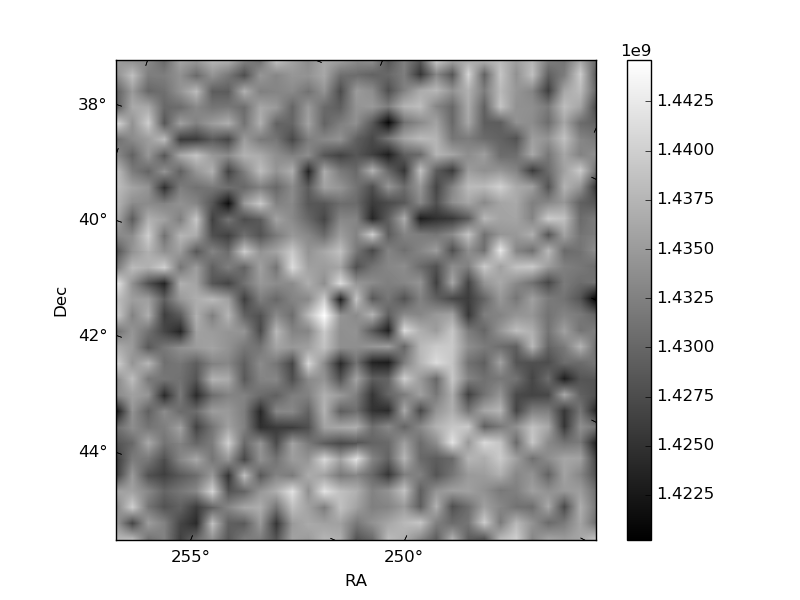
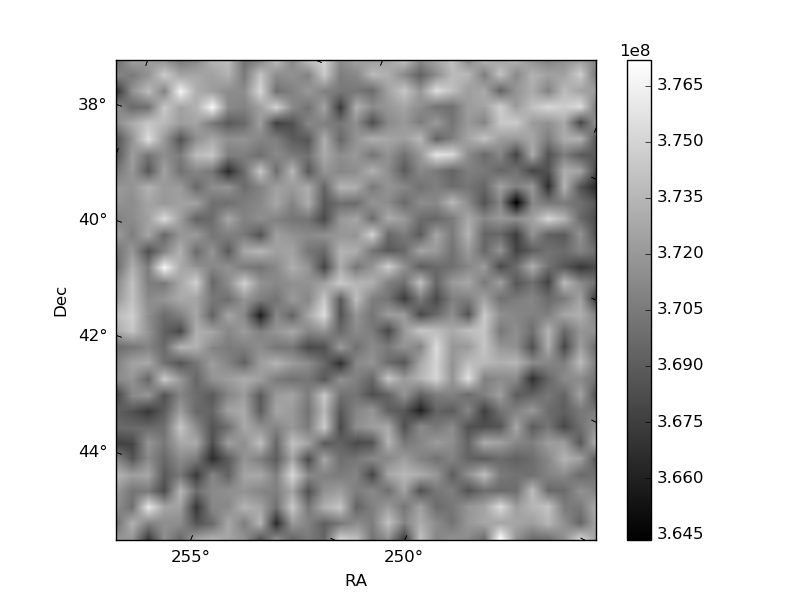
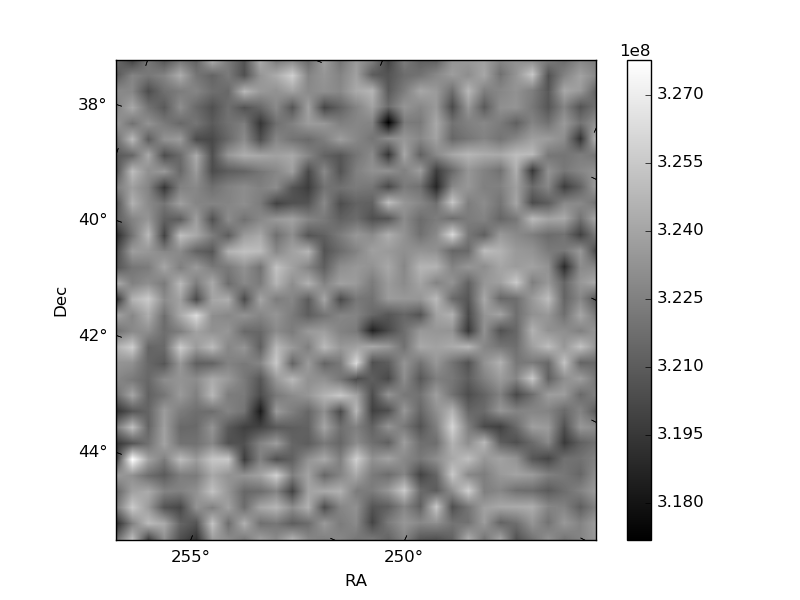
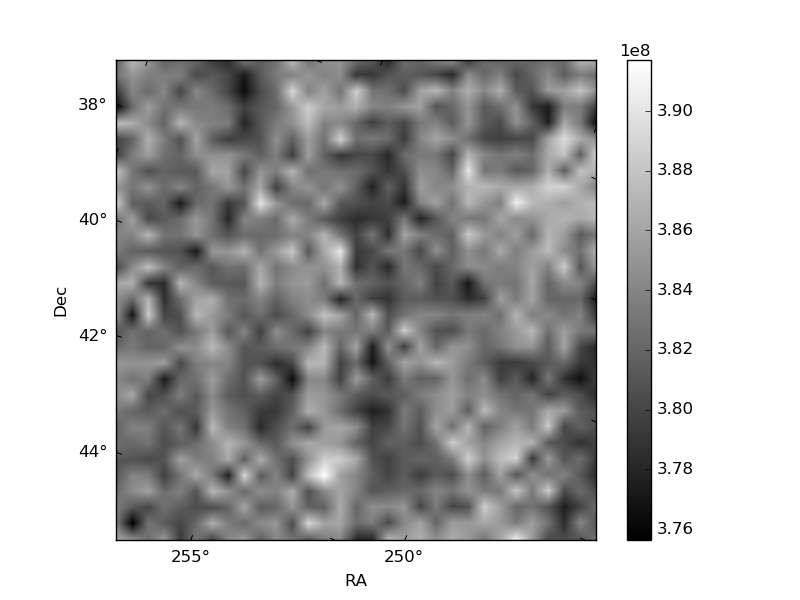
Histogram calculated using DETX and DETY for each event in the final _common_clean file
| Quadrant A | 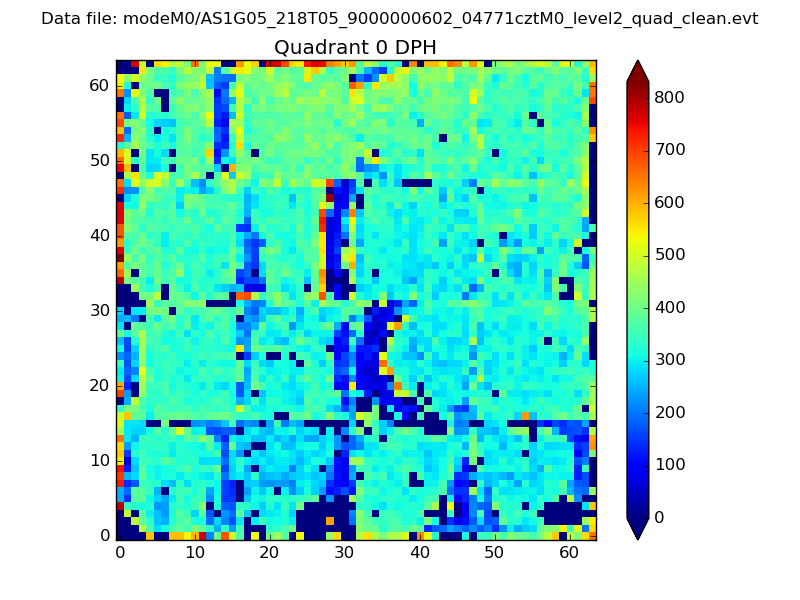 |
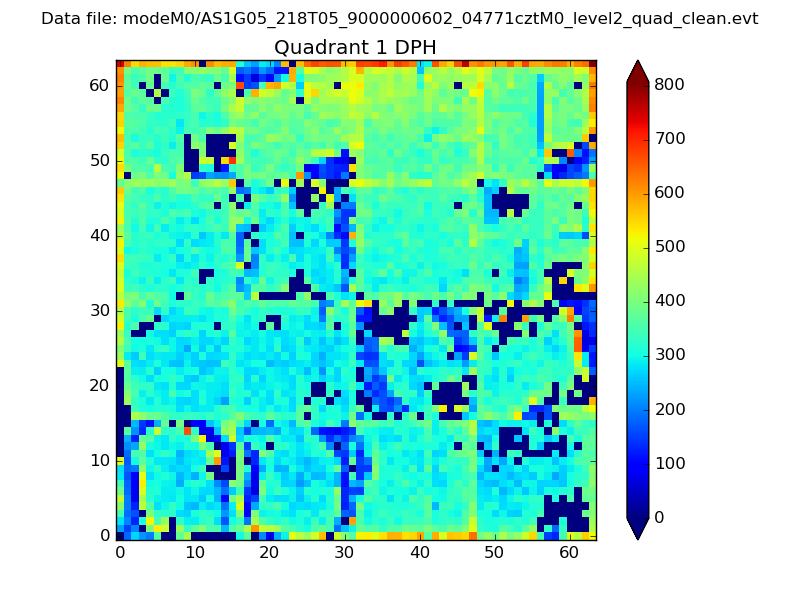 |
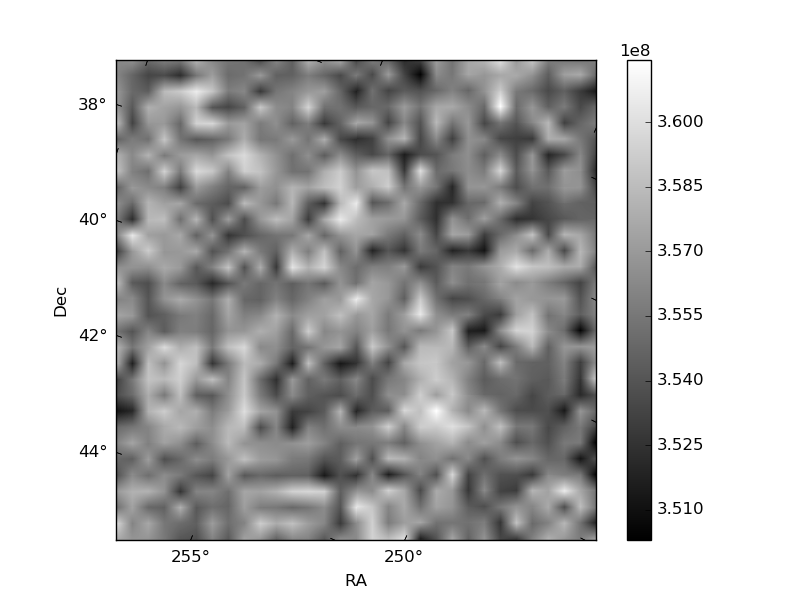
Quadrant B |
|---|---|---|---|
| Quadrant D | 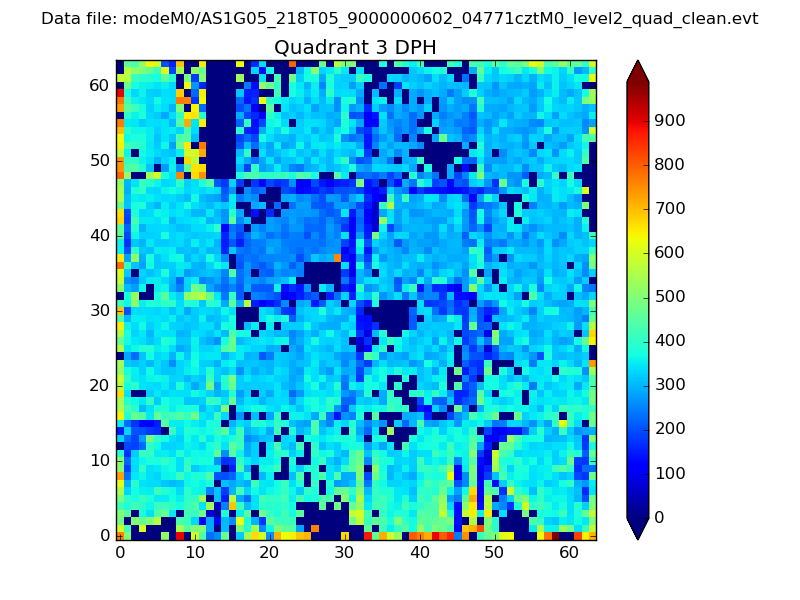 |
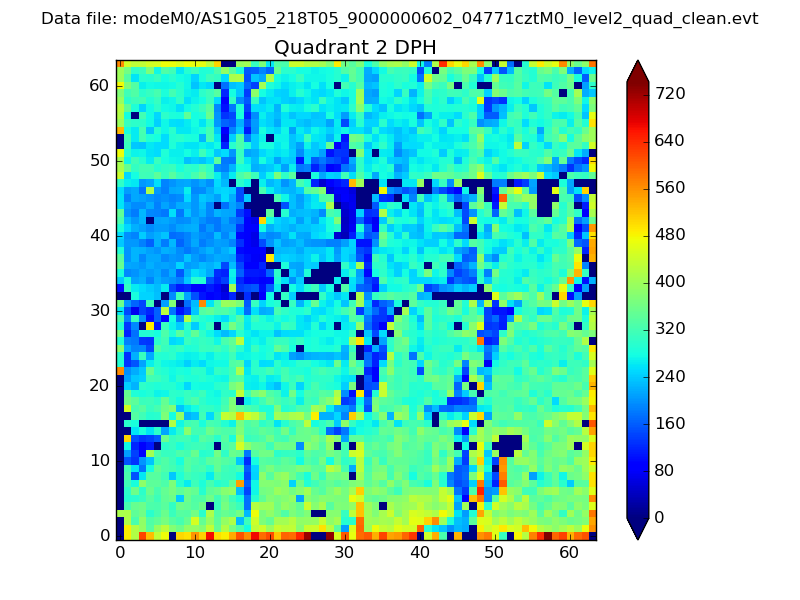 |
Quadrant C |
| Plot type | Count rate plots | Images |
|---|---|---|
| Comparison with Poisson distribution Blue bars denote a histogram of data divided into 1 sec bins. Red curve is a Poisson curve with rate = median count rate of data. |
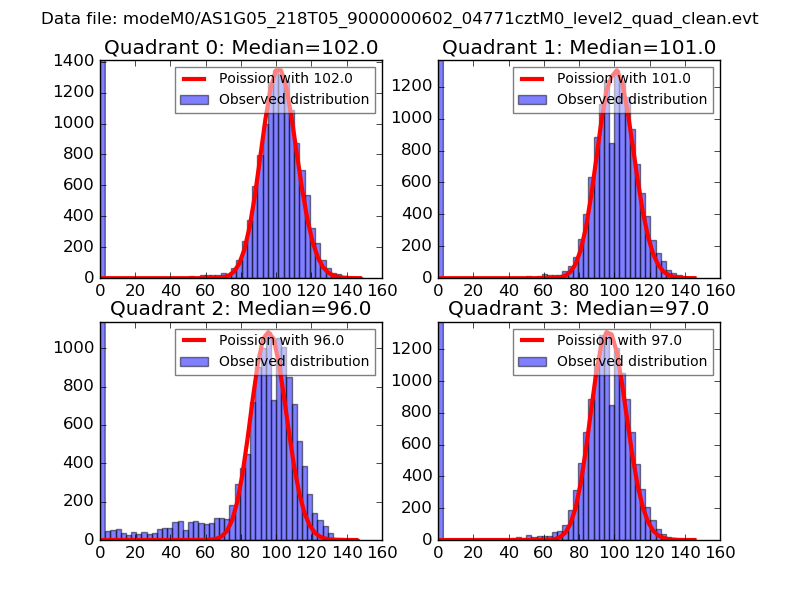 |
 |
| Quadrant-wise count rates Data is divided into 100 sec bins |
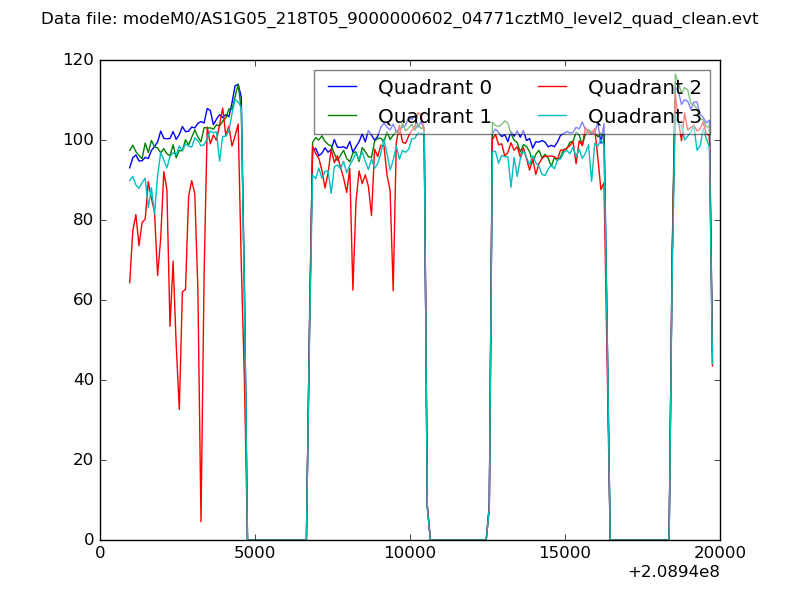 |
|
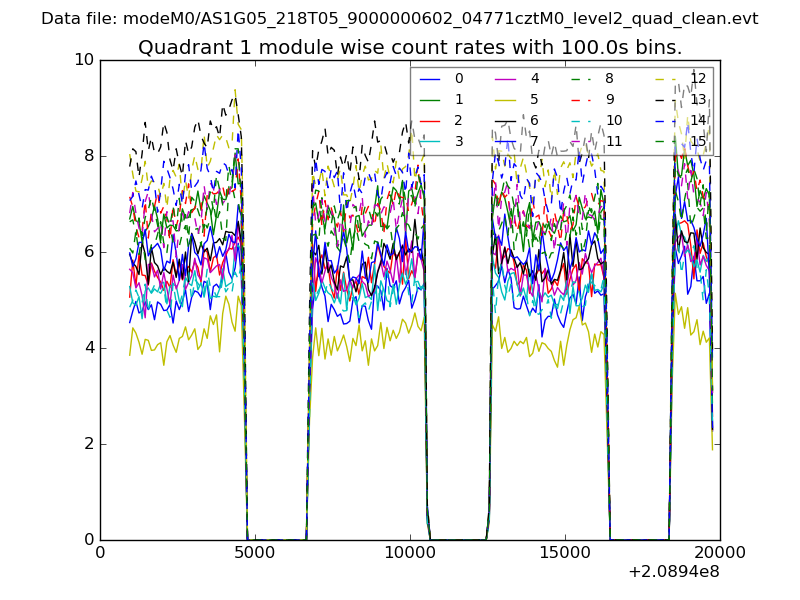
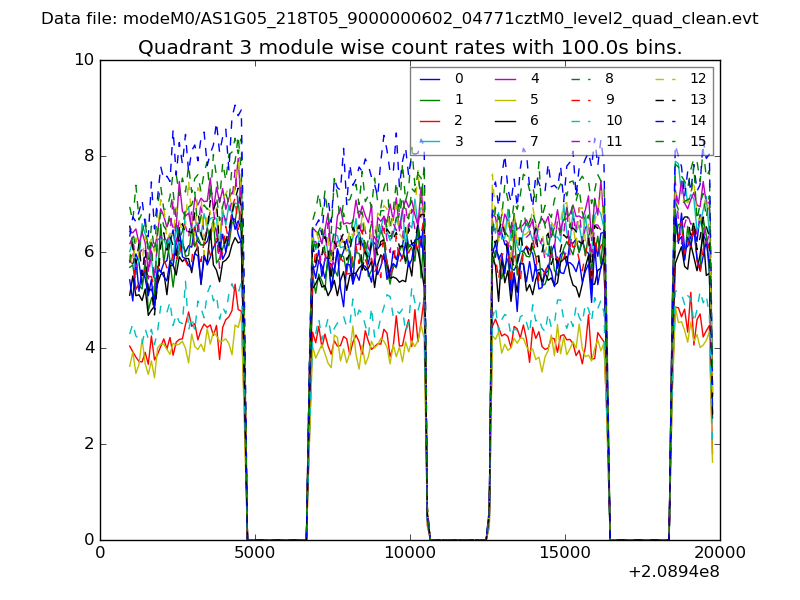
| Module-wise count rates for Quadrant A Data is divided into 100 sec bins |
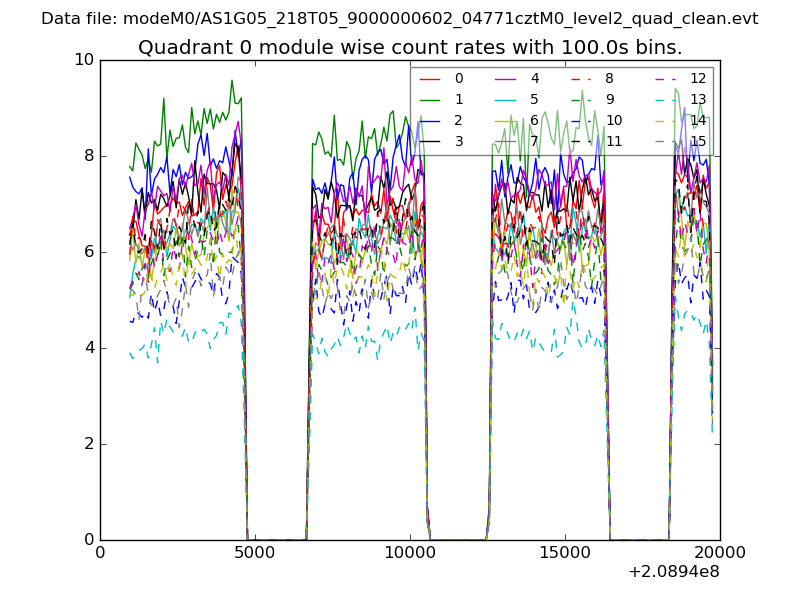 |
 |
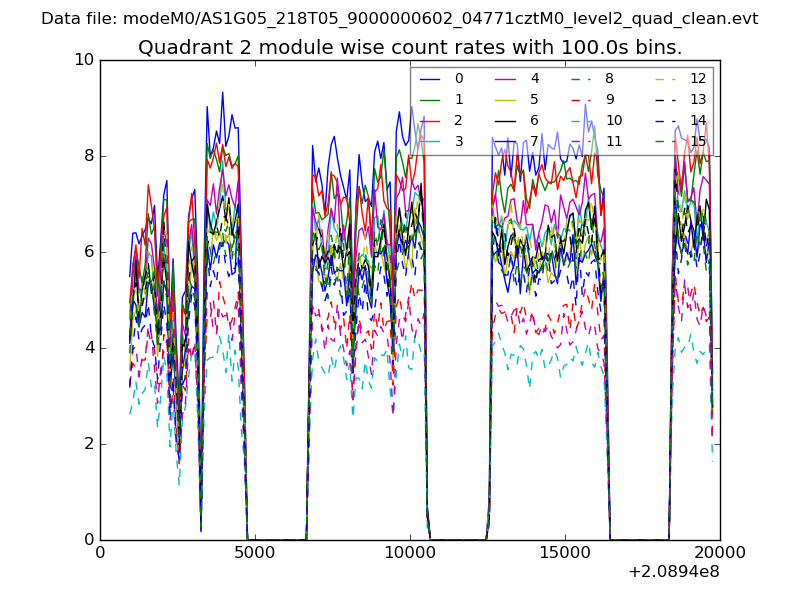
| Module-wise count rates for Quadrant B Data is divided into 100 sec bins |
 |
 |
| Module-wise count rates for Quadrant C Data is divided into 100 sec bins |
 |
 |
| Module-wise count rates for Quadrant D Data is divided into 100 sec bins |
 |
 |
| Parameter | Plot |
|---|---|
| CZT HV Monitor | 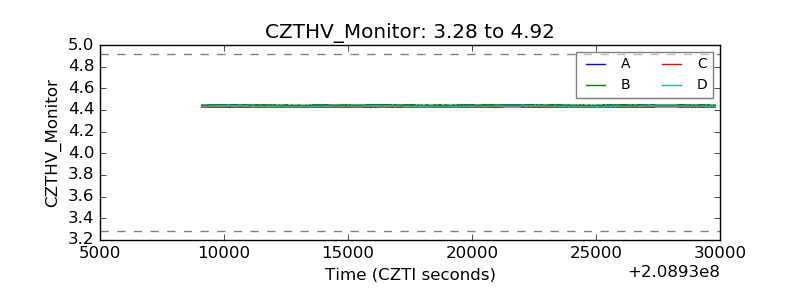 |
| D_VDD | 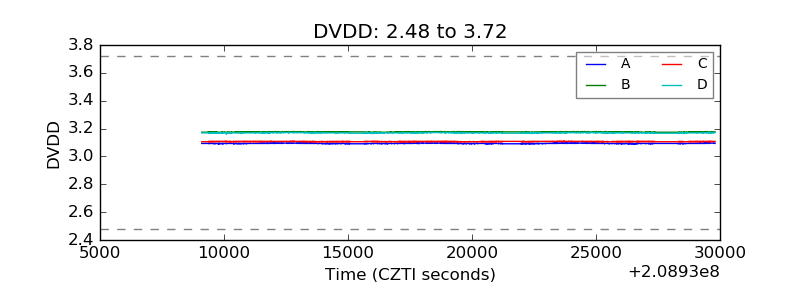 |
| Temperature 1 | 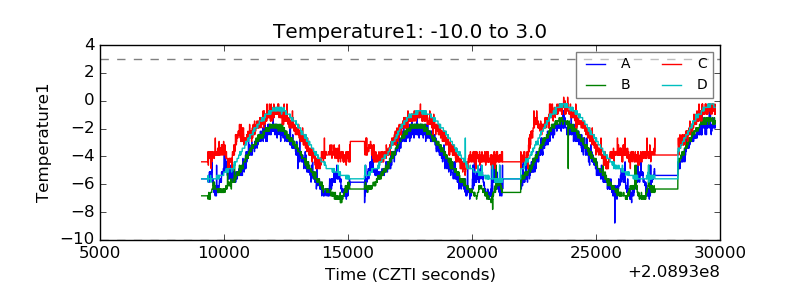 |
| Veto HV Monitor | 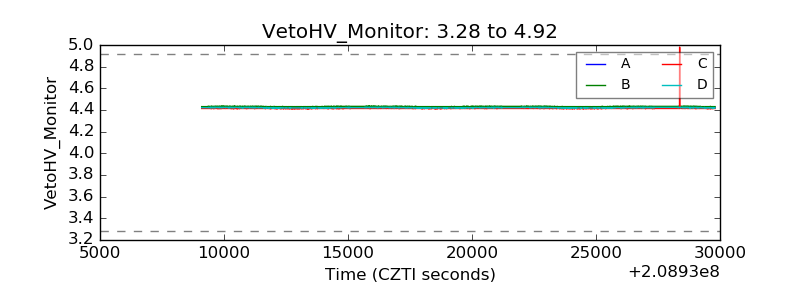 |
| Veto LLD | 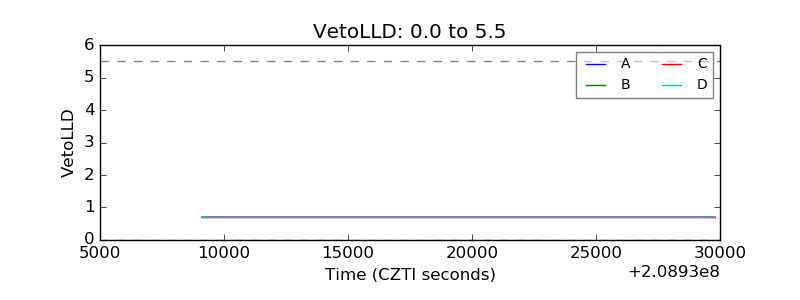 |
| Alpha Counter | 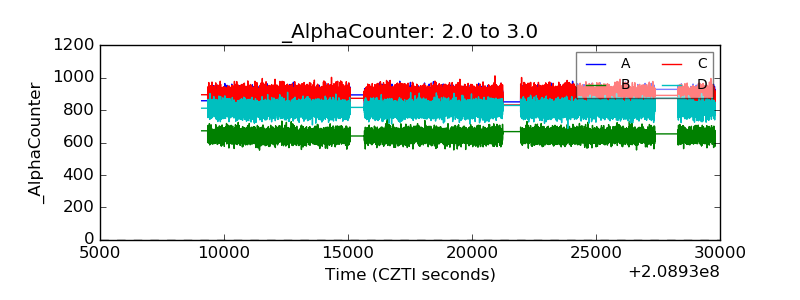 |
| _CPM_Rate | 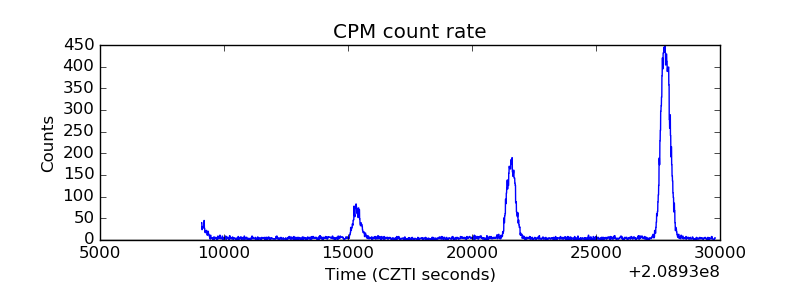 |
| CZT Counter | 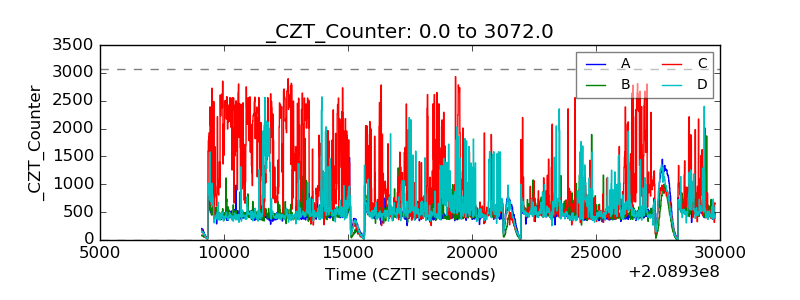 |
| +2.5 Volts monitor | 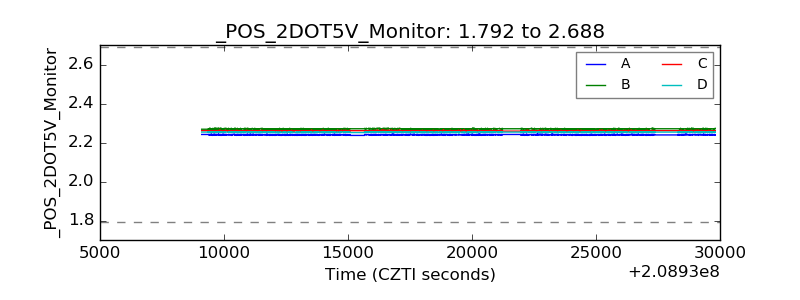 |
| +5 Volts monitor |  |
| _ROLL_ROT | 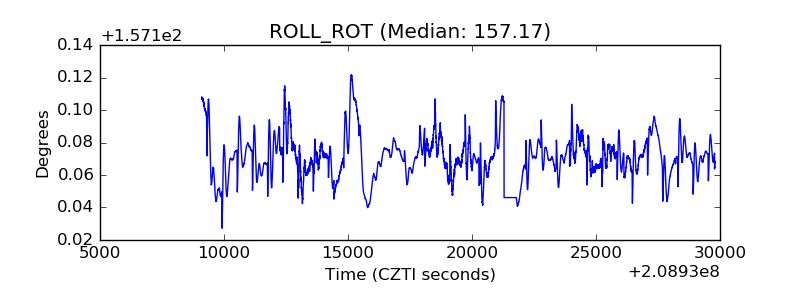 |
| _Roll_DEC | 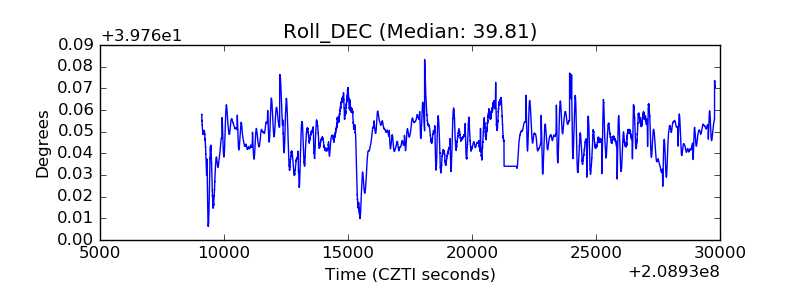 |
| _Roll_RA | 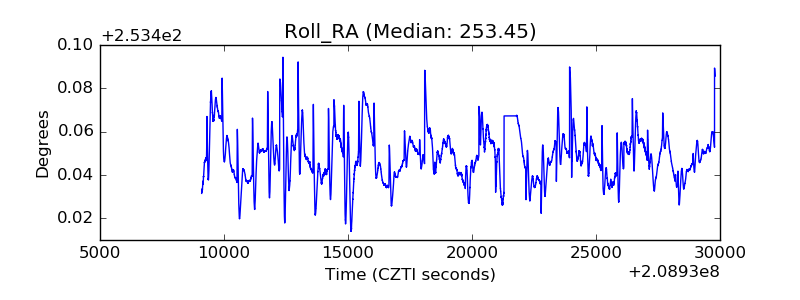 |
| Veto Counter | 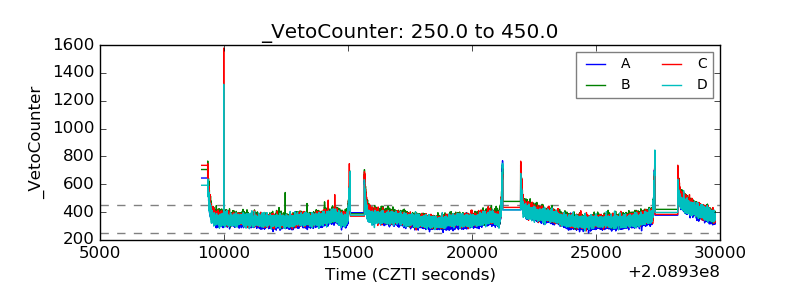 |