| Param | Original file | Final file |
|---|---|---|
| Filename | modeM0/AS1G05_218T05_9000000602_04773cztM0_level2.evt | modeM0/AS1G05_218T05_9000000602_04773cztM0_level2_quad_clean.evt |
| Size (bytes) | 1,433,128,320 | 190,687,680 |
| Size | 1.3 GB | 181.9 MB |
| Events in quadrant A | 7,106,300 | 1,241,516 |
| Events in quadrant B | 7,892,921 | 1,225,583 |
| Events in quadrant C | 17,347,885 | 1,058,982 |
| Events in quadrant D | 9,998,956 | 1,167,703 |
| Mode M9 | |||
|---|---|---|---|
| Quadrant | BADHDUFLAG | Total packets | Discarded packets |
| A | 0 | 14 | 0 |
| B | 0 | 14 | 0 |
| C | 0 | 14 | 0 |
| D | 0 | 14 | 0 |
| Mode SS | |||
|---|---|---|---|
| Quadrant | BADHDUFLAG | Total packets | Discarded packets |
| A | 0 | 320 | 0 |
| B | 0 | 320 | 0 |
| C | 0 | 320 | 0 |
| D | 0 | 320 | 0 |
| Mode M0 | |||
|---|---|---|---|
| Quadrant | BADHDUFLAG | Total packets | Discarded packets |
| A | 0 | 32142 | 3 |
| B | 0 | 33919 | 2 |
| C | 0 | 62456 | 2 |
| D | 0 | 40798 | 10 |
| Quadrant | Total seconds | Saturated seconds | Saturation percentage |
|---|---|---|---|
| A | 15648 | 213 | 1.361196% |
| B | 15648 | 200 | 1.278119% |
| C | 15648 | 3807 | 24.328988% |
| D | 15647 | 496 | 3.169937% |
Noise dominated data is calculated using 1-second bins in cleaned event files. If a bin has >2000 counts, and if more than 50% of those come from <1% of pixels, then it is considered to be noise-dominated and hence unusable.
| Quadrant | # 1 sec bins | Bins with >0 counts | Bins with >2000 counts | High rate bins dominated by noise | Noise dominated (total time) | Noise dominated (detector-on time) | Marked lightcurve |
|---|---|---|---|---|---|---|---|
| A | 31748 | 15649 | 5 | 5 | 0.02% | 0.03% | 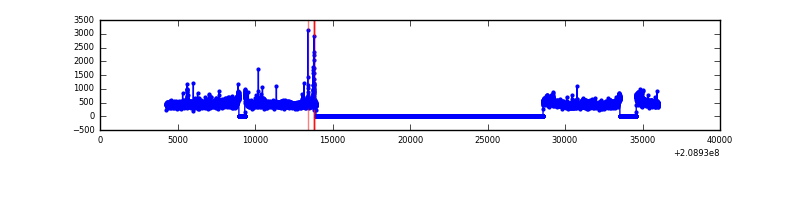 |
| B | 31748 | 15651 | 15 | 15 | 0.05% | 0.10% | 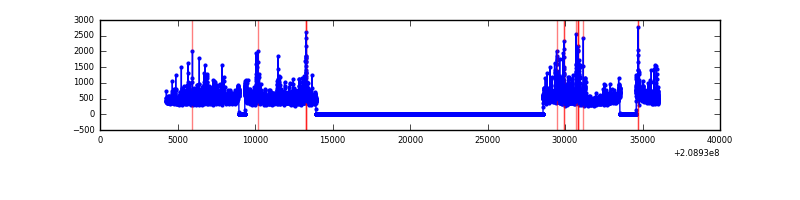 |
| C | 31747 | 15649 | 2936 | 2936 | 9.25% | 18.76% | 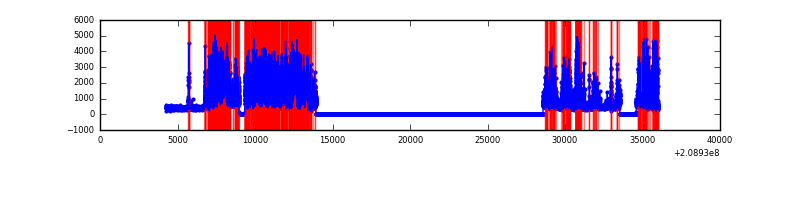 |
| D | 31748 | 15649 | 244 | 244 | 0.77% | 1.56% | 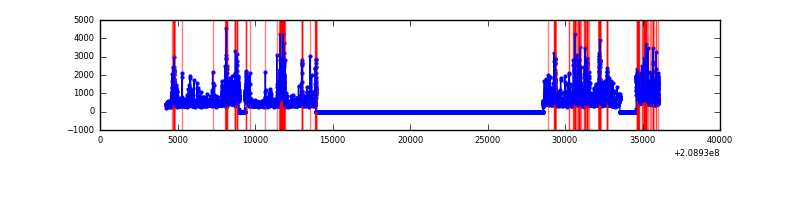 |
Top three noisy pixels from each quadrant. If the there are fewer than three noisy pixels in the level2.evt file, extra rows are filled as -1
| Pixel properties | Quadrant properties | ||||||
|---|---|---|---|---|---|---|---|
| Quadrant | DetID | PixID | Counts | Sigma | Mean | Median | Sigma |
| A | 8 | 15 | 54775 | 146.51 | 1795 | 1755 | 361.9 |
| A | 0 | 149 | 50344 | 134.27 | 1795 | 1755 | 361.9 |
| A | 14 | 111 | 23507 | 60.11 | 1795 | 1755 | 361.9 |
| B | 4 | 80 | 388133 | 1123.97 | 1800 | 1754 | 343.8 |
| B | 14 | 167 | 279496 | 807.95 | 1800 | 1754 | 343.8 |
| B | 8 | 3 | 94117 | 268.68 | 1800 | 1754 | 343.8 |
| C | 14 | 48 | 11173732 | 30975.47 | 1557 | 1563 | 360.7 |
| C | 1 | 16 | 77717 | 211.14 | 1557 | 1563 | 360.7 |
| C | 12 | 4 | 13290 | 32.51 | 1557 | 1563 | 360.7 |
| D | 11 | 132 | 1267311 | 3027.84 | 1732 | 1678 | 418.0 |
| D | 13 | 235 | 1010799 | 2414.17 | 1732 | 1678 | 418.0 |
| D | 2 | 136 | 396343 | 944.18 | 1732 | 1678 | 418.0 |
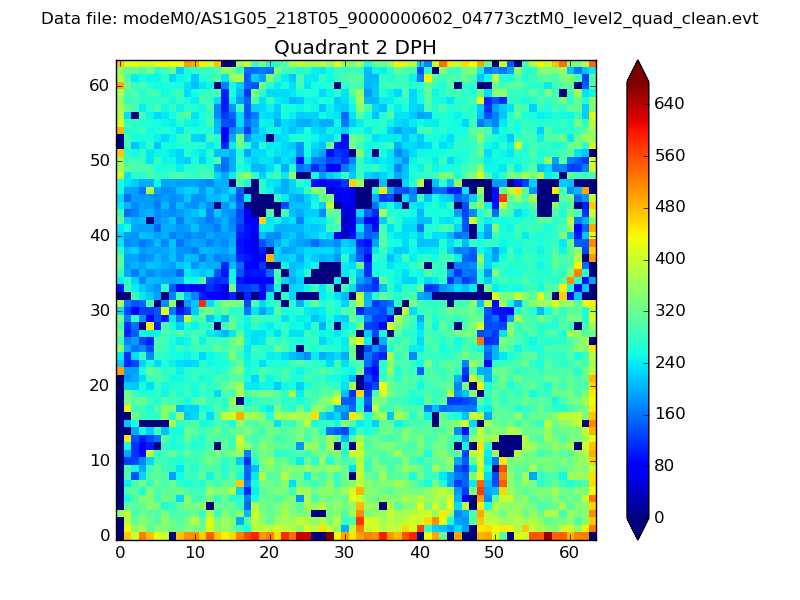
Histogram calculated using DETX and DETY for each event in the final _common_clean file
| Quadrant A | 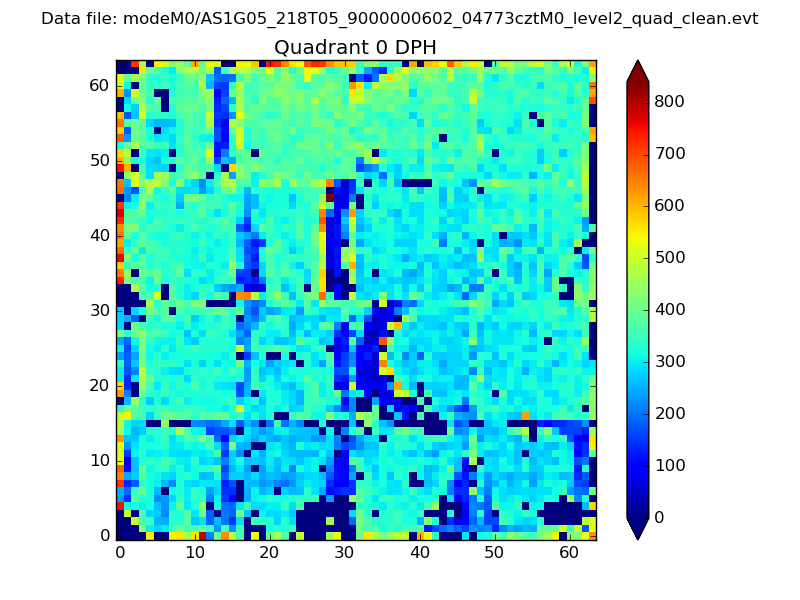 |
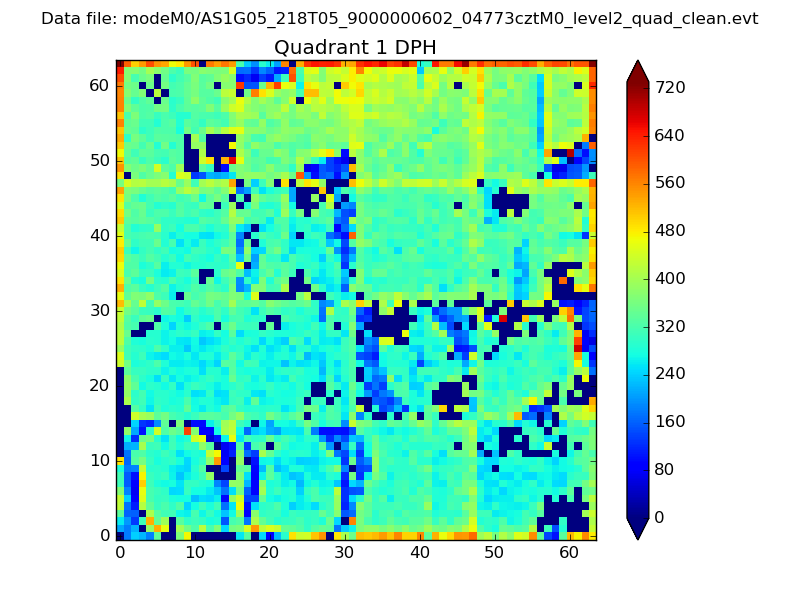 |
Quadrant B |
|---|---|---|---|
| Quadrant D | 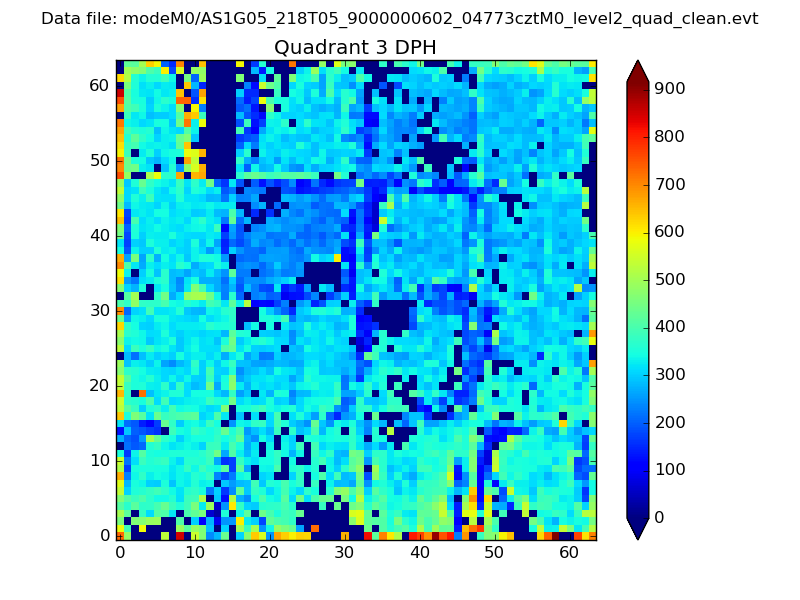 |
 |
Quadrant C |
| Plot type | Count rate plots | Images |
|---|---|---|
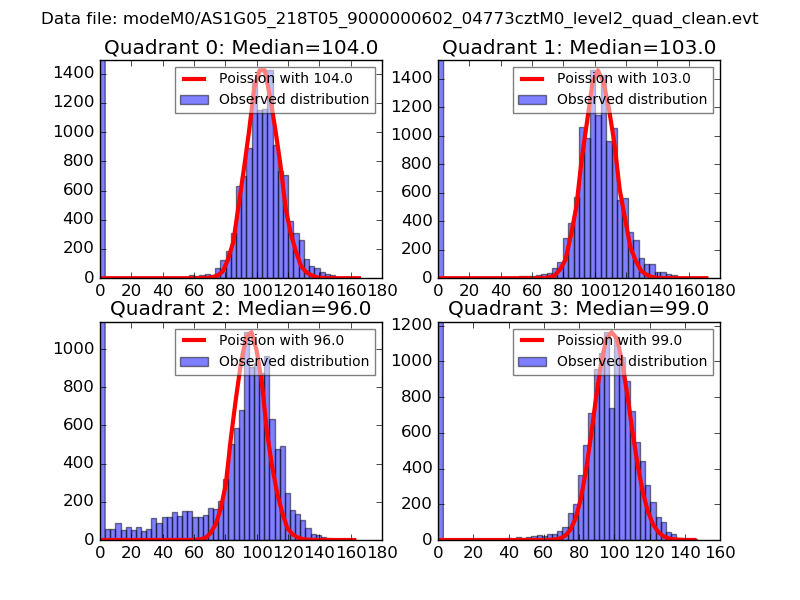
| Comparison with Poisson distribution Blue bars denote a histogram of data divided into 1 sec bins. Red curve is a Poisson curve with rate = median count rate of data. |
 |
 |
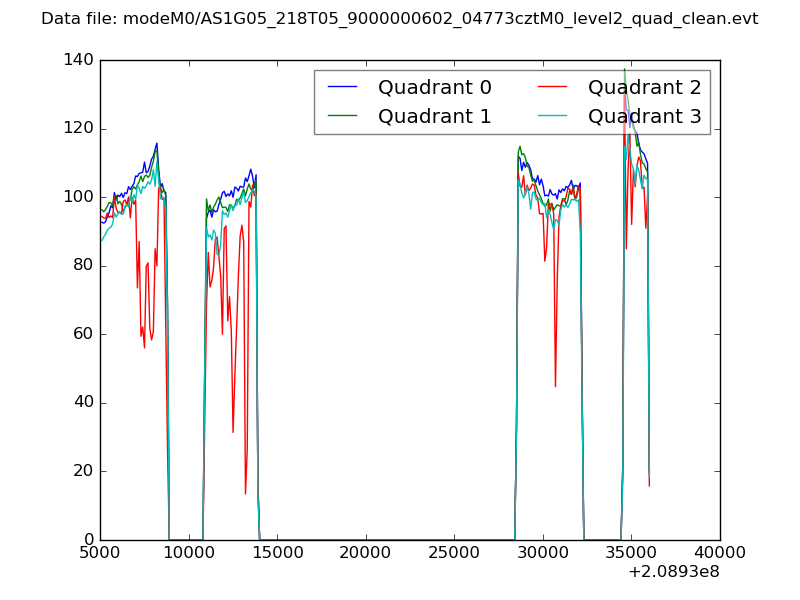
| Quadrant-wise count rates Data is divided into 100 sec bins |
 |
|
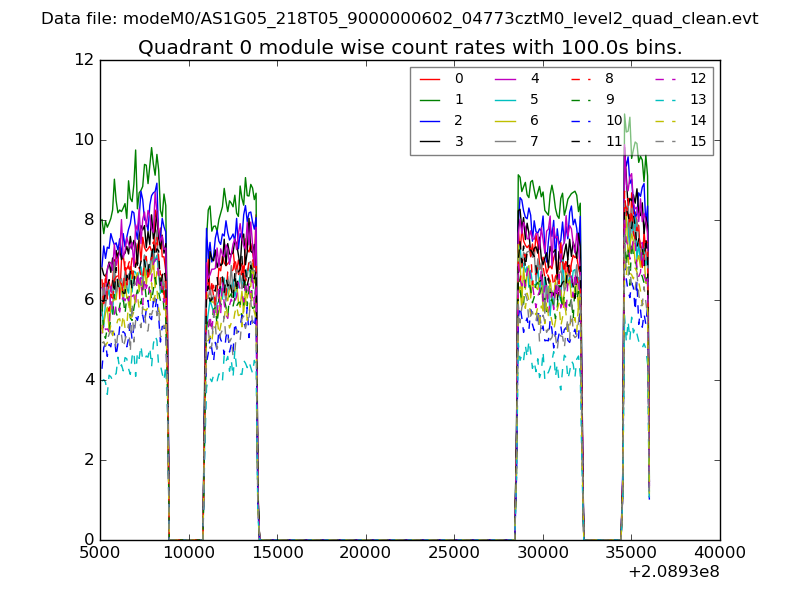
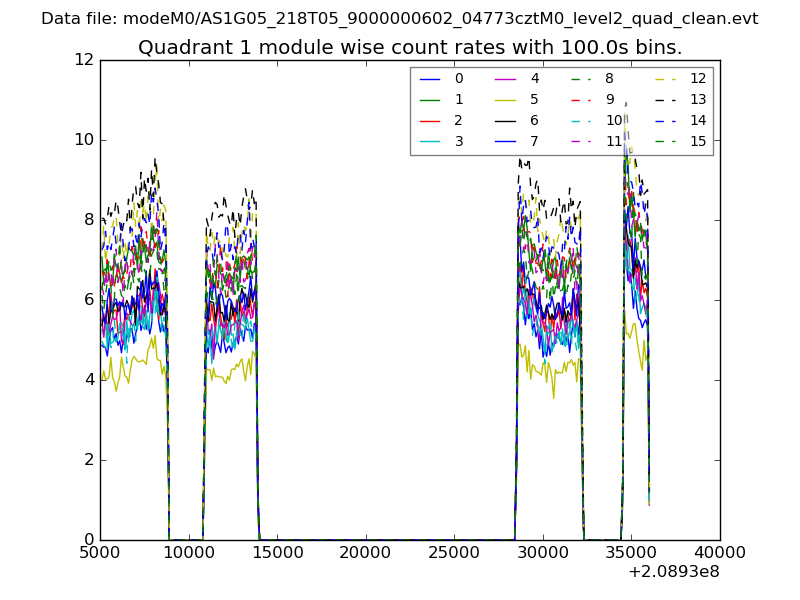
| Module-wise count rates for Quadrant A Data is divided into 100 sec bins |
 |
 |
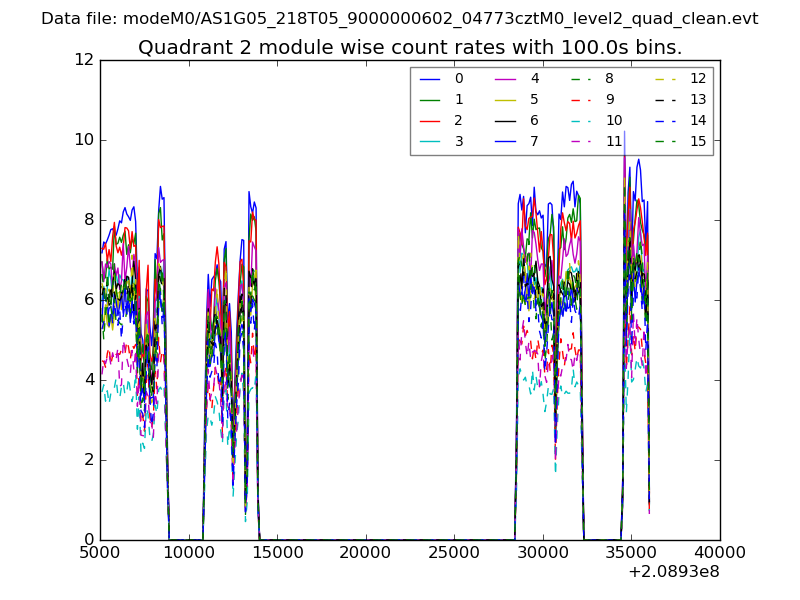
| Module-wise count rates for Quadrant B Data is divided into 100 sec bins |
 |
 |
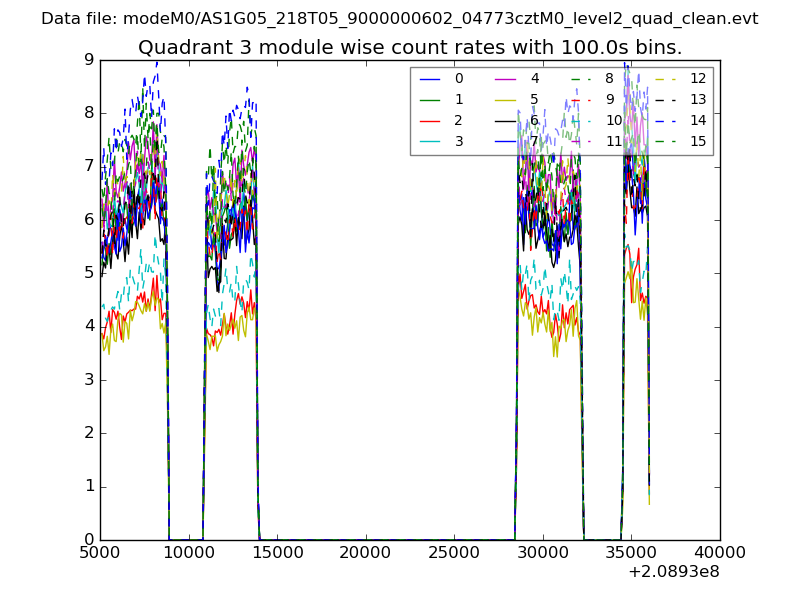
| Module-wise count rates for Quadrant C Data is divided into 100 sec bins |
 |
 |
| Module-wise count rates for Quadrant D Data is divided into 100 sec bins |
 |
 |
| Parameter | Plot |
|---|---|
| CZT HV Monitor |  |
| D_VDD | 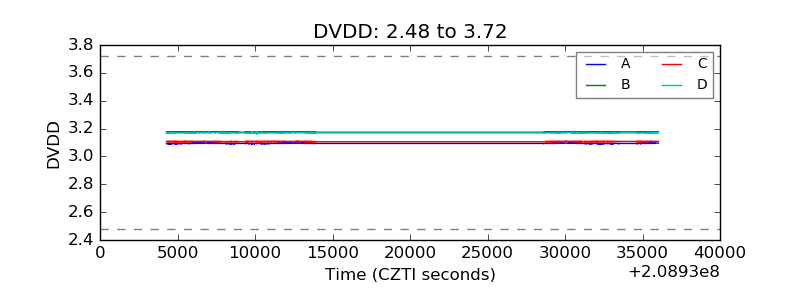 |
| Temperature 1 | 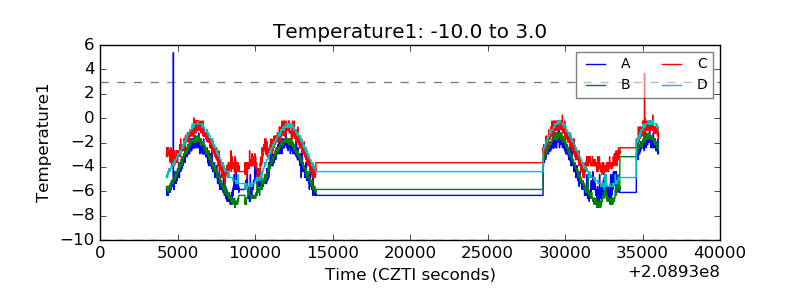 |
| Veto HV Monitor | 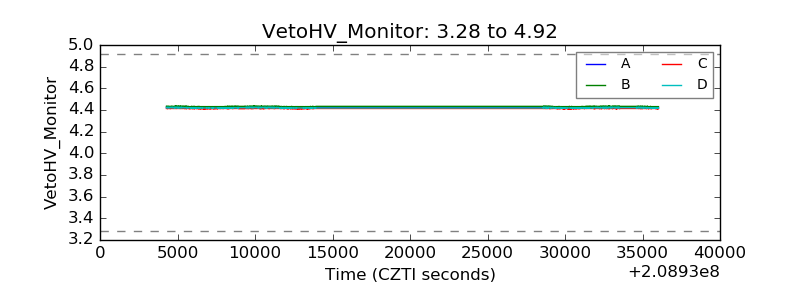 |
| Veto LLD | 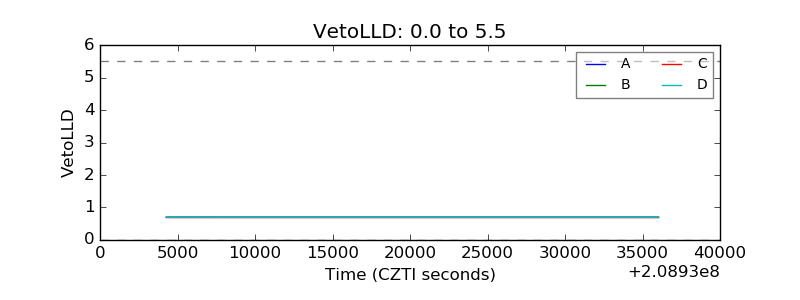 |
| Alpha Counter | 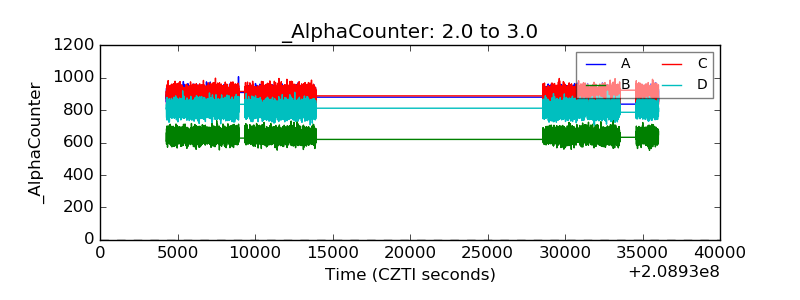 |
| _CPM_Rate | 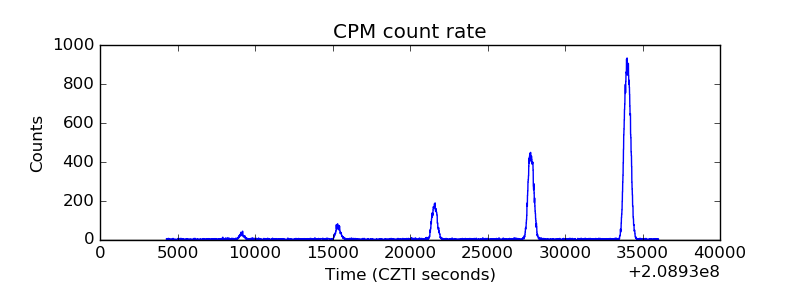 |
| CZT Counter | 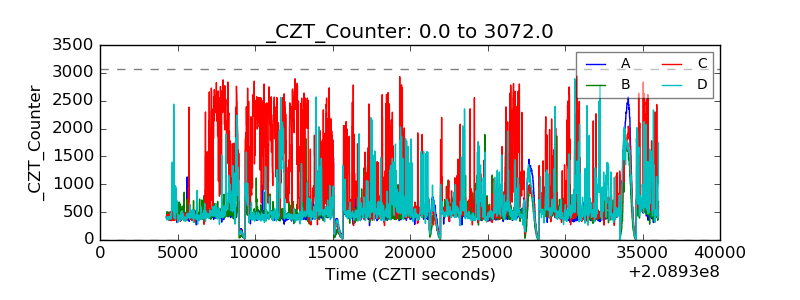 |
| +2.5 Volts monitor | 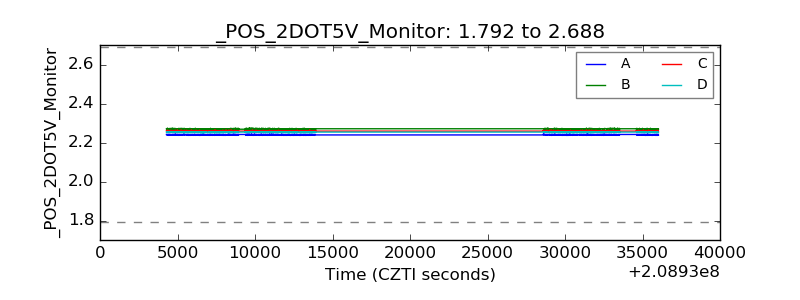 |
| +5 Volts monitor |  |
| _ROLL_ROT | 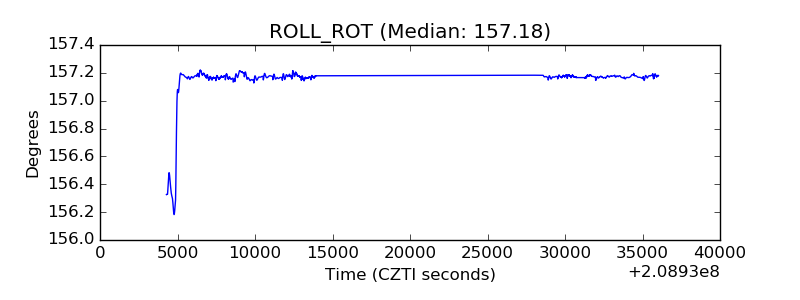 |
| _Roll_DEC | 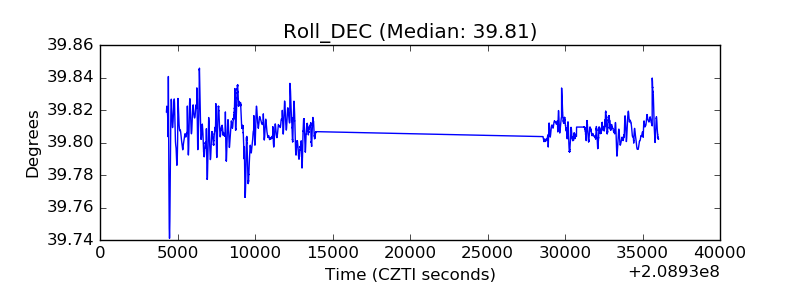 |
| _Roll_RA | 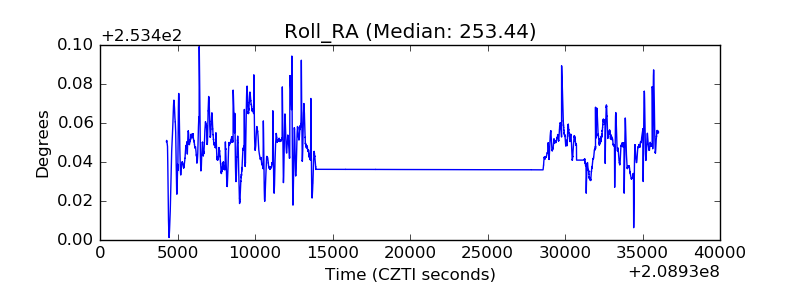 |
| Veto Counter | 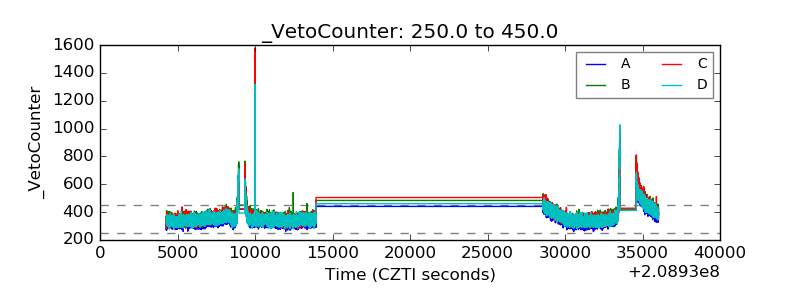 |