| Param | Original file | Final file |
|---|---|---|
| Filename | modeM0/AS1G05_218T05_9000000602_04775cztM0_level2.evt | modeM0/AS1G05_218T05_9000000602_04775cztM0_level2_quad_clean.evt |
| Size (bytes) | 543,150,720 | 82,307,520 |
| Size | 518.0 MB | 78.5 MB |
| Events in quadrant A | 3,221,328 | 529,158 |
| Events in quadrant B | 3,299,326 | 522,608 |
| Events in quadrant C | 4,212,991 | 510,170 |
| Events in quadrant D | 5,285,636 | 487,406 |
| Mode M9 | |||
|---|---|---|---|
| Quadrant | BADHDUFLAG | Total packets | Discarded packets |
| A | 0 | 12 | 0 |
| B | 0 | 12 | 0 |
| C | 0 | 12 | 0 |
| D | 0 | 13 | 0 |
| Mode SS | |||
|---|---|---|---|
| Quadrant | BADHDUFLAG | Total packets | Discarded packets |
| A | 0 | 130 | 0 |
| B | 0 | 130 | 0 |
| C | 0 | 130 | 0 |
| D | 0 | 130 | 0 |
| Mode M0 | |||
|---|---|---|---|
| Quadrant | BADHDUFLAG | Total packets | Discarded packets |
| A | 0 | 13954 | 3 |
| B | 0 | 13979 | 2 |
| C | 0 | 16871 | 2 |
| D | 0 | 20047 | 2 |
| Quadrant | Total seconds | Saturated seconds | Saturation percentage |
|---|---|---|---|
| A | 6344 | 69 | 1.087642% |
| B | 6344 | 72 | 1.134931% |
| C | 6344 | 170 | 2.679697% |
| D | 6344 | 324 | 5.107188% |
Noise dominated data is calculated using 1-second bins in cleaned event files. If a bin has >2000 counts, and if more than 50% of those come from <1% of pixels, then it is considered to be noise-dominated and hence unusable.
| Quadrant | # 1 sec bins | Bins with >0 counts | Bins with >2000 counts | High rate bins dominated by noise | Noise dominated (total time) | Noise dominated (detector-on time) | Marked lightcurve |
|---|---|---|---|---|---|---|---|
| A | 7574 | 6345 | 4 | 4 | 0.05% | 0.06% | 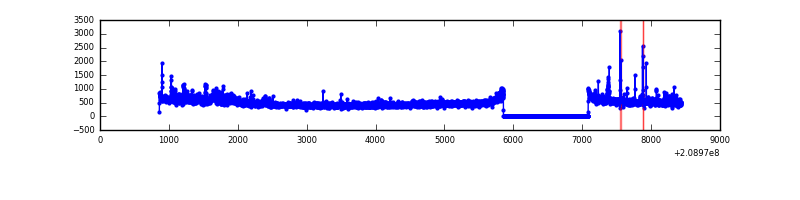 |
| B | 7574 | 6345 | 5 | 5 | 0.07% | 0.08% | 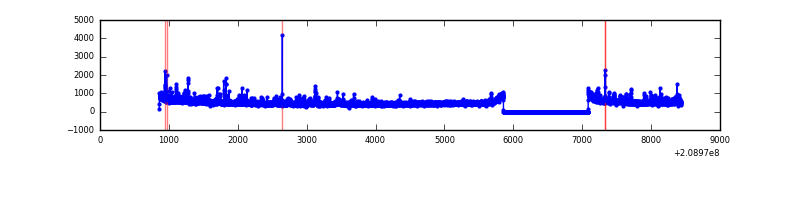 |
| C | 7574 | 6345 | 90 | 90 | 1.19% | 1.42% | 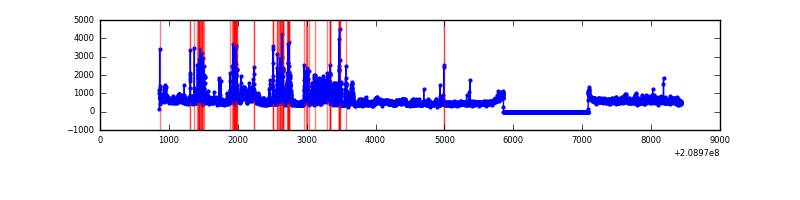 |
| D | 7574 | 6345 | 251 | 251 | 3.31% | 3.96% | 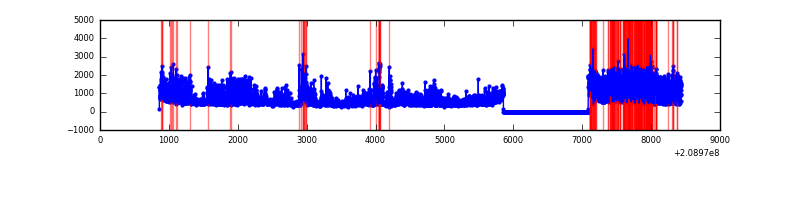 |
Top three noisy pixels from each quadrant. If the there are fewer than three noisy pixels in the level2.evt file, extra rows are filled as -1
| Pixel properties | Quadrant properties | ||||||
|---|---|---|---|---|---|---|---|
| Quadrant | DetID | PixID | Counts | Sigma | Mean | Median | Sigma |
| A | 8 | 15 | 203007 | 1317.37 | 768 | 753 | 153.5 |
| A | 0 | 149 | 23442 | 147.78 | 768 | 753 | 153.5 |
| A | 13 | 14 | 17173 | 106.95 | 768 | 753 | 153.5 |
| B | 4 | 80 | 177050 | 1211.6 | 773 | 755 | 145.5 |
| B | 14 | 167 | 72482 | 492.95 | 773 | 755 | 145.5 |
| B | 15 | 54 | 28618 | 191.49 | 773 | 755 | 145.5 |
| C | 14 | 48 | 1172129 | 6725.11 | 749 | 754 | 174.2 |
| C | 1 | 16 | 97502 | 555.45 | 749 | 754 | 174.2 |
| C | 9 | 237 | 13791 | 74.85 | 749 | 754 | 174.2 |
| D | 11 | 132 | 1942117 | 10938.65 | 743 | 722 | 177.5 |
| D | 13 | 235 | 153289 | 859.63 | 743 | 722 | 177.5 |
| D | 13 | 137 | 105514 | 590.44 | 743 | 722 | 177.5 |
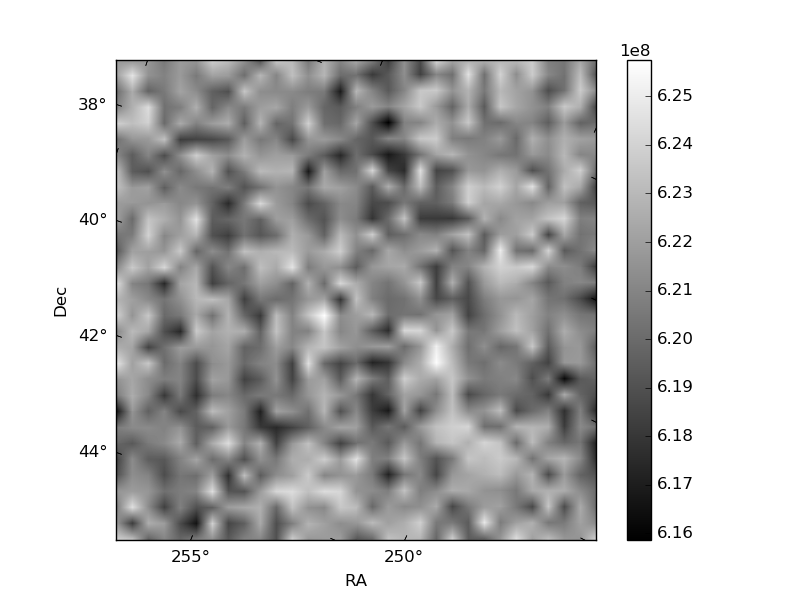
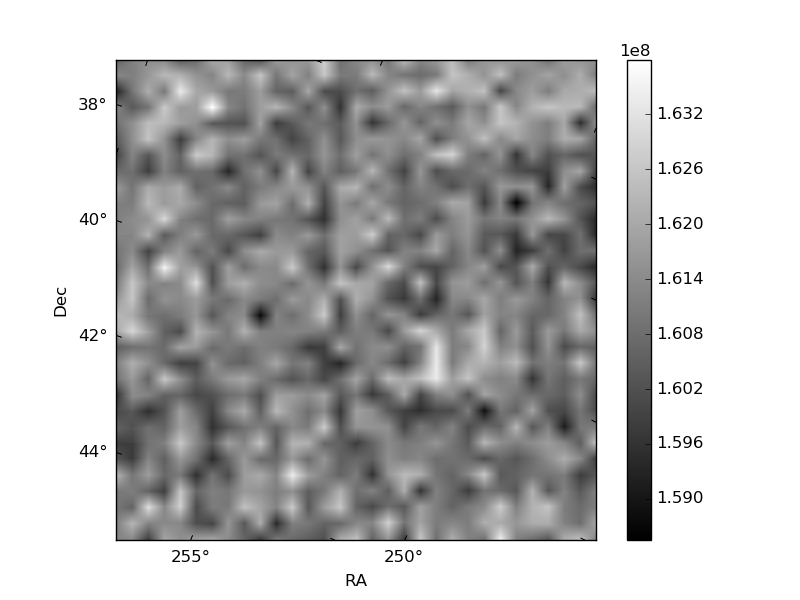
Histogram calculated using DETX and DETY for each event in the final _common_clean file
| Quadrant A | 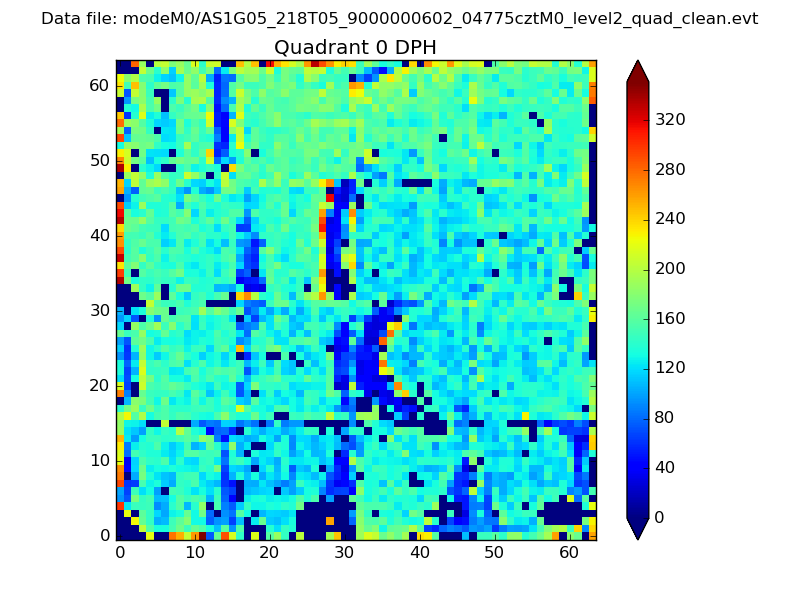 |
 |
Quadrant B |
|---|---|---|---|
| Quadrant D | 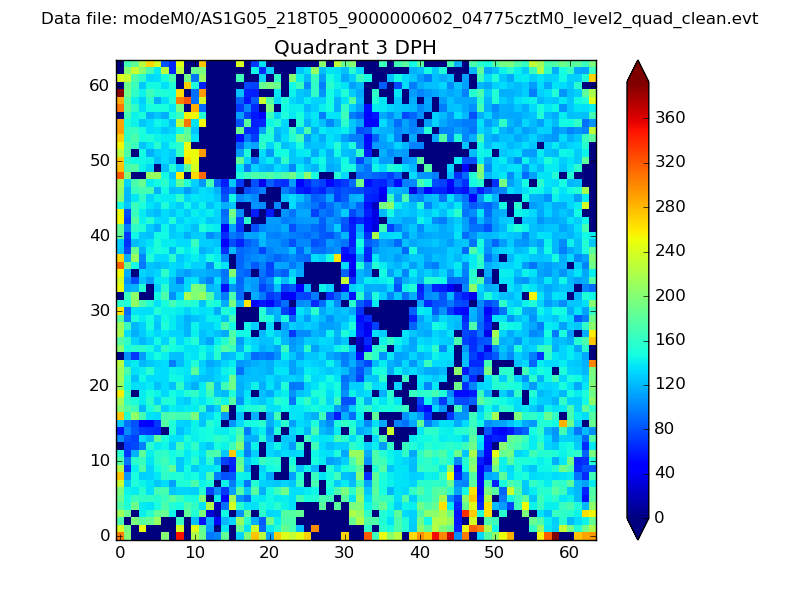 |
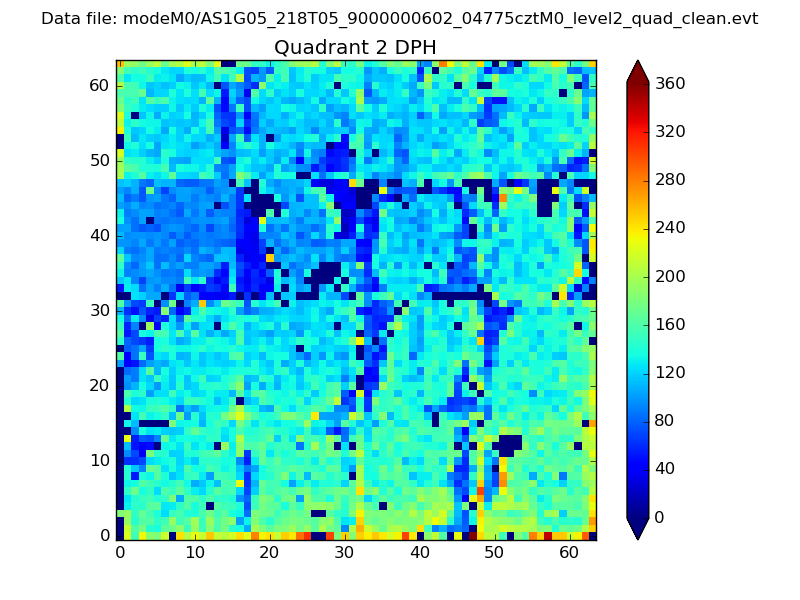 |
Quadrant C |
| Plot type | Count rate plots | Images |
|---|---|---|
| Comparison with Poisson distribution Blue bars denote a histogram of data divided into 1 sec bins. Red curve is a Poisson curve with rate = median count rate of data. |
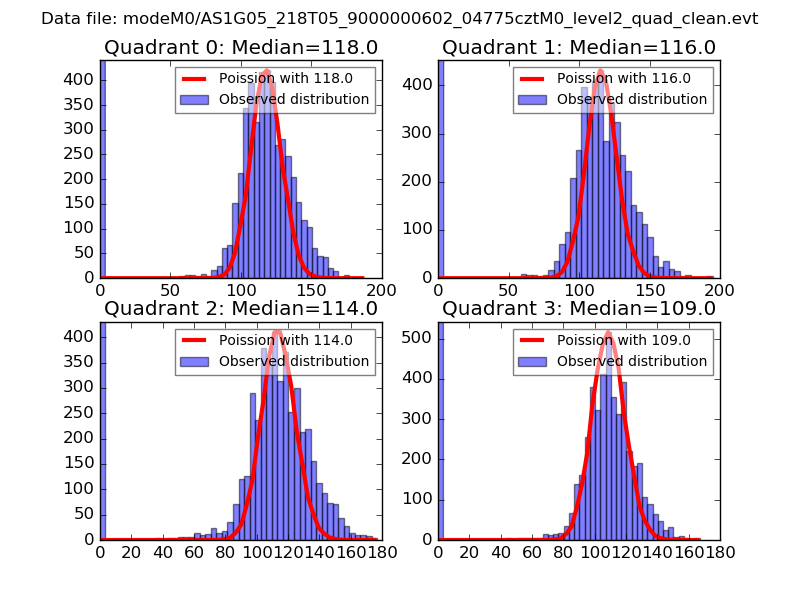 |
 |
| Quadrant-wise count rates Data is divided into 100 sec bins |
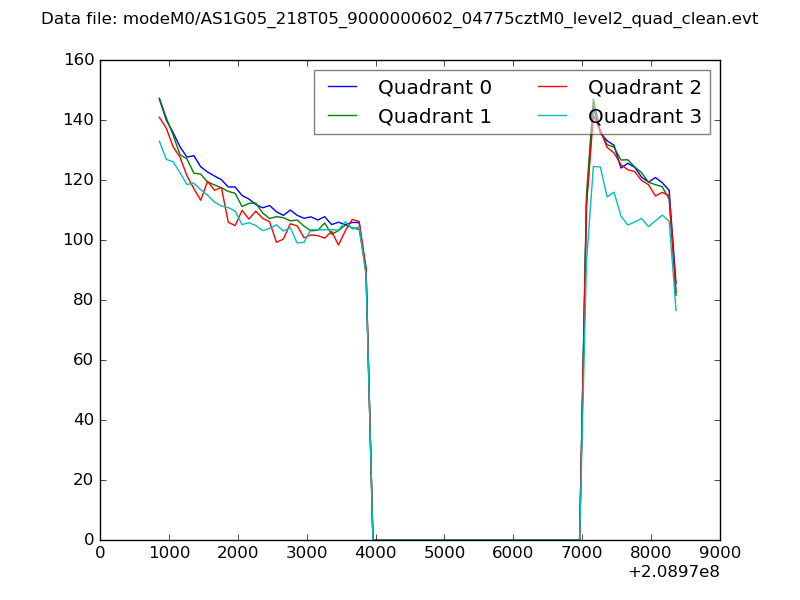 |
|
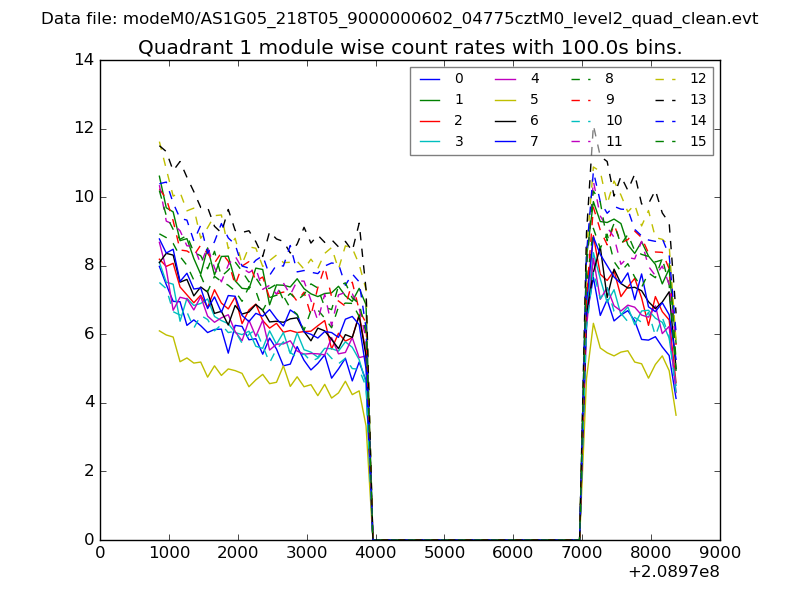
| Module-wise count rates for Quadrant A Data is divided into 100 sec bins |
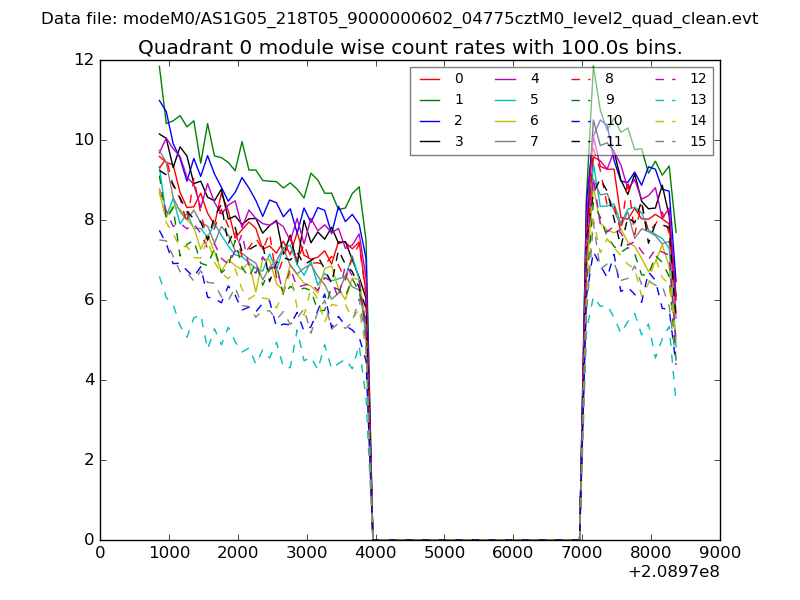 |
 |
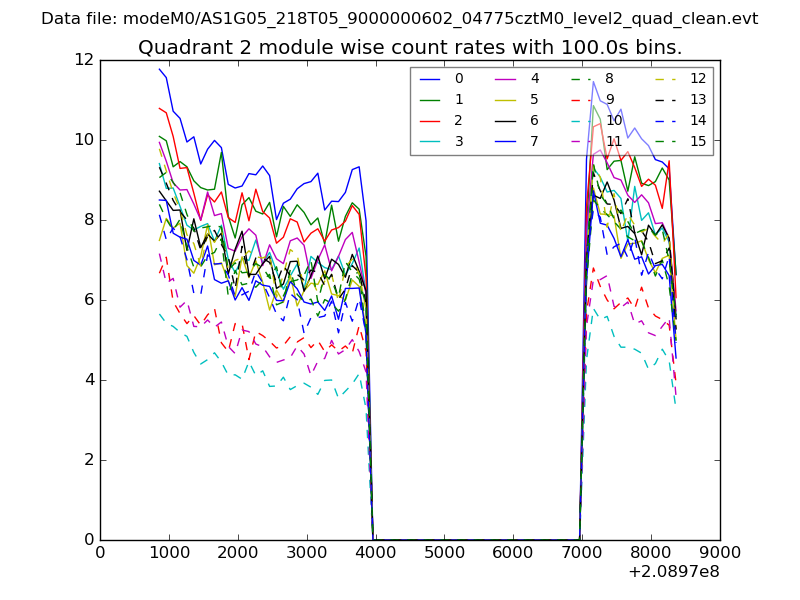
| Module-wise count rates for Quadrant B Data is divided into 100 sec bins |
 |
 |
| Module-wise count rates for Quadrant C Data is divided into 100 sec bins |
 |
 |
| Module-wise count rates for Quadrant D Data is divided into 100 sec bins |
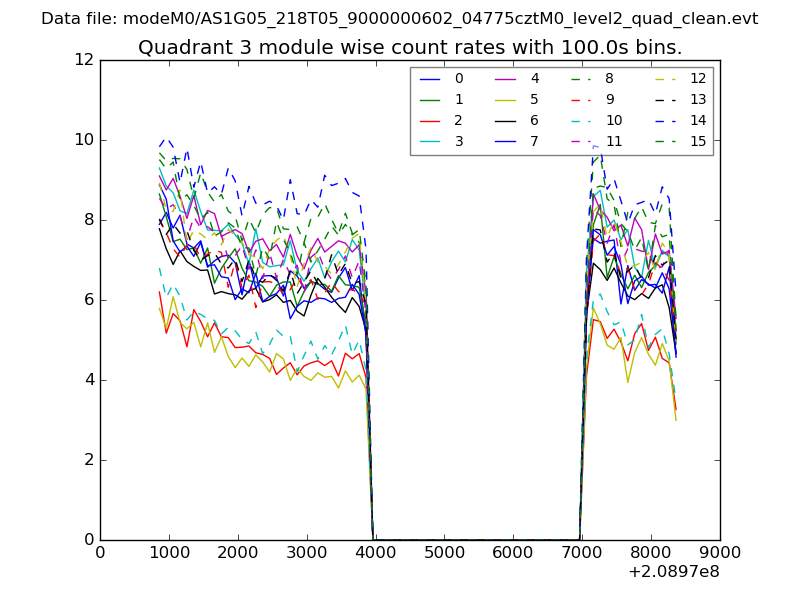 |
 |
| Parameter | Plot |
|---|---|
| CZT HV Monitor | 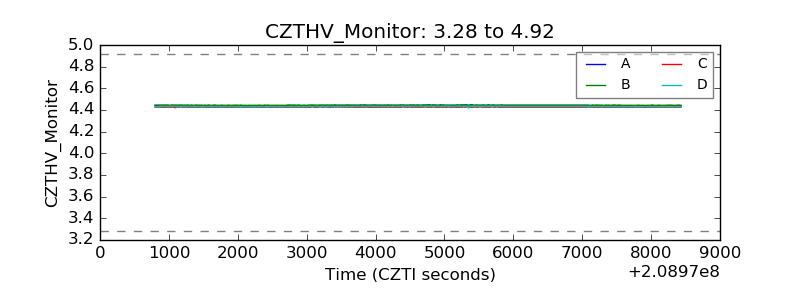 |
| D_VDD | 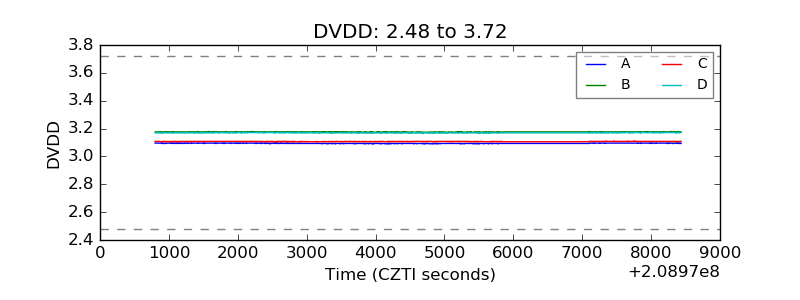 |
| Temperature 1 | 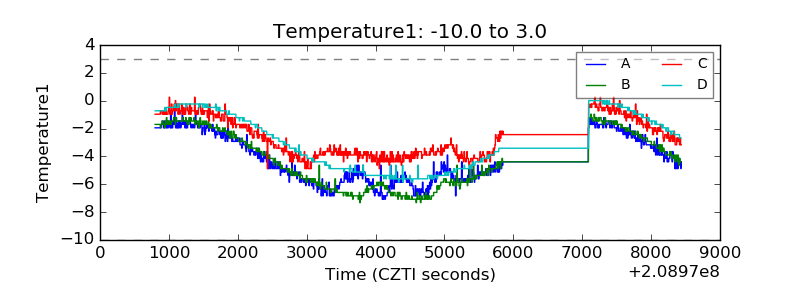 |
| Veto HV Monitor | 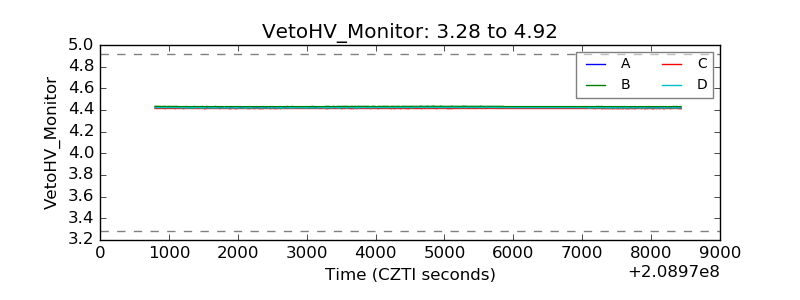 |
| Veto LLD | 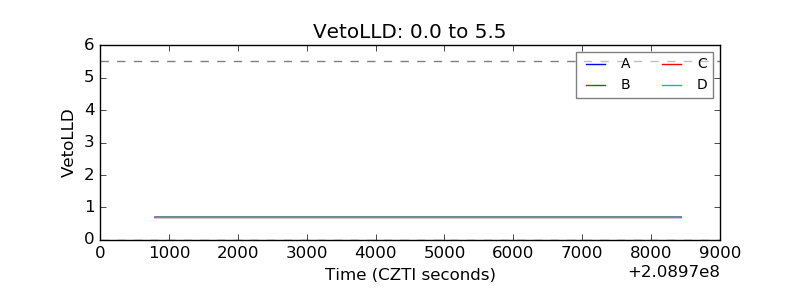 |
| Alpha Counter | 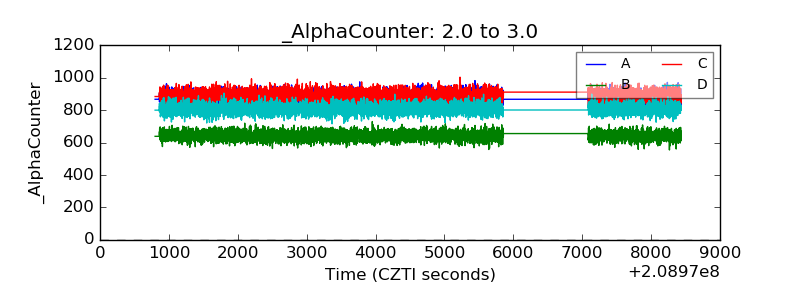 |
| _CPM_Rate | 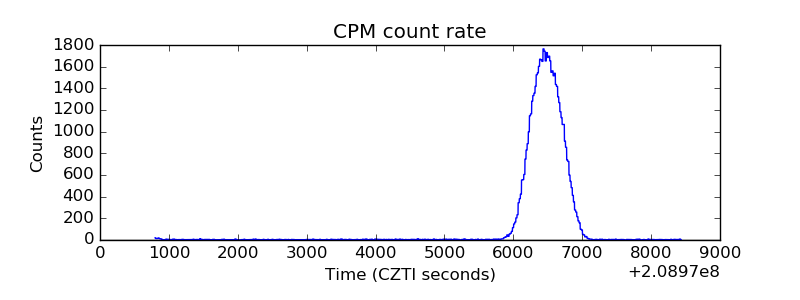 |
| CZT Counter | 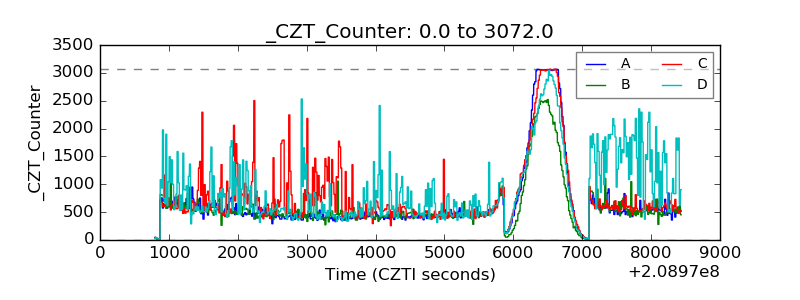 |
| +2.5 Volts monitor |  |
| +5 Volts monitor | 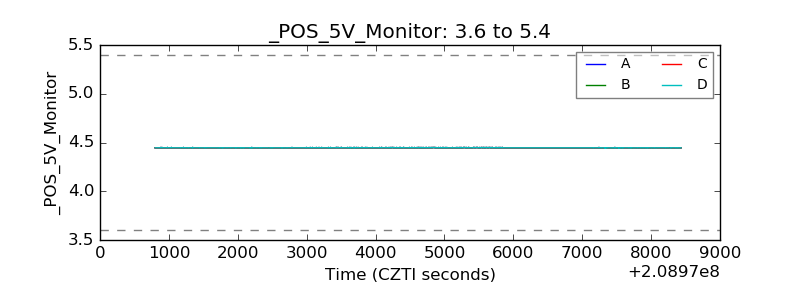 |
| _ROLL_ROT | 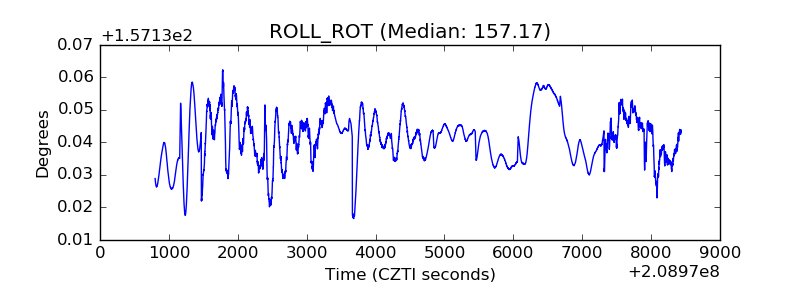 |
| _Roll_DEC | 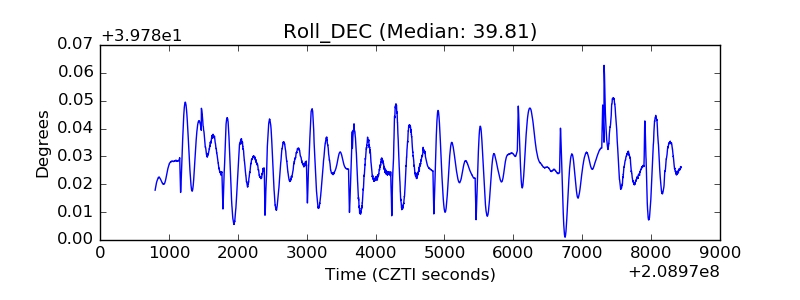 |
| _Roll_RA | 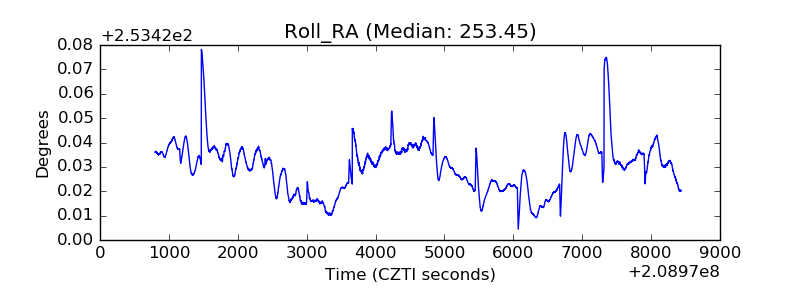 |
| Veto Counter | 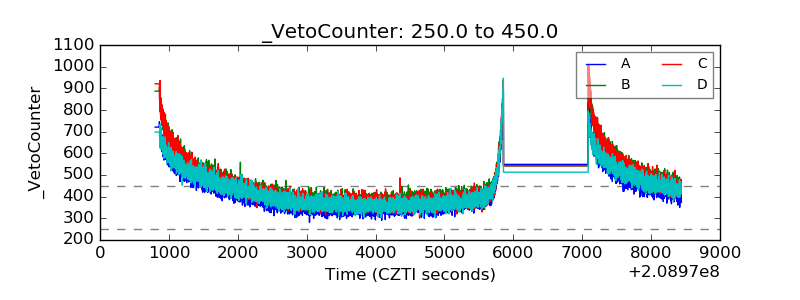 |