| Param | Original file | Final file |
|---|---|---|
| Filename | modeM0/AS1G05_218T05_9000000602_04776cztM0_level2.evt | modeM0/AS1G05_218T05_9000000602_04776cztM0_level2_quad_clean.evt |
| Size (bytes) | 618,269,760 | 80,303,040 |
| Size | 589.6 MB | 76.6 MB |
| Events in quadrant A | 3,185,432 | 512,853 |
| Events in quadrant B | 3,237,610 | 511,023 |
| Events in quadrant C | 4,418,913 | 501,370 |
| Events in quadrant D | 7,451,660 | 461,515 |
| Mode M9 | |||
|---|---|---|---|
| Quadrant | BADHDUFLAG | Total packets | Discarded packets |
| A | 0 | 13 | 0 |
| B | 0 | 13 | 0 |
| C | 0 | 13 | 0 |
| D | 0 | 14 | 0 |
| Mode SS | |||
|---|---|---|---|
| Quadrant | BADHDUFLAG | Total packets | Discarded packets |
| A | 0 | 130 | 0 |
| B | 0 | 130 | 0 |
| C | 0 | 130 | 0 |
| D | 0 | 130 | 0 |
| Mode M0 | |||
|---|---|---|---|
| Quadrant | BADHDUFLAG | Total packets | Discarded packets |
| A | 0 | 13597 | 3 |
| B | 0 | 13798 | 2 |
| C | 0 | 17631 | 2 |
| D | 0 | 26540 | 2 |
| Quadrant | Total seconds | Saturated seconds | Saturation percentage |
|---|---|---|---|
| A | 6371 | 60 | 0.941767% |
| B | 6371 | 60 | 0.941767% |
| C | 6371 | 627 | 9.841469% |
| D | 6371 | 439 | 6.890598% |
Noise dominated data is calculated using 1-second bins in cleaned event files. If a bin has >2000 counts, and if more than 50% of those come from <1% of pixels, then it is considered to be noise-dominated and hence unusable.
| Quadrant | # 1 sec bins | Bins with >0 counts | Bins with >2000 counts | High rate bins dominated by noise | Noise dominated (total time) | Noise dominated (detector-on time) | Marked lightcurve |
|---|---|---|---|---|---|---|---|
| A | 7656 | 6372 | 4 | 4 | 0.05% | 0.06% | 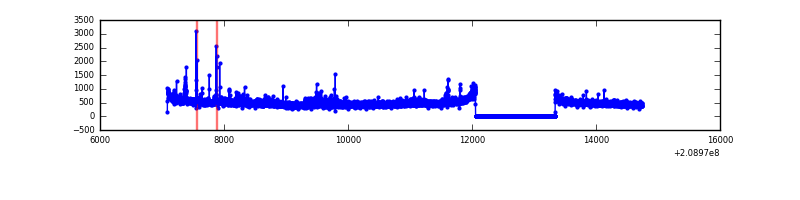 |
| B | 7656 | 6372 | 5 | 5 | 0.07% | 0.08% | 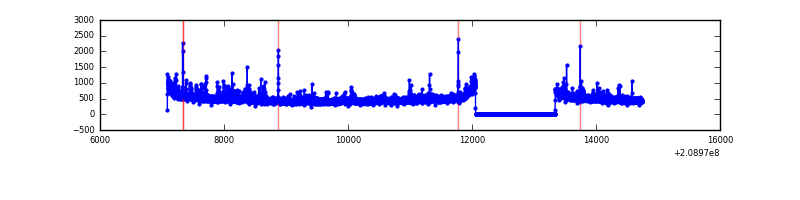 |
| C | 7656 | 6372 | 238 | 238 | 3.11% | 3.74% | 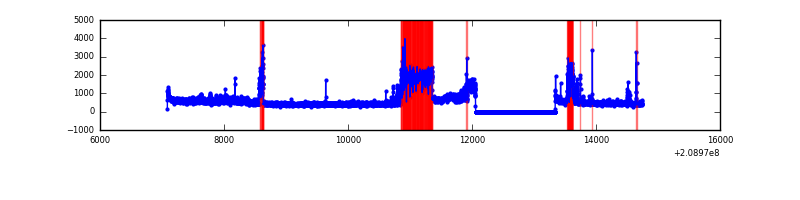 |
| D | 7656 | 6372 | 439 | 439 | 5.73% | 6.89% | 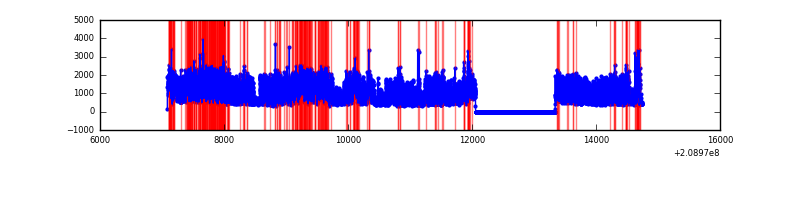 |
Top three noisy pixels from each quadrant. If the there are fewer than three noisy pixels in the level2.evt file, extra rows are filled as -1
| Pixel properties | Quadrant properties | ||||||
|---|---|---|---|---|---|---|---|
| Quadrant | DetID | PixID | Counts | Sigma | Mean | Median | Sigma |
| A | 8 | 15 | 173568 | 1115.14 | 768 | 752 | 155.0 |
| A | 0 | 149 | 24318 | 152.07 | 768 | 752 | 155.0 |
| A | 13 | 251 | 13887 | 84.76 | 768 | 752 | 155.0 |
| B | 4 | 80 | 147680 | 999.35 | 774 | 756 | 147.0 |
| B | 14 | 167 | 62919 | 422.82 | 774 | 756 | 147.0 |
| B | 15 | 204 | 22768 | 149.72 | 774 | 756 | 147.0 |
| C | 14 | 48 | 1491273 | 8685.64 | 738 | 739 | 171.6 |
| C | 1 | 16 | 38589 | 220.56 | 738 | 739 | 171.6 |
| C | 13 | 61 | 6040 | 30.89 | 738 | 739 | 171.6 |
| D | 11 | 132 | 3956524 | 22419.78 | 734 | 713 | 176.4 |
| D | 13 | 235 | 235503 | 1330.69 | 734 | 713 | 176.4 |
| D | 1 | 31 | 126415 | 712.42 | 734 | 713 | 176.4 |
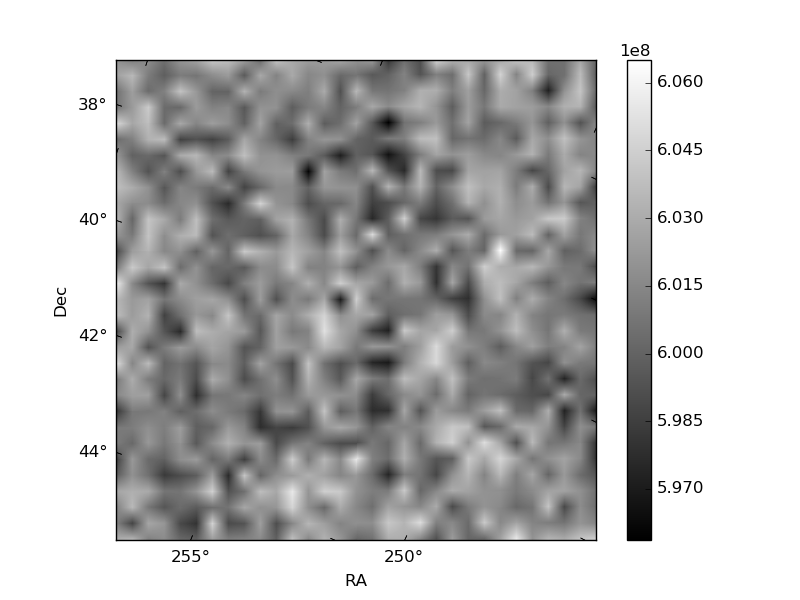
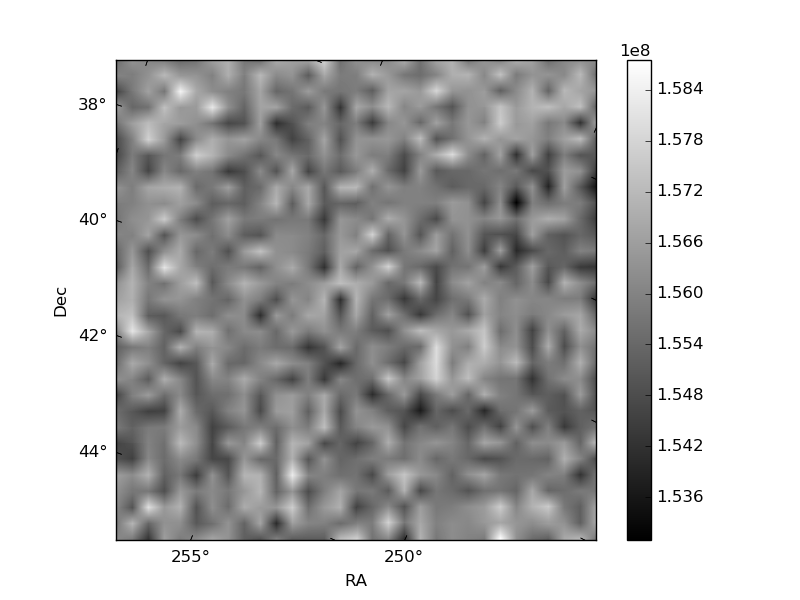
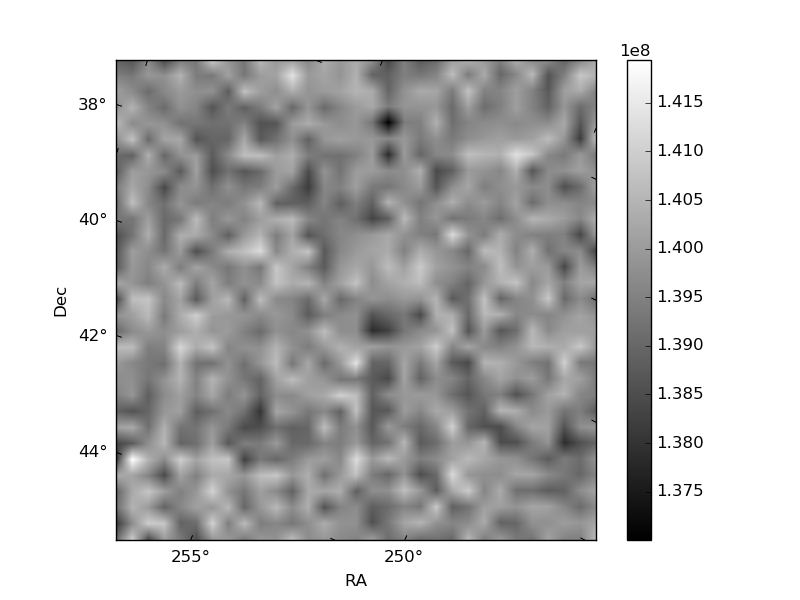
Histogram calculated using DETX and DETY for each event in the final _common_clean file
| Quadrant A | 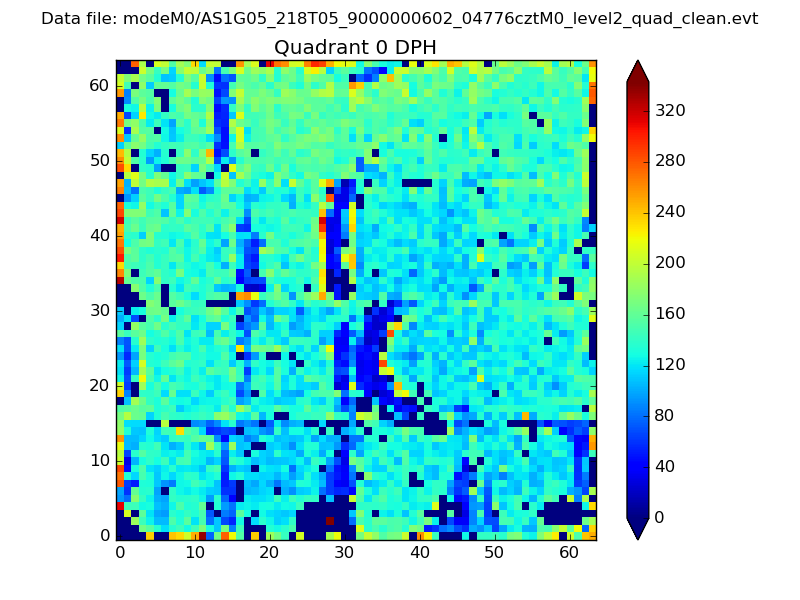 |
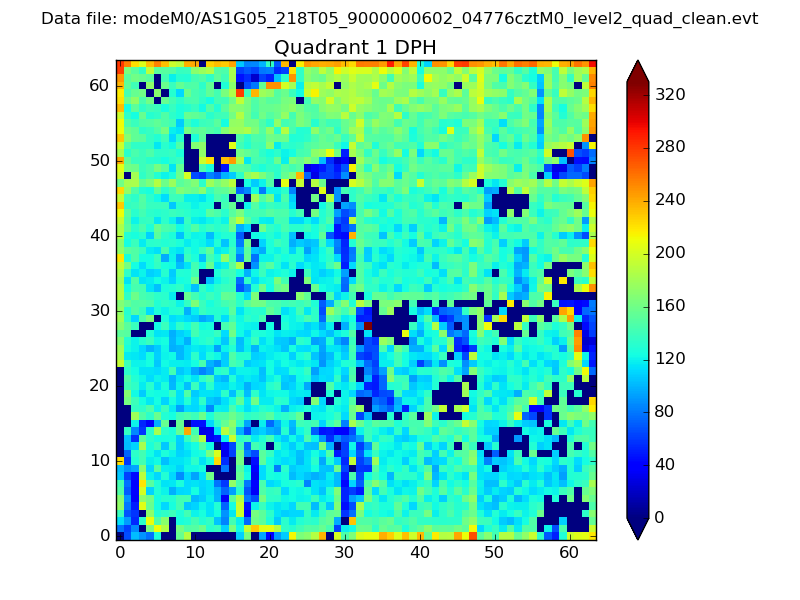 |
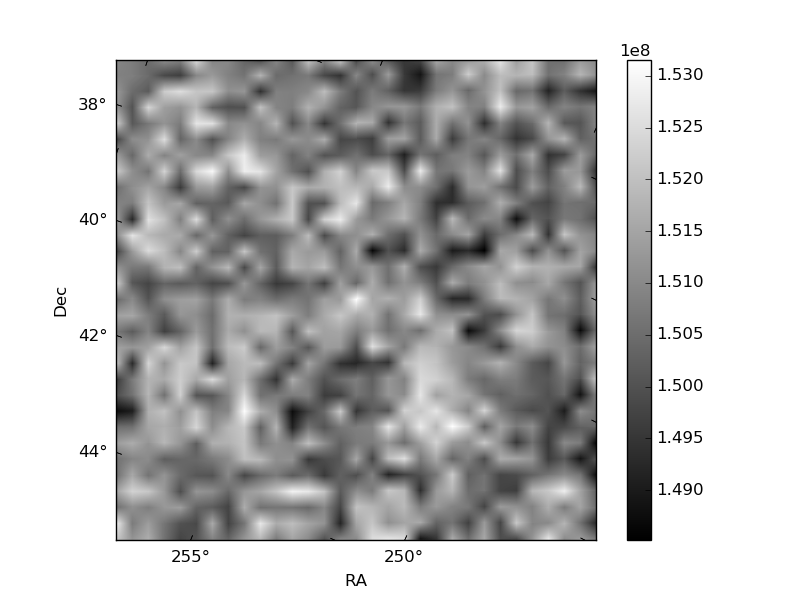
Quadrant B |
|---|---|---|---|
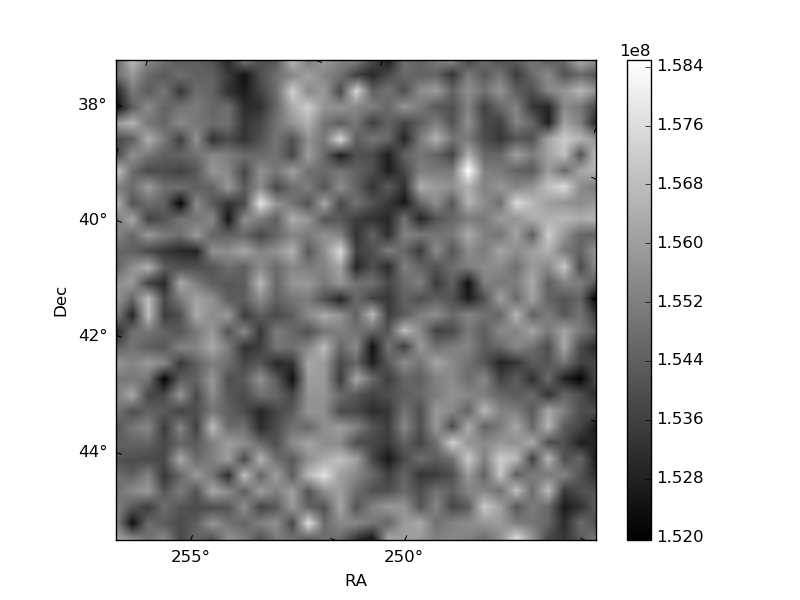
| Quadrant D | 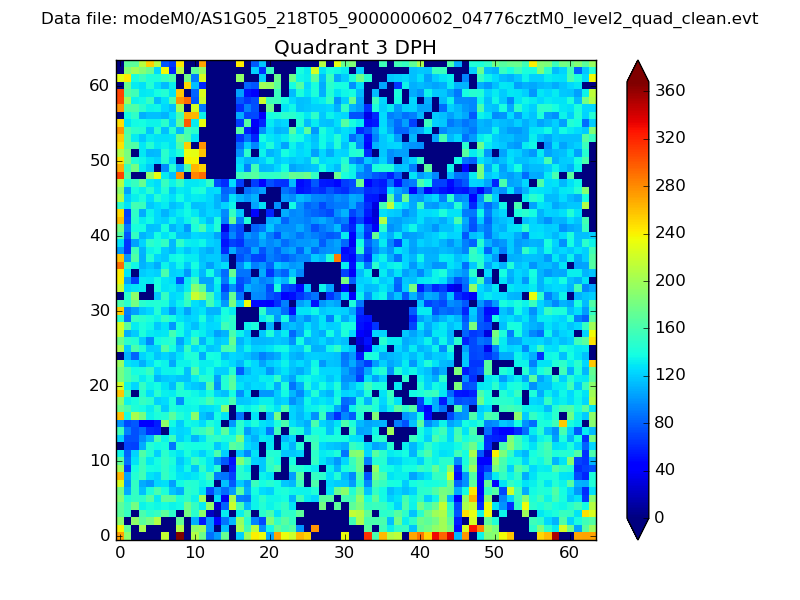 |
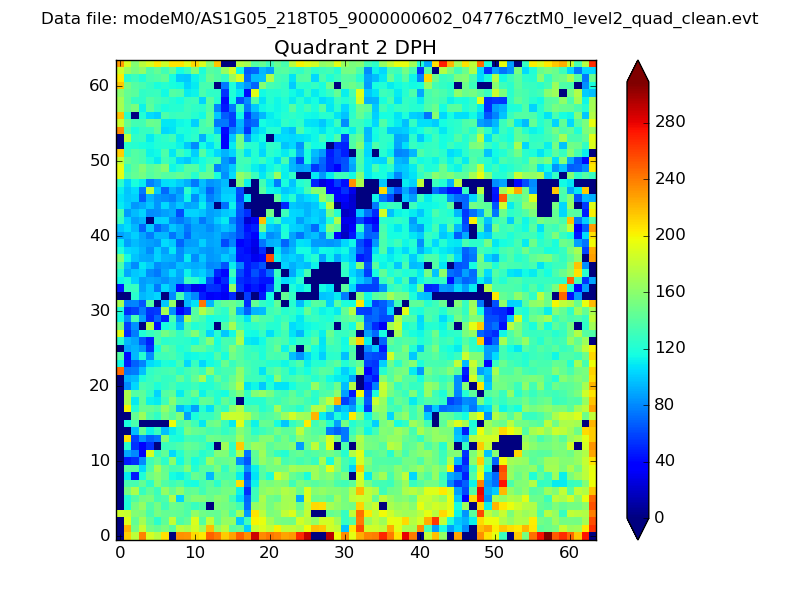 |
Quadrant C |
| Plot type | Count rate plots | Images |
|---|---|---|
| Comparison with Poisson distribution Blue bars denote a histogram of data divided into 1 sec bins. Red curve is a Poisson curve with rate = median count rate of data. |
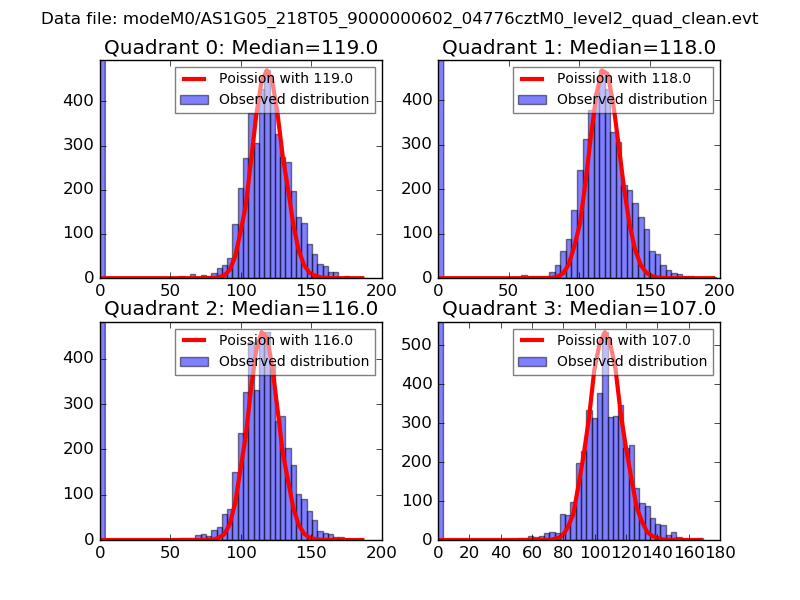 |
 |
| Quadrant-wise count rates Data is divided into 100 sec bins |
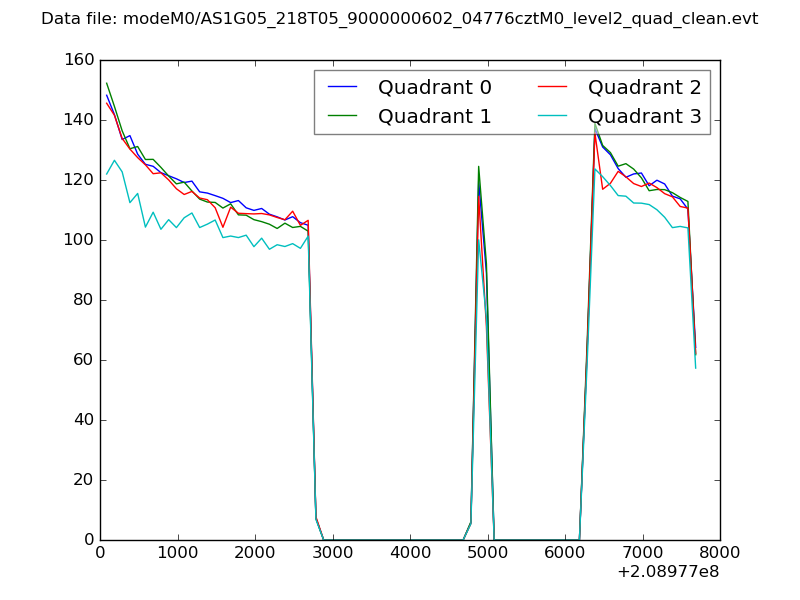 |
|
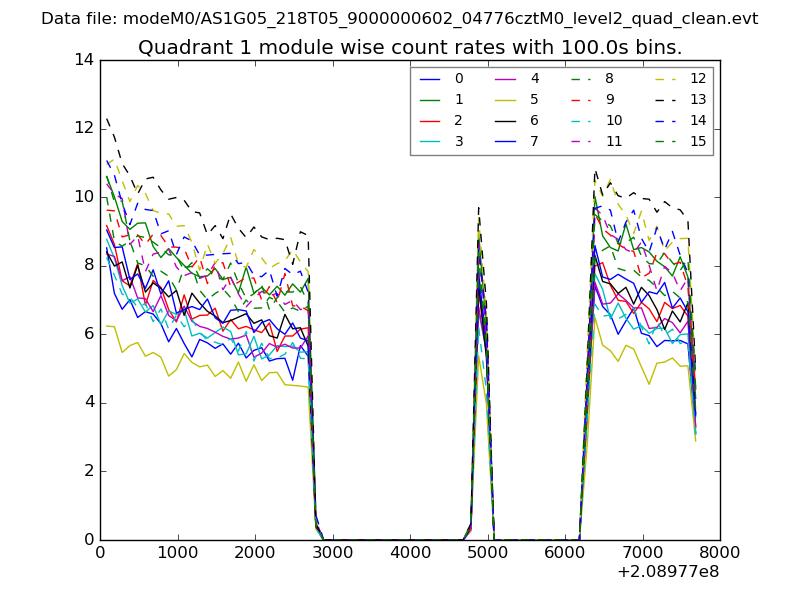
| Module-wise count rates for Quadrant A Data is divided into 100 sec bins |
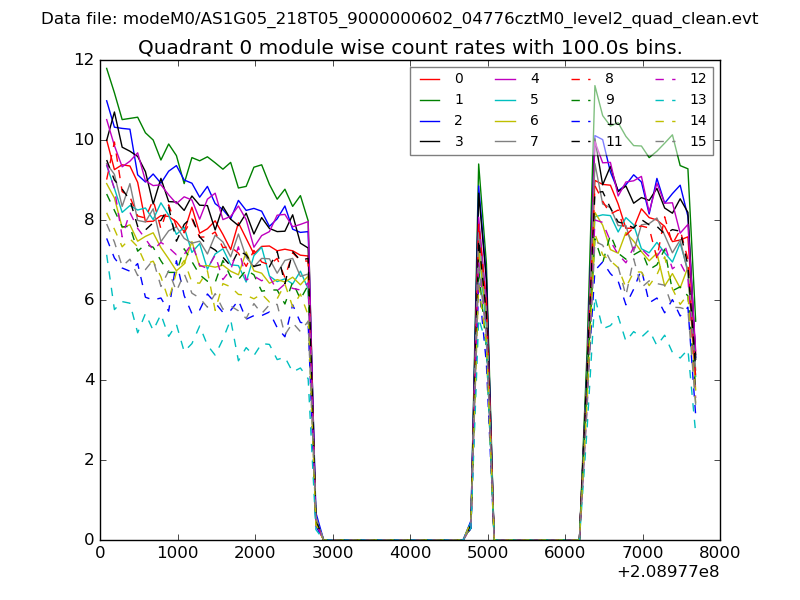 |
 |
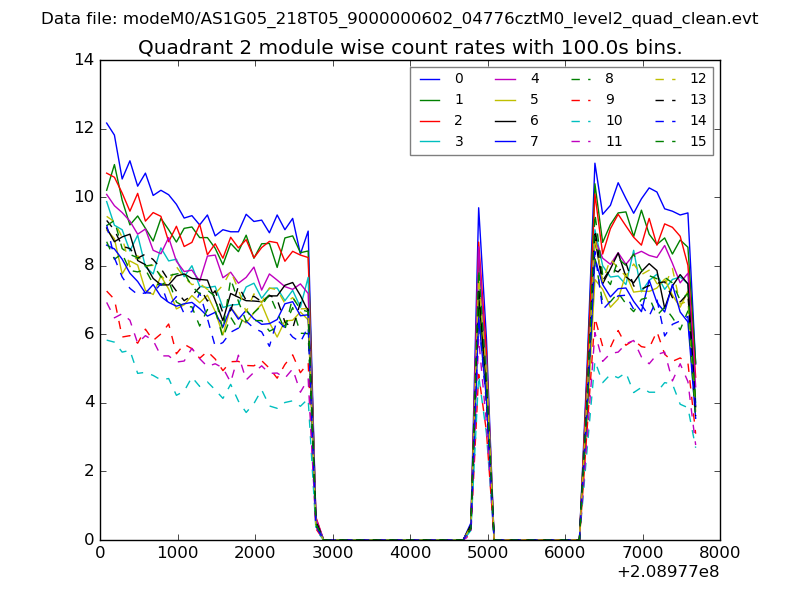
| Module-wise count rates for Quadrant B Data is divided into 100 sec bins |
 |
 |
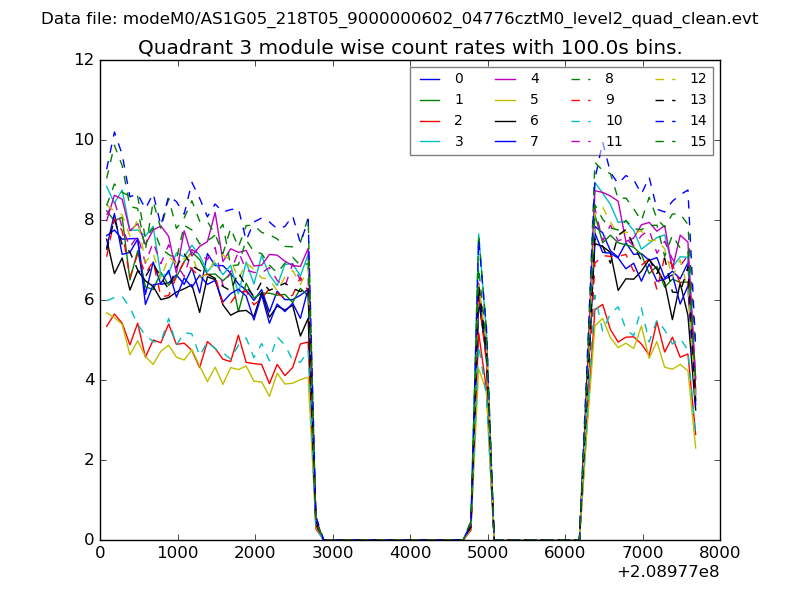
| Module-wise count rates for Quadrant C Data is divided into 100 sec bins |
 |
 |
| Module-wise count rates for Quadrant D Data is divided into 100 sec bins |
 |
 |
| Parameter | Plot |
|---|---|
| CZT HV Monitor |  |
| D_VDD | 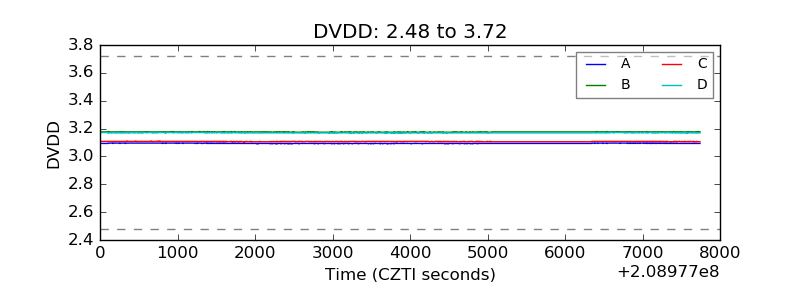 |
| Temperature 1 | 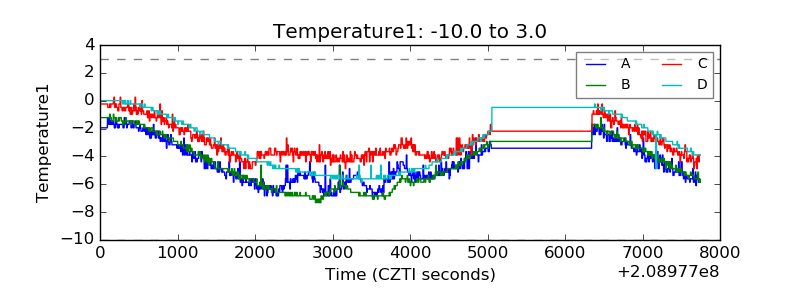 |
| Veto HV Monitor | 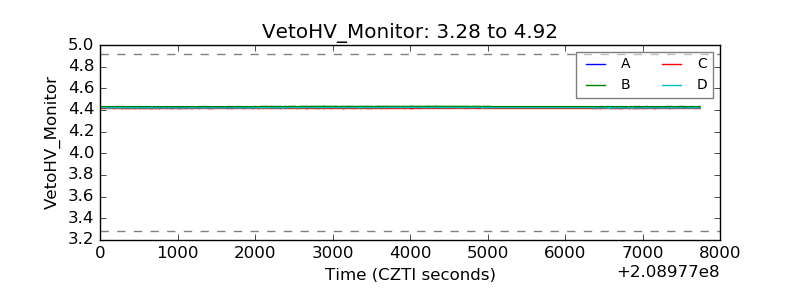 |
| Veto LLD | 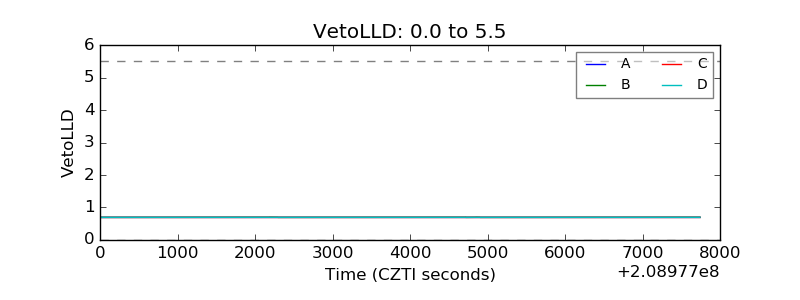 |
| Alpha Counter | 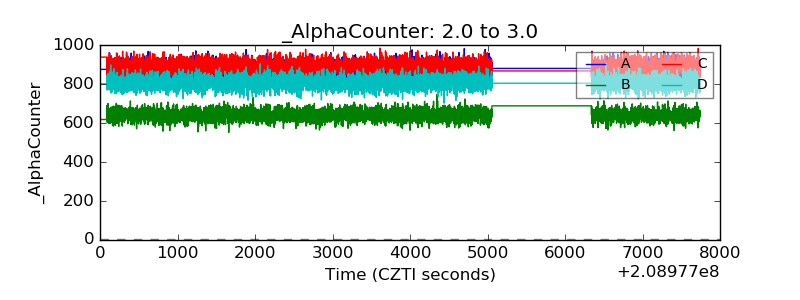 |
| _CPM_Rate | 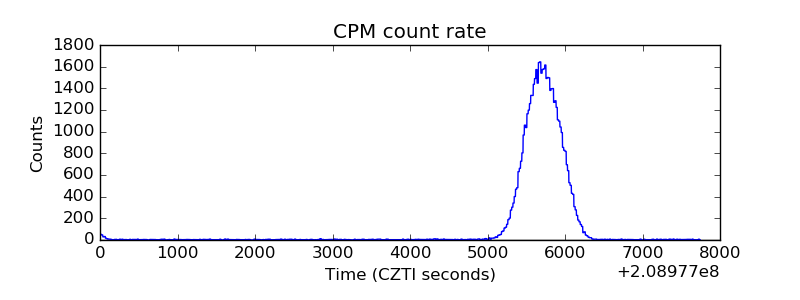 |
| CZT Counter | 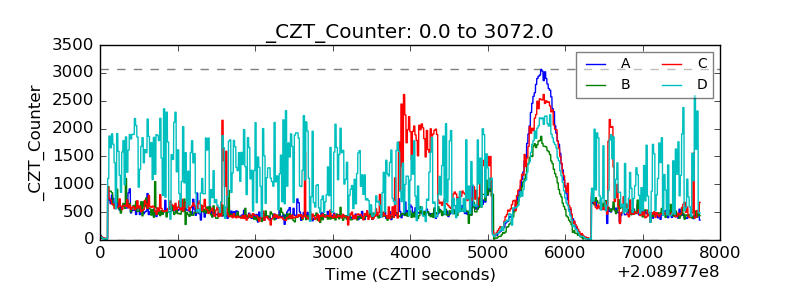 |
| +2.5 Volts monitor | 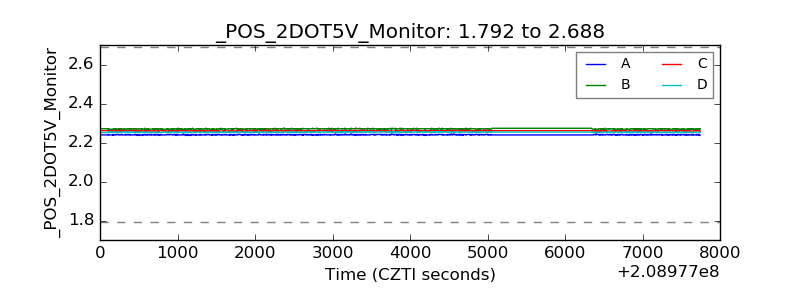 |
| +5 Volts monitor | 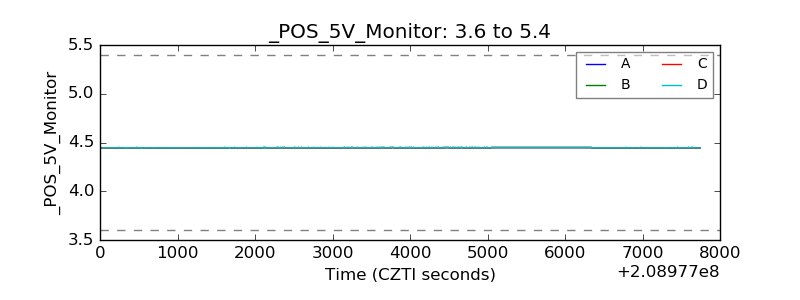 |
| _ROLL_ROT | 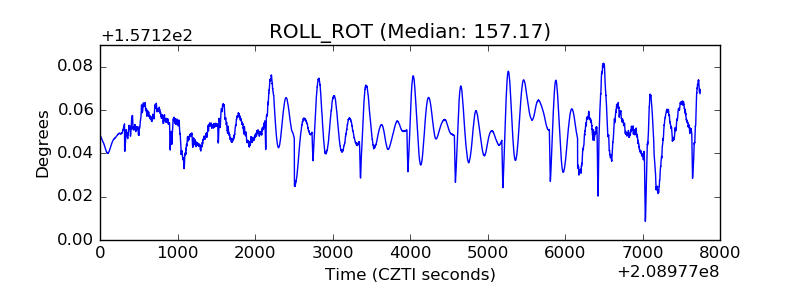 |
| _Roll_DEC | 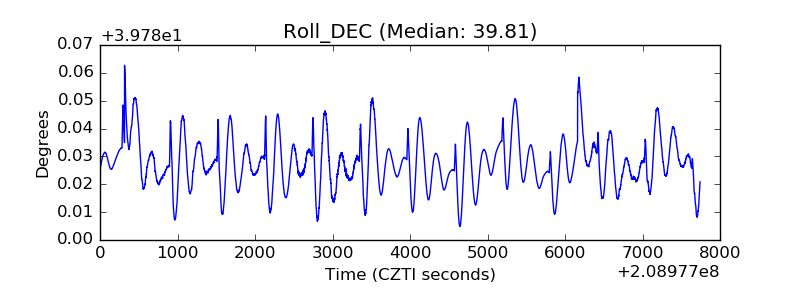 |
| _Roll_RA | 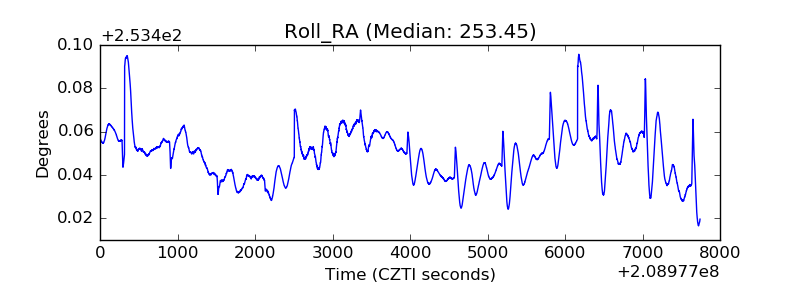 |
| Veto Counter | 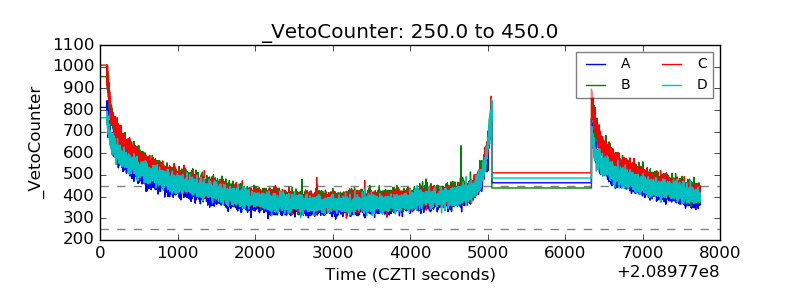 |